Video Structure Analysis
TSINGHUA SCIENCE AND TECHNOLOGY
ISSN1007-021414/20pp714-718
Volume12,Number6,December2007
Video Structure Analysis*
ZHANG Songhai (张松海)1,**, ZHANG Yifei (张一飞)1, CHEN Tao (陈韬)1,
Peter M. Hall2, Ralph Martin3
1. Department of Computer Science and Technology, Tsinghua University, Beijing 100084, China;
2. Department of Computer Science, University of Bath Bath BA2 7AY, United Kingdom;
3. School of Computer Science, Cardiff University, Wales CF24 3AA, United Kingdom
Abstract: Video structure analysis is a basic requirement for most content-based video editing and process-ing systems. This paper presents a fast video structure analysis method based on image segmentation in each frame, with region matching between frames. The structure analysis decomposes the video into sev-eral moving objects, including information about their colors, positions, shapes, movements, and lifetimes.
The method also supports user interactions to improve the results. The result shows that this method is fast and stable and can complete video analyzing interactively.
Key words: video structure analysis; video segmentation; image segmentation; region matching
Introduction
Video editing is widely used not only in professional movie making, but also in many other areas such as home videos, educational videos, and marketing videos. With the popularization of video cameras, even more potential applications are developing. Even relatively straightforward applications may wish to edit the video (for example, to remove an unwanted object from a scene) to process it in some other way (for example, to re-render it as a cartoon). In general, such tasks need an understanding of the structure of the video content, as a basis both for editing and for more advanced and complex video processing operations.
The need to treat the whole video in a coherent manner has been emphasized in several previous publications. For example, a video-tooning approach[1] pays particular attention to providing coherent segmen- tation in the space-time space to re-render the video as a cartoon animation. A recent paper on motion layer-based object removal in videos[2] also proposed a mo-tion-based video segmentation method as a preparatory step to object removal.
In many applications, this video analysis and seg-mentation step is the most time consuming step in the application. For example, video tooning may take sev-eral hours to segment a short video clip. This paper presents a fast video structure analysis method based on image segmentation in each frame, with region matching between frames.
1 Related Work
The two main kinds of information in any video are the color appearance and the visual motion, which leads to three approaches to video analysis. (1) The first is based on motion tracking[3] as in the method used in the motion layer-based object removal[2]. Such ap-proaches are suitable to videos with many highly tex-tured regions and rigid body motions, where trackers can readily follow moving objects and describe their
﹡﹡﹡Received: 2007-06-25
Supported by the National Key Basic Research and Development (973) Program of China (No. 2006CB303106), the Specialized Research Fund for the Doctoral Program of Higher Education of MOE, P.R.C. (No. 20060003057), and the Basic Research Foun-dation of Tsinghua National Laboratory for Information Science and Technology (TNList)
To whom correspondence should be addressed.
E-mail: zhangsh@https://www.360docs.net/doc/357454285.html,; Tel: 86-10-62797001-807
ZHANG Songhai (张松海) et al:Video Structure Analysis715
motion with a simple model. (2) Another approach is based on color and appearance. Such approaches are more suited to videos with relatively little texture and simple scenes. They can, to a certain extent, cope with various changes in objects, including deformation, splitting, and color changes. Such approaches can be further subdivided into space-time segmentation, such as performed by the anisotropic kernel mean shift algo-rithm[4], and segmentation in each frame separately fol-lowed by matching regions between frames, as in the stroke surfaces approach[5]. Space-time segmentation has the advantage that it identifies the entire object by observations throughout the video, which can, for ex-ample, help solve issues of occlusion, but such ap-proaches generally have long-run times and can be sensitive to the speed of the object’s motion and to variations in the object shape, color, and lighting, since this is a global approach. The stroke surfaces method is faster and can generally cope quite well with objects whose appearance changes, but its object matching ability needs to improve. The method described here follows a similar scheme of image segmentation in each frame, with region matching between frames. The greedy algorithm quickly matches regions between frames quickly, and combines motion tracking and simple user interaction to improve the results. (3) The third approach is based on both color and motion in-formation. Such approaches often introduce a statis-tics-based model[6-8] and use an expectation maximum (EM) algorithm to solve the optimization problem. Such approaches lose the efficiency and the conven-ience for user interaction, and are not suitable to fast video structure analysis processing.
2 Method
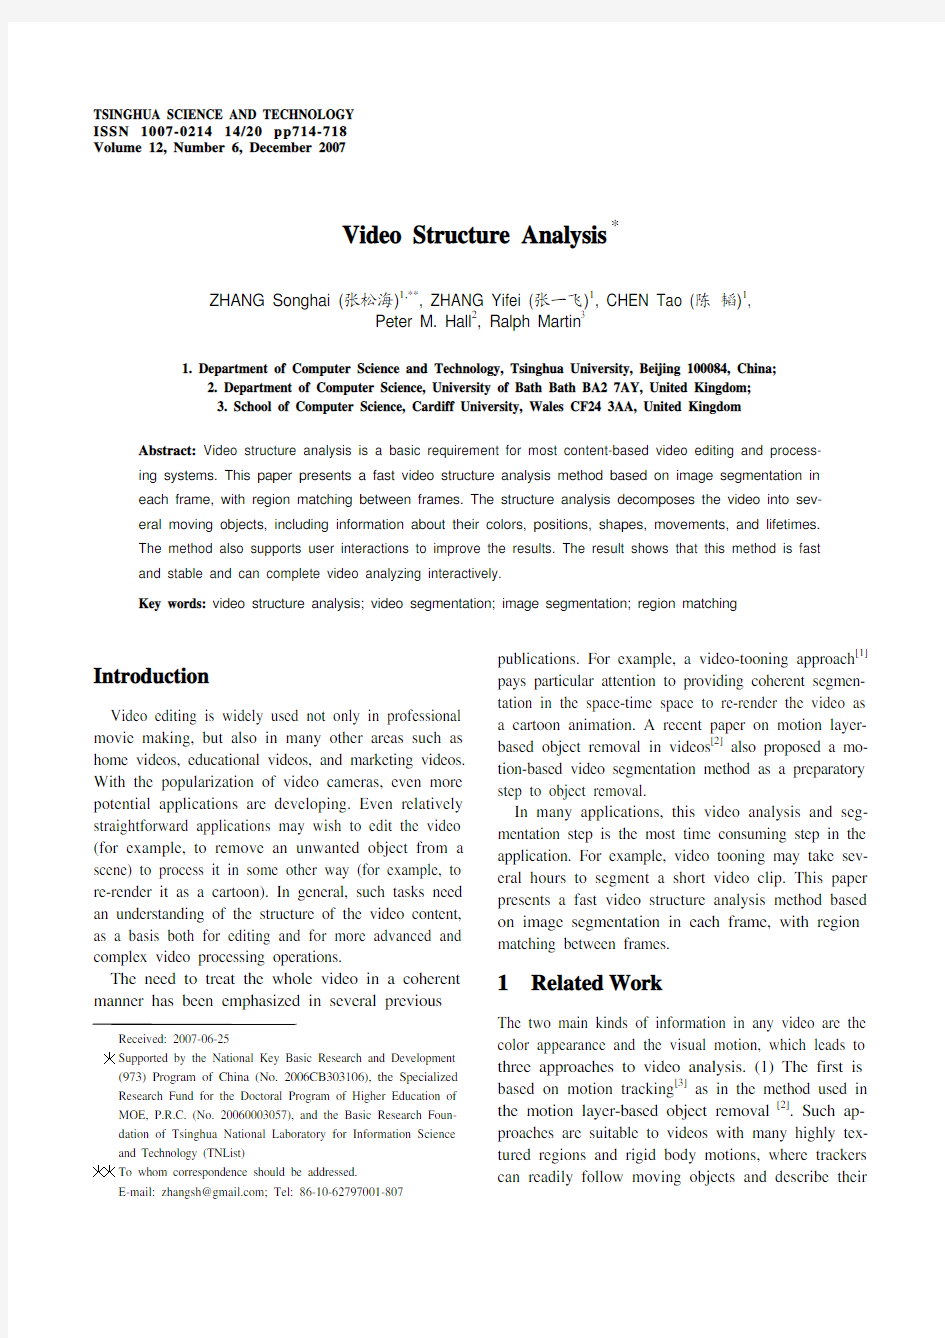
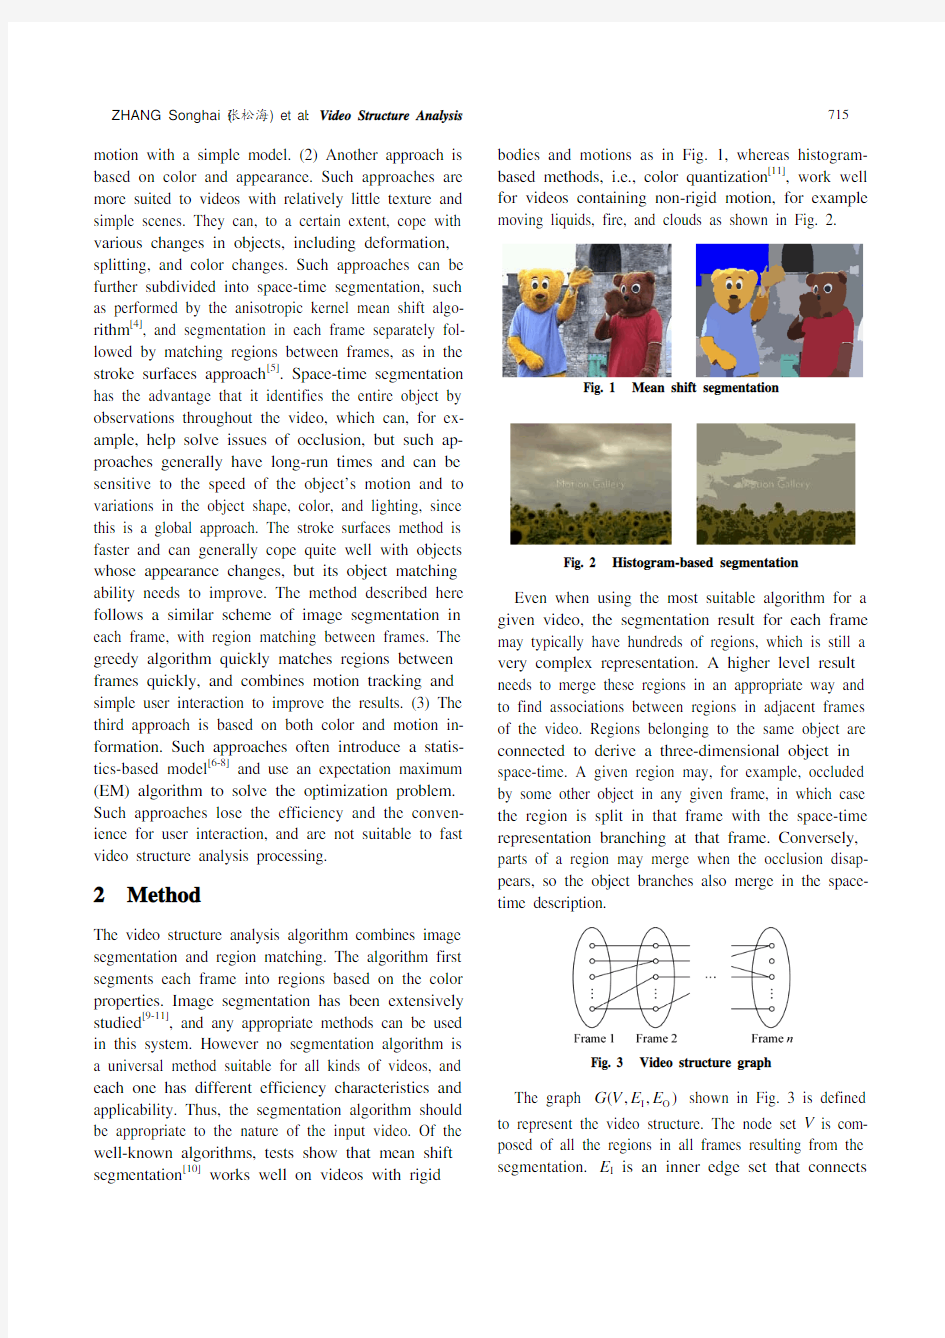
The video structure analysis algorithm combines image segmentation and region matching. The algorithm first segments each frame into regions based on the color properties. Image segmentation has been extensively studied[9-11], and any appropriate methods can be used in this system. However no segmentation algorithm is a universal method suitable for all kinds of videos, and each one has different efficiency characteristics and applicability. Thus, the segmentation algorithm should be appropriate to the nature of the input video. Of the well-known algorithms, tests show that mean shift segmentation[10] works well on videos with rigid bodies and motions as in Fig. 1, whereas histogram-based methods, i.e., color quantization[11], work well for videos containing non-rigid motion, for example
moving liquids, fire, and clouds as shown in Fig. 2.
Fig. 1
Mean shift segmentation
Fig. 2 Histogram-based segmentation
Even when using the most suitable algorithm for a given video, the segmentation result for each frame may typically have hundreds of regions, which is still a very complex representation. A higher level result needs to merge these regions in an appropriate way and to find associations between regions in adjacent frames of the video. Regions belonging to the same object are connected to derive a three-dimensional object in space-time. A given region may, for example, occluded by some other object in any given frame, in which case the region is split in that frame with the space-time representation branching at that frame. Conversely, parts of a region may merge when the occlusion disap-pears, so the object branches also merge in the space-
time description.
Fig. 3 Video structure graph
The graph
I O
(,,)
G V E E shown in Fig. 3 is defined to represent the video structure. The node set V is com-posed of all the regions in all frames resulting from the segmentation. E I is an inner edge set that connects
Tsinghua Science and Technology , December 2007, 12(6): 714-718
716 nodes within a given frame, which means that two re-gions within the frame belong to the same object. Cer-tain inner edges may be placed by the user, since hu-man intelligence may be able to detect meaningful connections which are very difficult for an algorithm to deduce. O E is an outer edge set that connects nodes between neighboring frames, denoting corresponding regions between frames. A region may have no corre-sponding regions in a previous frame, meaning that the region has come into existence in that frame. Similarly, a region may have no corresponding regions in a sub-sequent frame, meaning that the region vanishes in that frame. More generally, as well as the obvious 1-1 cor-respondences between regions in adjacent frames, 1-N correspondences will also occur with multiple outer edges connecting regions in the next frame, as objects splitting or as occluded. N -1 correspondences with multiple outer edges between regions in the previous frame represent object merging or no longer being oc-cluded. To simplify the problem, the algorithm as-sumes that there are no N -N correspondences in the graph.
The problem is represented as a minimization prob-lem by adding a virtual node representing a NULL re-gion in each frame. Any regions in the next frame which come into existence are connected by a virtual edge to this NULL region, and any regions which dis-appear in the previous frame are again connected by a virtual edge to the NULL region. In this way, apart from the NULL regions, every region has at least one edge connecting it to some region in the next frame, and at least one edge connecting it to some region in the previous frame.
A weight is associated with each edge to represent the similarities between regions. Larger weights indi-cate greater similarity between two regions. Virtual edges corresponding to 0-1 and 1-0 relationships have
a threshold weight w T , which is a user set parameter.
I E and O E determine the video structure and each connected sub-graph represents an object. If I E and O E are NULL, each region has become an isolated
object which only appears in one frame. The optimal structure of I E and O E can be formulated as a maximization problem: O
max ,e e E w ∈Σ subject to the
constraint that no N -N correspondences are formed be-tween regions, where e means the edge in O .E (Note that considering the connectivity of nodes in pairs of successive frames is not sufficient to ensure that no N -N correspondences between regions exist, as edges in previous or later frames may eventually join these nodes into a single region).
3 Edge Weighting Function
The edge weight measures the similarity between re-gions. The edge weighting function is set to negative infinity if the regions are too different (to prevent these regions from merging) and is set to the weighted sum of the weights of the three components:
d c 123,
spatialDis or colorDis ;areaRatio spatialDis colorDis.E w w w ???∞>>??=?
?×?×?×??areaRatio is the logarithm of the ratio of the areas of the two regions. colorDis is the distance in the CIE-Lab color space between the average pixel colors. spa-tialDis measures the spatial distance between two re-gions which is approximated by ellipses. The represent of an ellipse E is composed of c as the center, a and b as two lengths of axes, and θ as the angle between the long axis and x axis. And the distance of two ellipses E 1 and E 2 is shown as below, p is a point. spatialDis = D (E 1, E 2)=D 1 (E 1, C 2) + D 1 (E 2, C 1
).
1(,)D E p =
The weights and thresholds are chosen according to
the characteristics of the specific video. Often 10.8w =, 20.6w =, 30.2w =. If objects move rapidly
in the video, d ? should be larger, typically 30. If
lighting changes or the given objects change color, c ? should be larger, typically 10. 4 Correspondence The optimization algorithm can not be solved exactly
since the problem is intractable; therefore, a greedy al-gorithm was used to determine the region connectivity structure. The problem is solved frame-by-frame to
ZHANG Songhai (张松海) et al :Video Structure Analysis 717
determine correspondences between successive frames, starting from the first frame. In each frame, the objec-tive is to find as many correspondences as possible while observing the constraint that there should be no N -N correspondences. In practice, the algorithm em-phasizes forming 1-1 correspondences. Details of the correspondence computation for frame i are shown be-low. The k -th region in frame i is .k i R
Step 1 Construct the new region set for frame i . If 1i =, i.e. the first frame, the new region set is simply set to the segmentation result. For other frames, search for any regions which connect to the same region in the previous frame, and merge these into a new bigger region. Then recompute its area, average color, and modeling ellipse. Also combine any regions for which the user has defined an edge in I E .
Step 2 Find 1-1 correspondences. A 1-1 corre-spondence is regarded as being the most stable and plausible relationship. Such relationships generally have a large weight, representing regions of similar color and size that move slowly without occlusions. Compute each region in frame i and each region in frame 1i +. If for any region in frame i , the edge be-tween k i R and 1l i R + has the maximum weight and at
the same time, for any region in frame 1i +, the edge between k i R and 1l i R + also has the maximum weight, then construct a 1-1 correspondence and add it into O E . Then mark these edges as used and repeat the process for the remaining edges until no more 1-1 cor-respondences of this kind can be found. Note that such 1-1 correspondences may be changed to 1-N or N -1 correspondences in latter steps. For example, a big re-gion could have edges with a region having a similar area and several small regions in the next frame. Step 3 Find 1-N and N -1 correspondences. Sort the remaining edges in descending order of weight. Then consider each edge in turn and add the edge to O E if it satisfies two constraints. First, adding the edge must not create an N -N correspondence. Second, the area difference between the one big region and the sum of the areas of the N small regions should be no more than 10%, since objects remain a similar size from frame to frame, even if they fragment.
Step 4 Attach isolated regions in frame i and frame 1i +. Join any isolated regions with neighbor- ing regions within the frame if they are sufficiently
similar in color and position. Any remaining isolated
regions in frame i are assumed to have disappeared in the next frame, while any remaining isolated regions in frame 1i + are assumed to be newly born objects. After Step 1, the user can add region correspon-dences into O E by hand, or a motion tracking algo-rithm can be used to determine the desired correspon-dences. Such edges are added and marked before pro-ceeding to Step 2.
After finding the correspondences between all suc-cessive pairs of frames, each connected sub graph in the final result corresponds to a single object. The in-formation about this object is then derived from the sub graph, including its shape, color, and behavior over time.
5 Results
The method was tested using the bearwavi.avi video, courtesy of Peter Hall of the University of Bath, using a computer with a 2.4-GHz CPU and 512 MB memory. The EDISON mean shift algorithm [9] was used for the image segmentation. The segmentation speed depends on the parameters used. If the color bandwidth and spatial bandwidth are set to 4, the segmentation takes only a few seconds for each frame and produces more than 1000 regions per frame. The algorithm then takes about 8 s to matching regions in 30 frames. Setting the color bandwidth and spatial bandwidth to 14 gives bet-ter segmentation results for the automatic region matching as shown in Fig. 4, but it then takes more than 60 s to segment each frame, producing about 80 regions per frame. The region matching was then done in less than one second. Several tests showed that the overall success rate for automatic region matching is about 68%.
The matching process was then extended from the stroke surfaces method, which can only handle some ideal cases. The method gives much better run time performance than video tooning. As the algorithm processes each frame, the user can interactively calcu-late the video structure. The algorithm continues image segmentation on the next frame while the user interac-tively improves the region matching on the current frame. The two processes will not conflict on a dual core CPU.
Tsinghua Science and Technology , December 2007, 12(6): 714-718
718
(a) Result image (b) Segmentation result (c) Automatic region matching result
Fig. 4 Results of segmentation and region matching. Top row: results for frame 1; Bottom row: results for frame 5.
6 Conclusions and Future Work
This paper describes a fast video structure analysis method based on image segmentation and region matching. The structure analysis decomposes the video into several moving objects, giving information about the color, position, shape, movement, and life time of each object. This method also supports user interaction to improve the results; the interaction needed is straightforward and obvious. Any image segmentation algorithm can be used in the first step to suit the source video characteristics. A fast greedy algorithm is used to approximately optimize the structure graph of the im-age segmentation results.
One minor problem is that the algorithm may cause objects to become too large in the last few frames. Al-ternative optimization methods which simultaneously consider correspondences in all frames may improve the results, but these would be slower and the improvement might not be worth the extra time spent. References
[1] Wang J, Xu Y, Shum H Y, et al. Video tooning. ACM
Transactions on Graphics , 2004, 23(3): 574-583. [2] Zhang Y, Xiao J, Shah M. Motion layer based object re-moval in videos. In: Proceedings of the Seventh IEEE Workshops on Application of Computer Vision (WACV/MOTION’05). Washington DC, USA: IEEE Computer Society, 2005: 1: 516-521.
[3] Shi J, Tomasi C. Good features to track. In: Proceedings of
IEEE Conference on Computer Vision and Pattern Recog-nition (CVPR’94). Seattle, USA, 1994: 593-600. [4] Wang J, Thiesson B, Xu Y, et al. Image and video seg-mentation by anisotropic kernel mean shift. In: Proceed-ings of European Conference on Computer Vision. Prague, Czech, 2004: 238-249.
[5] Collomosse J P, Rowntree D, Hall P M. Stroke surfaces:
Temporally coherent artistic animations from video. IEEE Transactions on Visualization and Computer Graphics , 2005, 11(5): 540-549.
[6] Chang M M, Tekalp A M, Sezan M I. Simultaneous mo-tion estimation and segmentation. IEEE Trans. on Image Processing , 1997, 6(9): 1326-1333.
[7] Zitnick C L, Jojic N, Kang S B. Consistent segmentation
for optical flow estimation. In: Proceedings of the Tenth IEEE International Conference on Computer Vision. Washington DC, USA: IEEE Computer Society, 2005: 2: 1308-1315.
[8] Khan S, Shah M. Object based segmentation of video us-ing color motion and spatial information. In: Proceedings of IEEE Conference on Computer Vision and Pattern Rec-ognition. Hawaii, USA, 2001: 2: 746-751.
[9] Felzenszwalb P F, Huttenlocher D P. Efficient graph-based
image segmentation. International Journal of Computer Vision , 2004, 59(2): 167-181.
[10] Comanicu D, Meer P. Mean shift: A robust approach to-ward feature space analysis. IEEE Transactions on Pattern Analysis and Machine Intelligence , 2002, 24(5): 603-619. [11] James Arvo. Graphics Gems II. San Diego, USA: Aca-demic Press, 1991.
域名解析教程
域名解析详细教程 域名解析是把域名指向网站空间IP,让人们通过注册的域名可以方便地访问到网站一种服务。域名解析也叫域名指向、服务器设置、域名配置以及反向IP登记等等。说得简单点就是将好记的域名解析成IP,服务由DNS服务器完成,是把域名解析到一个IP地址,然后在此IP地址的主机上将一个子目录与域名绑定。 英文名:DNSR(domain name system resolution) 在域名注册商那里注册了域名之后如何才能看到自己的网站内容,用一个专业术语就叫“域名解析”。在相关术语解释中已经介绍,域名和网址并不是一回事,域名注册好之后,只说明你对这个域名拥有了使用权,如果不进行域名解析,那么这个域名就不能发挥它的作用,经过解析的域名可以用来作为电子邮箱的后缀,也可以用来作为网址访问自己的网站,因此域名投入使用的必备环节是“域名解析”。 域名解析(17张) 我们知道域名是为了方便记忆而专门建立的一套地址转换系统,要访问一台互联网上的服务器,最终还必须通过IP地址来实现,域名解析就是将域名重新转换为IP 地址的过程。一个域名对应一个IP地址,一个IP地址可以对应多个域名;所以多个域名可以同时被解析到一个IP地址。域名解析需要由专门的域名解析服务器(DNS)来完成。解析过程,比如,一个域名为:***.com,是想看到这个现HTTP服务,如果要访问网站,就要进行解析,首先在域名注册商那里通过专门的DNS服务器解析到一个WEB服务器的一个固定IP上:211.214.1.***,然后,通过WEB服务器来接收这个域名,把***.com这个域名映射到这台服务器上。那么,输入***.com这个域名就可以实现访问网站内容了.即实现了域名解析的全过程;人们习惯记忆域名,但机器间互相只认IP地址,域名与IP地址之间是对应的,它们之间的转换工作称为域名解析,域名解析需要由专门的域名解析服务器来完成,整个过程是自动进行的。域名解析协议(DNS)用来把便于人们记忆的主机域名和电子邮件地址映射为计算机易于识别的IP地址。DNS是一种c/s的结构,客户机就是用户用于查找一个名字对应的地址,而服务器通常用于为别人提供查询服务。
excel图表之配色之道
商业杂志图表的经典用色 1、《经济学人》常用的藏青色 经济学人上的图表,基本只用这一个颜色,或加上一些深浅明暗变化,再就是左上角的小红块,成为经济学人图表的招牌样式。罗兰贝格也非常爱用这个色,有时也配合橙色使用。各类提供专业服务的网站也多爱用此色。 更新20081031:前几天看到一个色卡图片,把这个颜色叫藏青色应该是错误,应该是深青色、水鸭色或者孔雀蓝之类的。本人对之前的以讹传讹表示抱歉,纯属色盲。风格就是这样,即使很单调,只要你坚持,也会成为自己的风格,别人也会认同。所谓以不变应万变,变得太多反而难以把握。 2、《商业周刊》常用的蓝红组合 早年的商业周刊上的图表,几乎都使用这个颜色组合,基本成为商业周刊图表的招牌标志了,应该是来源于其VI 系统。不过今年来好像很有些变化,更加轻快明亮。 3、《华尔街日报》常用的黑白灰
HSJ是一份报纸,所以图表多是黑白的,但就是这种黑白灰的组合,做出的图表仍然可以非常专业,配色也非常容易。 4、使用同一颜色的不同深浅 如果既想使用彩色,又不知道配色理论,可在一个图表内使用同一颜色的不同深浅/明暗。这种方法可以让我们使用丰富的颜色,配色难度也不高,是一种很保险的方法,不会出大问题。当然,最深/最亮的要用于最需要突出的序列。 5、《FOCUS》常用的一组色
这组颜色似乎是从组织的LOGO而来,比较亮丽明快,也不错。 6、设计师珍藏自用颜色:橙+灰 我发现,设计师们总喜好把这个颜色组合用于自己的宣传,似乎这样能体现设计师的专业性。如Inmagine、Nordrio 的LOGO就是这样。 7、暗红+灰组合 这种红+灰的组合给人很专业的印象,也经常出现在财经杂志上。 8、橙+绿组合
易名域名解析教程
设置域名解析?(www和泛解析) 登陆ID后,可以通过“管理中心——用户菜单——域名管理——域名管理——(请输入条件查询信息)——列出所有域名——(找到对应域名)——[管理]——解析管理”进入“域名控制面板”操作设置。 1)登录ID,进入管理中心“用户菜单——域名管理”。 2)在输入条件查询信息中输入关键字,通过“域名类型”“注册模版”“域名分类”“域名状态”等多种方式或选择其中一种后,点击“查询”来查找域名。(注:可以直接点击“查询”列出所有域名)
3)查找到需要解析的域名后,点击域名后的[管理]按钮,即可进行相应操作。 4)在域名管理页面中选择“解析管理”进入域名解析操作界面。
5)按照图示进行设定之后,点击新增一条,即可完成域名解析。 例如域名:https://www.360docs.net/doc/357454285.html,,主机名设置*(泛解析),类型A,IP地址即为您主机的IP,设置后即可以任何前缀+域名进行访问,如 https://www.360docs.net/doc/357454285.html,或https://www.360docs.net/doc/357454285.html,等等;主机名为空(没有填写任何字符),类型A,IP地址即为您主机的IP,设置后是以域名直接访问;如 https://www.360docs.net/doc/357454285.html, 主机名为www,类型A,IP地址即为您主机的IP,设置后是以www+域名进行访问,如https://www.360docs.net/doc/357454285.html,。
如何设置别名记录(CNAME)? 登录ID后,可以通过“管理中心——用户菜单——域名管理——域名管理——(请输入条件查询信息)——列出所有域名——(找到对应域名)——[管理]——解析管理”进入“域名控制面板”操作设置别名记录。 1)登录ID,进入管理中心“用户菜单——域名管理”。
2)在输入条件查询信息中输入关键字,通过“域名类型”“注册模版”“域名分类”“域名状态”等多种方式或选择其中一种后,点击“查询”来查找域名。(注:可以直接点击“查询”列出所有域名) 3)查找到需要设置别名记录的域名后,点击域名后的[管理]按钮,即可进入域名管理页面。
史上最全的图表色彩运用原理
史上最全的图表色彩运用原理 1.1 RGB颜色模型 我们先从颜色模型开始讲解学术图表的色彩运用原理。在图像处理中,最常用的颜色空间是RGB模型,常用于颜色显示和图像处理。RGB 颜色模型使用了颜色成分红(Red)、绿(Green)和蓝(Blue)来定义所给颜色中红色、绿色和蓝色的光的量。在24位图像中,每一颜色成分都由0到255之间的数值表示。在位速率更高的图像中,如48位图像,值的范围更大。这些颜色成分的组合就定义了一种单一的颜色。RGB颜色模型采用三维坐标的模型形式,非常容易被理解,如图1-1(a)所示:原点到白色顶点的中轴线是灰度线,R、G、B三分量相等,强度可以由三分量的向量表示。我们可以用RGB来理解色彩、深浅、明暗变化:(1) 色彩变化:三个坐标轴RGB最大分量顶点与黄紫青YMC色顶点的连线;(2) 深浅变化:RGB顶点和CMY顶点到原点和白色顶点的中轴线的距离;(3) 明暗变化:中轴线的点的位置,到原点,就偏暗,到白色顶点就偏亮。RGB模型也称为加色法混色模型。它是以RGB三色光互相叠加来实现混色的方法,因而适合于显示器等发光体的显示。其混色规律是:以等量的红、绿、蓝基色光混合时。我们平时在绘图软件中调整颜色主要就是通过修改RGB颜色的三个数值,如图1-2(b)
Windows 系统自带的选色器的右下角所示。 图1-1 颜色模型对比 1.2 HSB颜色模型 大家平时在颜色选择中还会遇到一种颜色模型:HSB,在这里也给大家做简要的介绍。HSB 色彩模式是基于人眼的一 种颜色模式,是普及型设计软件中常见的色彩模式。,其中(1) 色相H ( Hue ):在0~360°的标准色环上,按照角度值标识。比如红是0°、橙色是30°等,如(2) 饱和度S ( saturation ):是指颜色的强度或纯度。饱和度表示色相中彩色成分所占的比例,用从0%(灰色)~100%(完全饱和)的百分比来度量。在色立面上饱和度是从左向右逐渐增加的,左边线为0%,右 边线为100%,如:。(3) 亮度B ( brightness ):是颜色的明暗程度,通常是从0(黑)~100%(白)的百分比来度量的,在色立面中从上至下逐渐递减,上边线为100%,下边线为0% ,如:。HSB有时也作HSV(色相(Hue)、饱和度(Saturation)、色调(Value ))、HSL(色相(Hue)、饱和度(Saturation)、L(lightness))。比起RGB 系统,HSB 使用了更贴近人类感官直觉的方式来描述色彩,可以指导设计者更好地搭配色彩,会在色彩搭配中经常用到,如图1-2 所示。(a)Microsoft Office默认的选色器(b) Windows 系统自带的选色器图1-2 HSB的应用场景 平时我们颜色参考的色轮(色相轮)就是来源于HSB、HSL
EXCEL图表颜色搭配技巧
设计师谈配色之基础篇 设计师谈配色 按颜色分类 火鸟网:https://www.360docs.net/doc/357454285.html, 一、橙色 使用了高亮度橙色的站点通常都会给人一种晴朗新鲜的感觉,而通过将黄色、黄绿色等类似颜色与成色搭配使用,通常都能得到非常好的效果。同时,中等色调的橙色类似于泥土的颜色,所以也经常用来创造自然的氛围。 橙色是可以通过变换色调营造出不同氛围的典型颜色,它既能表现出青春的活力也能够实现沉稳老练的效果,所以橙色在网页配色中的使用范围是非常广泛的。 Color Point: 橙色通常会给人一种朝气活泼的感觉,它通常可以是原本抑郁的心情豁然开朗。 在东方文化中,橙色象征着爱情和幸福。充满活力的橙色会给人健康的感觉,且有人说橙色可以提高厌食症患者的食欲。有些国家的僧侣主要穿着橙色的僧侣服,他们解释说橙色代表着谦逊。
二、黄绿色
黄绿色时而能够表现出自然的感觉,时而能够表现出未来虚幻的感觉。 原本这两种印象之间有很大的差异,但黄绿色就像穿越时间隧道那样能够自由自在地表现出这两种截然不同的感觉。 在网页中,黄绿色通常与蓝色搭配使用。总的来说,黄绿色主要用于表现温暖亲切的感觉或高科技神秘虚幻的感觉。 Color Point: 黄绿色和草绿色都会让人联想起大自然。黄绿色同时含有黄色和绿色两种颜色的共同特点,也就是说,黄绿色既能表现出黄色的温暖,也能表现出绿色的清新。在社会上,儿童和年轻人比较喜欢黄绿色。
三、绿色
绿色也是在网页中使用最为广泛的颜色之一。 因为它本身具有一定的与健康相关的感觉,所以也经常用于与健康相关的站点。绿色还经常用于一些公司的公关站点或教育站点。 ?当搭配使用绿色和白色时,可以得到自然的感觉。 ?当搭配使用绿色与红色时,可以得到鲜明且丰富的感觉。 ?同时,一些色彩专家和医疗专家们提出绿色可以适当缓解眼部疲劳。 Color Point: 人们看到绿色的时候,第一反应就会想到大自然。很多人都说绿色是大自然的颜色,绿色也代表着大自然中的每一个可贵的生命。大自然给了我们新鲜的氧气,而绿色也能使我们的心情变得格外明朗。当需要揭开心中的抑郁时,当需要找回安详与宁静的感觉时,回归大自然是最好的方法。
网站域名绑定和域名解析详细讲解
域名绑定和域名解析详解 如何获得IP地址? 微企点后台系统为您随机分配主机空间IP地址: 上图右侧红色框框里面那串数字就是IP地址,这个IP地址是随机分配的,请以你看到的IP地址为准。 1、什么是域名绑定? 域名绑定之后并且做完域名解析,浏览者就可以直接通过设置好的域名直接访问了, 例如:在微企点后台中点击“添加域名”,填写.wqdian.,设置之后就可以直接通过该域名访问到您的。 域名绑定在微企点后台完成 2、什么是域名解析? 域名解析是把域名指向IP,让人们通过注册的域名可以方便地访问到一种服务。IP地址是网络上标识站点的数字地址, 为了方便记忆,采用域名来代替IP地址标识站点地址。域名解析就是域名到IP地址的转换过程。域名的解析工作由DNS服务器完成。 域名解析在域名注册商后台或解析服务后台完成 提示:对于先绑定域名还是先域名解析,并没有定论,但建议先进行域名绑定操作。 3、如何设置解析域名? 这里以万网、易名、新网、西部数码、时代互联为例。 特别提醒:www和不带www的网址需要分别解析 一、记录类型「A记录」(要将域名指向主机服务商提供的IP地址,请选择「A记录」)
1、万网 1)首先登录,进入会员中心,点击左侧“我的域名”,选择对应域名后方的“解析”,进入域名解析界面 2)域名解析界面,点击“进入高级设置” 3)进入域名解析高级设置界面 第1步:点击“添加解析” 第2步:选择记录类型“A”记录,设置主机记录为所需容. 第3步:填写记录值 (该IP是微企点为您提供的主机空间IP地址,方法请见上方文章顶端)
完成以上3项后,点击“保存”。一般10分钟到两个小时便可以解析完成。最长不超过6个小时。 备注:TTL指各地DNS缓存您域名记录信息的时间,默认为10分钟(600)。 2、易名 1)、首先登录,点击左上角的“用户名”进入管理中心。 2)、点击管理中心左侧的“域名管理”,点击对应域名后的“解析”
excel图表的经典配色
商业杂志图表的经典用色 商业图表中的颜色运用,其重要性不言而喻,我们非设计专业人士,对色彩往往不是很有把握,色彩方面的教材看起来也不得要领,做出的图表用色上常常花哨或者脏乱,难以达到专业的效果。 在《杂志级图表方法第一步:突破Excel的默认颜色》中已经提到,从商业杂志上的图表借鉴配色,则不失为一种非常保险和方便的办法。不少朋友向我索要颜色模板,但实际上我这些年并没有从事经营分析工作,手头并没有完善的模板。最近,我从上千个杂志图表案例中,整理了一些商业杂志常用的经典用色组合,以飨博友。(ExcelPro的图表博客:https://www.360docs.net/doc/357454285.html,) 1、《经济学人》常用的藏青色 经济学人上的图表,基本只用这一个颜色,或加上一些深浅明暗变化,再就是左上角的小红块,成为经济学人图表的招牌样式。罗兰贝格也非常爱用这个色,有时也配合橙色使用。各类提供专业服务的网站也多爱用此色。 更新20081031:前几天看到一个色卡图片,把这个颜色叫藏青色应该是错误,应该是深青色、水鸭色或者孔雀蓝之类的。本人对之前的以讹传讹表示抱歉,纯属色盲。 风格就是这样,即使很单调,只要你坚持,也会成为自己的风格,别人也会认同。所谓以不变应万变,变得太多反而难以把握。
2、《商业周刊》常用的蓝红组合 早年的商业周刊上的图表,几乎都使用这个颜色组合,基本成为商业周刊图表的招牌标志了,应该是来源于其VI系统。不过今年来好像很有些变化,更加轻快明亮。 3、《华尔街日报》常用的黑白灰 HSJ是一份报纸,所以图表多是黑白的,但就是这种黑白灰的组合,做出的图表仍然可以非常专业,配色也非常容易。
作图基本配色方案及色标大全
作图基本配色方案及色标大全 基本配色——奔放 ----------------------------------------------------------------------------------- 藉由使用象朱红色这种一般最令人熟知的色彩,或是它众多的明色和暗色中的一个,都能在一般设计和平面设计上展现活力与热忱。中央为红橙色的色彩组合最能轻易创造出有活力、充满温暖的感觉。 这种色彩组合让人有青春、朝气、活泼、顽皮的感觉,常常出现在广告中,展示精力充沛的个性与生活方式。把红橙和它的补色——蓝绿色——搭配组合起来,就具有亲近、随和、活泼、主动的效果,每当应用在织品、广告和包装上,都是非常有效。 基本配色——传统 ----------------------------------------------------------------------------------- 传统的色彩组合常常是从那些具有历史意义的色彩那里仿来的。 蓝、暗红、褐和绿等保守的颜色加上了灰色或是加深了色彩,都可表达传统的主题。 例如,绿,不管是纯色或是加上灰色的暗色,都象征财富。 狩猎绿(hunter green)配上浓金或是暗红或是黑色表示稳定与富有。这种色彩常出现在银行和律师事务所的装潢上,因为它们代表恒久与价值。 基本配色——低沉 ----------------------------------------------------------------------------------- 不同于其它色彩展现柔和,低沉之美的灰紫色没有对比色。灰紫色调合了红紫色、灰色和白色,是个少见的彩色。 任何颜色加上少许的灰色或白色,能表达出的柔和之美,有许多种包括灰蓝色、灰绿色等。但若灰紫色本身被赋其它彩度或亮度,则可能掩盖了原颜色的原有意境。使用补色,或比原色更生动的颜色,可使这些展现柔和之美的颜色顿时生意昂然,但要保持自然的柔美,亮度的变化应尽少使用。 基本配色——动感
EXCEL图表颜色搭配技巧
EXCEL图表配色技巧 一、橙色 使用了高亮度橙色的站点通常都会给人一种晴朗新鲜的感觉,而通过将黄色、黄绿色等类似颜色与成色搭配使用,通常都能得到非常好的效果。同时,中等色调的橙色类似于泥土的颜色,所以也经常用来创造自然的氛围。 橙色是可以通过变换色调营造出不同氛围的典型颜色,它既能表现出青春的活力也能够实现沉稳老练的效果,所以橙色在网页配色中的使用范围是非常广泛的。 Color Point: 橙色通常会给人一种朝气活泼的感觉,它通常可以是原本抑郁的心情豁然开朗。 在东方文化中,橙色象征着爱情和幸福。充满活力的橙色会给人健康的感觉,且有人说橙色可以提高厌食症患者的食欲。有些国家的僧侣主要穿着橙色的僧侣服,他们解释说橙色代表着谦逊。 二、黄绿色 黄绿色时而能够表现出自然的感觉,时而能够表现出未来虚幻的感觉。 原本这两种印象之间有很大的差异,但黄绿色就像穿越时间隧道那样能够自由自在地表现出这两种截然不同的感觉。 在网页中,黄绿色通常与蓝色搭配使用。总的来说,黄绿色主要用于表现温暖亲切的感觉或高科技神秘虚幻的感觉。 Color Point: 黄绿色和草绿色都会让人联想起大自然。黄绿色同时含有黄色和绿色两种颜色的共同特点,也就是说,黄绿色既能表现出黄色的温暖,也能表现出绿色的清新。在社会上,儿童和年轻人比较喜欢黄绿色。 三、绿色 绿色也是在网页中使用最为广泛的颜色之一。 因为它本身具有一定的与健康相关的感觉,所以也经常用于与健康相关的站点。绿色还经常用于一些公司的公关站点或教育站点。
?当搭配使用绿色和白色时,可以得到自然的感觉。 ?当搭配使用绿色与红色时,可以得到鲜明且丰富的感觉。 ?同时,一些色彩专家和医疗专家们提出绿色可以适当缓解眼部疲劳。 Color Point: 人们看到绿色的时候,第一反应就会想到大自然。很多人都说绿色是大自然的颜色,绿色也代表着大自然中的每一个可贵的生命。大自然给了我们新鲜的氧气,而绿色也能使我们的心情变得格外明朗。当需要揭开心中的抑郁时,当需要找回安详与宁静的感觉时,回归大自然是最好的方法。 四、黄色 黄色是在站点配色中使用最为广泛的颜色之一,因为黄色本身具有一种明朗愉快的效果,所以能够得到大部分人的认可。 黄色在从儿童站点直至门户型网站等几乎每一个角落中都找到了自己的发挥空间,通过结合紫色、蓝色等颜色可以得到温暖愉快的积极效果。 ?高彩度的黄色与黑色的结合可以得到清晰整洁的效果,这种配色实例在网页设计中经常可以见到。 ?采用同一色调的深褐色与黄色的搭配,可以表达一种成熟的城市时尚的感觉。 Color Point: 黄色是明亮的且可以给人甜蜜幸福感觉的颜色。 在很多艺术家的作品,黄色都用来表现喜庆的气氛和富饶的景色。同时黄色还可以起到强调突出的作用,这也是使用黄色作为路口指示灯的原因。黄色因为具有诸多以上的特点,所以在我们的日常生活中随处可见。 黄色是在站点配色中使用最为广泛的颜色之一,因为黄色本身具有一种明朗愉快的效果,所以能够得到大部分人的认可。 黄色在从儿童站点直至门户型网站等几乎每一个角落中都找到了自己的发挥空间,通过结合紫色、蓝色等颜色可以得到温暖愉快的积极效果。 ?高彩度的黄色与黑色的结合可以得到清晰整洁的效果,这种配色实例在网页设计中经常可以见到。 ?采用同一色调的深褐色与黄色的搭配,可以表达一种成熟的城市时尚的感觉。 Color Point: 黄色是明亮的且可以给人甜蜜幸福感觉的颜色。 在很多艺术家的作品,黄色都用来表现喜庆的气氛和富饶的景色。同时黄色还可以起到强调突出的作用,这也是使用黄色作为路口指示灯的原因。黄色因为具有诸多以上的特点,所以在我们的日常生活中随处可见。
域名解析服务器
域名解析服务器,在某些应用程序中如果手工设定合适的DNS服务器IP地址,则可避免程序自动检测,从而提高连接效率。那么如何查看所在地区DNS域名服务器的IP地址呢?答:在Windows XP环境下的查看方法如下 第一步,在开始菜单的“运行”对话框中输入“command”或“cmd”(引号不输入),打开命令行窗口。 第二步,输入“Ipconfig /all”单击回车键后,屏幕上将显示出IP地址的相关信息。最后的两行,即“DNS Servers”后的内容就是本地DNS服务器的IP地址。 DNS 定义 DNS 是域名系统(Domain Name System) 的缩写,该系统用于命名组织到域层次结构中的计算机和网络服务。DNS 命名用于Internet 等TCP/IP 网络中,通过用户友好的名称查找计算机和服务。当用户在应用程序中输入DNS 名称时,DNS 服务可以将此名称解析为与之相关的其他信息,如IP 地址。因为,你在上网时输入的网址,是通过域名解析系解析找到相对应的IP地址,这样才能上网。其实,域名的最终指向是IP。 在IPV4中IP是由32位二进制数组成的,将这32位二进制数分成4组每组8个二进制数,将这8个二进制数转化成十进制数,就是我们看到的IP地址,其范围是在1~255之间。因为,8个二进制数转化为十进制数的最大范围就是1~255。现在已开始试运行、将来必将代替IPV6中,将以128位二进制数表示一个IP地址。 大家都知道,当我们在上网的时候,通常输入的是如:https://www.360docs.net/doc/357454285.html,这样子的网址,其实这就是一个域名,而我们计算机网络上的计算机彼此之间只能用IP地址才能相互识别。再如,我们去一WEB服务器中请求一WEB页面,我们可以在浏览器中输入网址或者是相应的IP地址,例如我们要上新浪网,我们可以在IE的地址栏中输入: https://www.360docs.net/doc/357454285.html,也可输入这样子218.30.66.101 的IP地址,但是这样子的IP地址我们记不住或说是很难记住,所以有了域名的说法,这样的域名会让我们容易的记住。 DNS:Domain Name System 域名管理系统域名是由圆点分开一串单词或缩写组成的,每一个域名都对应一个惟一的IP地址,这一命名的方法或这样管理域名的系统叫做域名管理系统。 DNS:Domain Name Server 域名服务器域名虽然便于人们记忆,但网络中的计算机之间只能互相认识IP地址,它们之间的转换工作称为域名解析(如上面的 https://www.360docs.net/doc/357454285.html,与218.30.66.101 之间的转换),域名解析需要由专门的域名解析服务器来完成,DNS就是进行域名解析的服务器。 1、什么是DNS? DNS是指:域名服务器(Domain Name Server)。在Internet上域名与IP地址之间是一一对应的,域名虽然便于人们记忆,但机器之间只能互相认识IP地址,它们之间的转换工作称为域名解析,域名解析需要由专门的域名解析服务器来完成,DNS就是进行域名解析的服务器。 2、为什么要注册DNS,有什么意义? 申请了DNS后,客户可以自己为域名作解析,或增设子域名.客户申请DNS时,建议客户一次性申请两个。 3、在域名注册机构注册DNS的步骤及其注册的有关规定是什么? 目前国际域名的DNS必须在国际域名注册商处注册,国内域名的DNS必须在CNNIC 注册。
域名的解析过程
域名的解析过程中采用两种查询方式,其中需要注意的事项: 一、主机向本地域名服务器的查询一般都是采用递归查询。 所谓递归查询就是:如果主机所询问的本地域名服务器不知道被查询的域名的IP地址,那么本地域名服务器就以DNS客户的身份,向其它根域名服务器继续发出查询请求报文(即替主机继续查询),而不是让主机自己进行下一步查询。 因此,递归查询返回的查询结果或者是所要查询的IP地址,或者是报错,表示无法查询到所需的IP地址。 二、本地域名服务器向根域名服务器的查询的迭代查询。 迭代查询的特点:当根域名服务器收到本地域名服务器发出的迭代查询请求报文时,要么给出所要查询的IP地址,要么告诉本地服务器:“你下一步应当向哪一个域名服务器进行查询”。 然后让本地服务器进行后续的查询。根域名服务器通常是把自己知道的顶级域名服务器的IP地址告诉本地域名服务器,让本地域名服务器再向顶级域名服务器查询。
顶级域名服务器在收到本地域名服务器的查询请求后,要么给出所要查询的IP地址,要么告诉本地服务器下一步应当向哪一个权限域名服务器进行查询。 最后,知道了所要解析的IP地址或报错,然后把这个结果返回给发起查询的主机。 三、递归查询和迭代查询的差别 1.下面举一个例子演示整个查询过程: 假定域名为https://www.360docs.net/doc/357454285.html,的主机想知道另一个主机https://www.360docs.net/doc/357454285.html,的IP地址。例如,主机https://www.360docs.net/doc/357454285.html,打算发送邮件给https://www.360docs.net/doc/357454285.html,。这时就必须知道主机https://www.360docs.net/doc/357454285.html,的IP地址。下面是上图a的几个查询步骤:
①主机https://www.360docs.net/doc/357454285.html,先向本地服务器https://www.360docs.net/doc/357454285.html,进行递归查询。 ②本地服务器采用迭代查询。它先向一个根域名服务器查询。 ③根域名服务器告诉本地服务器,下一次应查询的顶级域名服务器https://www.360docs.net/doc/357454285.html,的IP地址。 ④本地域名服务器向顶级域名服务器https://www.360docs.net/doc/357454285.html,进行查询。 ⑤顶级域名服务器https://www.360docs.net/doc/357454285.html,告诉本地域名服务器,下一步应查询的权限服务器https://www.360docs.net/doc/357454285.html,的IP地址。 ⑥本地域名服务器向权限域名服务器https://www.360docs.net/doc/357454285.html,进行查询。 ⑦权限域名服务器https://www.360docs.net/doc/357454285.html,告诉本地域名服务器,所查询的主机的IP地址。 ⑧本地域名服务器最后把查询结果告诉https://www.360docs.net/doc/357454285.html,。 2.关于DNS解析的TTL参数: 我们在配置DNS解析的时候,有一个参数常常容易忽略,就是DNS解析的TTL参数,Time To Live。TTL这个参数告诉本地DNS服务器,域名缓存的最长时间。用阿里云解析来举例,阿里云解析默认的TTL是10分钟,10分钟的含义是,本地DNS服务器对于域名的缓存时间是10分钟,10分钟之后,本地DNS服务器就会删除这条记录,删除之后,如果有用户访问这个域名,就要重复一遍上述复杂的流程。
图表的基本配色方法
图表的基本配色方法 不论是商业图表还是专业图表,图表的配色都极其关键。图表配色主要有彩色和黑白两种配色方案。刘万祥老师曾提出:在我看来,普通图表与专业图表的差别,很大程度就体现在颜色运用上。对于商业图表,专业的图表制作人员可以根据色轮,实现单色、类似色、互补色等配色方案;而普通大众,则可以参考《华尔街日报》(The Wall Street Journal)、商业周刊(Business Week)以及《经济学人》(The Economist)等商业经典杂志的图表配色。 对于科学图表,大部分国内的期刊杂志要求黑白的论文图表;而国外大部分的期刊杂志允许彩色的图表。科学论文图表基本是按照《Author Guidelines》的要求来制作的,最大的区别在于色彩,优秀的图表配色能够给人一种赏心悦目的感觉,更能激起读者对文章内容的兴趣。1.3.1 Excel的默认配色Excel 2013以上版本引入了“颜色主题”的概念。通过“页面布局”→“主题”→“颜色”,可以看到很多种颜色主题,如图1-3-1(a)所示。我们可以通过改变“颜色主题”全 局改变Excel中字体、单元格、图表等对象的配色,该功能类似于某些软件中的换肤功能。如图1-3-1(b)所示,选择“自定义颜色”,弹出“新建颜色主题”的对话框,自定义颜色主题,需要时可通过颜色面板快速调用。图1-3-1 Excel 2016的
默认配色方案 Excel 2016绘图默认配色就是图1-3-1(a)中的“自定义1”颜色主题,如图1-3-1(c)中淡蓝色方框所示。其实,在图1-3-1(c)的颜色主题中,有许多衍生的颜色主题,包括彩色和单色两种类型供选择。利用图1-3-1(c)的颜色主题绘制的效果图,如图1-3-4所示。 1.3.2 Excel的颜色修改在Excel中选择颜色选项,我们可以看到Excel 的颜色模板及其修改入口,如图1-3-2(a)所示。颜色模板部分包括“主题颜色”、“标准颜色”和“最近使用颜色”,“主题颜色”就是通过颜色主题类型来控制和改变的。选择底部的“其他颜色”,可以跳出如图1-3-2(b)标准颜色选项卡和图 1-3-2(c)自定义颜色选项。在“标准”选项卡中,我们可以选择很多预设的颜色,但是我们一般很少使用。在“自定义”选项卡中,我们可以通过输入特定的RGB值来精确指定颜色,这里就是我们用来突破默认颜色的地方。(说明:计算机一般通过一组代表红、绿、蓝三原色比重的RGB 颜色代码来确定一个唯一的颜色,R,G,B的取值范围都是属于[0, 255])。任何颜色都可以通过R,G,B调配出来,所以我们只要得到一种颜色的R,G,B数值,就可以把这种颜色还原出来。1.3.3 Excel专业图表的配色突破我们觉得R语言中ggplot2绘图精美的一个重要原因就是它清新亮丽的灰色背景配上赏心
域名解析过程及原理
域名解析过程及原理 域名解析过程: 第一步:客户机提出域名解析请求,并将该请求发送给本地的域名服务器。 第二步:当本地的域名服务器收到请求后,就先查询本地的缓存,如果有该纪录项,则本地的域名服务器就直接把查询的结果返回。 第三步:如果本地的缓存中没有该纪录,则本地域名服务器就直接把请求发给根域名服务器,然后根域名服务器再返回给本地域名服务器一个所查询域(根的子域)的主域名服务器的地址。 第四步:本地服务器再向上一步返回的域名服务器发送请求,然后接受请求的服务器查询自己的缓存,如果没有该纪录,则返回相关的下级的域名服务器的地址。 第五步:重复第四步,直到找到正确的纪录。 第六步:本地域名服务器把返回的结果保存到缓存,以备下一次使用,同时还将结果返回给客户机。 让我们举一个例子来详细说明解析域名的过程.假设我们的客户机如果想要访问站点:https://www.360docs.net/doc/357454285.html, ,此客户本地的域名服务器是https://www.360docs.net/doc/357454285.html, ,一个根域名服务器是https://www.360docs.net/doc/357454285.html, ,所要访问的网站的域名服务器是https://www.360docs.net/doc/357454285.html,,域名解析的过程如下所示: (1)客户机发出请求解析域名https://www.360docs.net/doc/357454285.html,的报文 (2)本地的域名服务器收到请求后,查询本地缓存,假设没有该纪录,则本地域名服务器https://www.360docs.net/doc/357454285.html,则向根域名服务器https://www.360docs.net/doc/357454285.html,发出请求解析域名https://www.360docs.net/doc/357454285.html, (3)根域名服务器https://www.360docs.net/doc/357454285.html,收到请求后查询本地记录得到如下结果:https://www.360docs.net/doc/357454285.html, NS https://www.360docs.net/doc/357454285.html,(表示https://www.360docs.net/doc/357454285.html,域中的域名服务器为:https://www.360docs.net/doc/357454285.html,),同时给出https://www.360docs.net/doc/357454285.html,的地址,并将结果返回给域名服务器https://www.360docs.net/doc/357454285.html,。 (4)域名服务器https://www.360docs.net/doc/357454285.html,收到回应后,再发出请求解析域名https://www.360docs.net/doc/357454285.html, 的报文。 (5)域名服务器 https://www.360docs.net/doc/357454285.html,收到请求后,开始查询本地的记录,找到如下一条记录:https://www.360docs.net/doc/357454285.html, A 211.120.3.12(表示https://www.360docs.net/doc/357454285.html,域中域名服务器https://www.360docs.net/doc/357454285.html, 的IP地址为:211.120.3.12),并将结果返回给客户本地域名服务器https://www.360docs.net/doc/357454285.html,。
域名-如何设置域名解析
怎么设置域名解析?下面来详细介绍设置域名解析的操作步骤。 点击【进入管理控制台】链接,然后点击左侧主菜单的【域名和网站(万网)】,再点击菜单【域名】,进入域名服务界面。 或者关闭这后面新开的3个网页,回到之前的第一个网页【域名控制台】页面,刷新浏览器页面,看到多出来了2个域名。 点击https://www.360docs.net/doc/357454285.html,这个域名右侧的【解析】按钮,弹出新的网页窗口,进入域名解析设置界面。
点击【添加解析】按钮,弹出安全验证界面。
点击【发送验证码】,手机收到验证码,输入验证码,点击【确定】按钮。
主机记录输入www,记录值输入获取到的云服务器公网IP地址,点击右侧【保存】按钮,可能提示解析不成功,可以忽略,因为域名解析生效需要一段时间。 再次点击【添加解析】按钮,主机记录输入@,记录值输入上节课获取到的云服务器公网IP地址,点击右侧【保存】按钮,完成域名解析设置。 一般过几分钟之后,可以通过在命令行窗口运行命令ping https://www.360docs.net/doc/357454285.html, 来查看域名解析是否成功。
如果看到返回的网络IP地址是自己的云服务器IP地址,就表示域名解析成功了。 然后就可以打开浏览器,输入域名进行访问,看看我们的个人简介网站可以通过域名访问了。
域名购买的流程其实并不复杂,选择自己喜欢的,直接购买就可以,或者可以上汇桔网直接按条件筛选自己心仪的域名进行交易。 汇桔网是全球领先的知识产权交易与创新创业资源交互平台,它立志打造国内外最大域名交易平台,精选双拼/三拼/四拼低价各类优质域名资源,致力于提供域名买卖、域名出售、域名抢注、域名购买等域名服务,全面保障买卖双方安全交易。
搭建DNS服务器实现域名解析
搭建DNS服务器实现域名解析 学习服务的方法: 了解服务的作用:名称,功能,特点 安装服务 配置文件的位置,端口 服务开启和关闭的脚本 修改配置文件(实战举例) 排错(从上到下,从内到外) ---------------------------------------- 大纲: DNS服务器常见概念 DNS服务器安装及相关配置 实战:配置DNS服务器解析 实战:使用DNS支持递归查询. 实战:搭建DNS转发服务器
实战:搭建DNS主从服务器 实战:zone文件中的其它记录信息. 通过DNS做负载均衡 实战:DNS主从密钥认证 测试工具:nslookup dig ---------------------------------------- DNS服务器常见概念 DNS服务概述: DNS(Domain Name System--域名系统),在TCP /IP 网络中有着非常重要的地位,能够提供域名和IP 地址的解析服务. DNS是一个分布式数据库,命名系统采用层次的逻辑结构,如同一颗倒置的树,这个逻辑的树形结构称为域名空间,由于DNS划分了域名空间,所以各机构可以使用自己的域名空间创建DNS信息. 注:DNS域名空间中,树的最大深度不得超过127层,树中每个节点最长可以存储63个字符.
一些名词的解释: 1. 域和域名 DNS树的每个节点代表一个域.通过这些节点,对整个域名空间进行划分,成为一个层次结构. 域名空间的每个域的名字,通过域名进行表示. 域名:通常由一个完全合格域名(FQDN)标识.FQD N能准确表示出其相对于DNS 域树根的位置,也就是节点到DNS 树根的完整表述方式,从节点到树根采用反向书写,并将每个节点用“.”分隔,对于DNS 域g
DNS域名解析过程
DNS域名解析过程 DNS解析过程及原理 第一步:客户机提出域名解析请求,并将该请求发送给本地的域名服务器。 第二步:当本地的域名服务器收到请求后,就先查询本地的缓存,如果有该纪录项,则本地的域名服务器就直接把查询的结果返回。 第三步:如果本地的缓存中没有该纪录,则本地域名服务器就直接把请求发给根域名服务器,然后根域名服务器再返回给本地域名服务器一个所查询域(根的子域)的主域名服务器的地址。 第四步:本地服务器再向上一步返回的域名服务器发送请求,然后接受请求的服务器查询自己的缓存,如果没有该纪录,则返回相关的下级的域名服务器的地址。第五步:重复第四步,直到找到正确的纪录。 第六步:本地域名服务器把返回的结果保存到缓存,以备下一次使用,同时还将结果返回给客户机。 让我们举一个例子来详细说明解析域名的过程.假设我们的客户机如果想要访问站点:https://www.360docs.net/doc/357454285.html, , 此客户本地的域名服务器是 https://www.360docs.net/doc/357454285.html, , 一个根域名服务器是https://www.360docs.net/doc/357454285.html, , 所要访问的网站的域名服务器是https://www.360docs.net/doc/357454285.html,,域名解析的过程如下所示: (1)客户机发出请求解析域名https://www.360docs.net/doc/357454285.html,的报文 (2)本地的域名服务器收到请求后, 查询本地缓存, 假设没有该纪录, 则本地域名服务器https://www.360docs.net/doc/357454285.html,则向根域名服务器https://www.360docs.net/doc/357454285.html,发出请求解析域名https://www.360docs.net/doc/357454285.html, (3)根域名服务器https://www.360docs.net/doc/357454285.html,收到请求后查询本地记录得到如下结果:https://www.360docs.net/doc/357454285.html, NS https://www.360docs.net/doc/357454285.html, (表示https://www.360docs.net/doc/357454285.html,域中的域名服务器为:https://www.360docs.net/doc/357454285.html, ), 同时给出https://www.360docs.net/doc/357454285.html,的地址,并将结果返回给域名服务器https://www.360docs.net/doc/357454285.html,。 (4)域名服务器https://www.360docs.net/doc/357454285.html, 收到回应后,再发出请求解析域名https://www.360docs.net/doc/357454285.html,的报文。 (5)域名服务器 https://www.360docs.net/doc/357454285.html,收到请求后,开始查询本地的记录,找到如下一条记录:https://www.360docs.net/doc/357454285.html, A 211.120.3.12 (表示https://www.360docs.net/doc/357454285.html,域中域名服务器https://www.360docs.net/doc/357454285.html,的IP地址为:211.120.3.12),并将结果返回给客户本地域名服务器https://www.360docs.net/doc/357454285.html,。 (6)客户本地域名服务器将返回的结果保存到本地缓存,同时将结果返回给客户机。 这样就完成了一次域名解析过程
EXCEL图表颜色搭配技巧
设计师谈配色之基础篇 设计师谈配色按颜色分类火鸟网:https://www.360docs.net/doc/357454285.html, 一、橙色 使用了高亮度橙色的站点通常都会给人一种晴朗新鲜的感觉,而通过将黄色、黄绿色等类似颜色与成色搭配使用,通常都能得到非常好的效果。同时,中等色调的橙色类似于泥土的颜色,所以也经常用来创造自然的氛围。 橙色是可以通过变换色调营造出不同氛围的典型颜色,它既能表现出青春的活力也能够实现沉稳老练的效果,所以橙色在网页配色中的使用范围是非常广泛的。 Color Point: 橙色通常会给人一种朝气活泼的感觉,它通常可以是原本抑郁的心情豁然开朗。 在东方文化中,橙色象征着爱情和幸福。充满活力的橙色会给人健康的感觉,且有人说橙色可以提高厌食症患者的食欲。有些国家的僧侣主要穿着橙色的僧侣服,他们解释说橙色代表着谦逊。
二、黄绿色
黄绿色时而能够表现出自然的感觉,时而能够表现出未来虚幻的感觉。 原本这两种印象之间有很大的差异,但黄绿色就像穿越时间隧道那样能够自由自在地表现出这两种截然不同的感觉。 在网页中,黄绿色通常与蓝色搭配使用。总的来说,黄绿色主要用于表现温暖亲切的感觉或高科技神秘虚幻的感觉。 Color Point: 黄绿色和草绿色都会让人联想起大自然。黄绿色同时含有黄色和绿色两种颜色的共同特点,也就是说,黄绿色既能表现出黄色的温暖,也能表现出绿色的清新。在社会上,儿童和年轻人比较喜欢黄绿色。
三、绿色
绿色也是在网页中使用最为广泛的颜色之一。 因为它本身具有一定的与健康相关的感觉,所以也经常用于与健康相关的站点。绿色还经常用于一些公司的公关站点或教育站点。 ?当搭配使用绿色和白色时,可以得到自然的感觉。 ?当搭配使用绿色与红色时,可以得到鲜明且丰富的感觉。 ?同时,一些色彩专家和医疗专家们提出绿色可以适当缓解眼部疲劳。 Color Point: 人们看到绿色的时候,第一反应就会想到大自然。很多人都说绿色是大自然的颜色,绿色也代表着大自然中的每一个可贵的生命。大自然给了我们新鲜的氧气,而绿色也能使我们的心情变得格外明朗。当需要揭开心中的抑郁时,当需要找回安详与宁静的感觉时,回归大自然是最好的方法。