Structural-stratigraphic-control-on-the-Umitaka-Spur-gas-hydrates-of-Joetsu-Basin-in-the-eastern
Structural-stratigraphic control on the Umitaka Spur gas hydrates of Joetsu Basin in the eastern margin of Japan Sea
Antonio Fernando Menezes Freire a ,*,Ryo Matsumoto b ,1,Luiz Alberto Santos a ,2
a Petrobras Research Center (CENPES),Av.Horácio Macedo,950,Cidade Universitária,Ilha do Fund?o,Rio de Janeiro-RJ,21941-915,Brazil
b
Department of Earth and Planetary Sciences,Graduate School of Science,The University of Tokyo,7-3-1,Hongo Campus,Bunkyo-ku,Tokyo,113-0033,Japan
a r t i c l e i n f o
Article history:
Received 17February 2010Received in revised form 15October 2010
Accepted 22October 2010
Available online 30October 2010Keywords:Gas chimney Gas hydrates Japan Sea Joetsu Basin Methane seeps
Single channel seismic Tectono-stratigraphy Umitaka spur
a b s t r a c t
Integrated geological,geochemical,and geophysical exploration since 2004has identi ?ed massive accumulation of gas hydrate associated with active methane seeps on the Umitaka Spur,located in the Joetsu Basin on the eastern margin of Japan Sea.Umitaka Spur is an asymmetric anticline formed along an incipient subduction zone that extends throughout the western side of the Japanese island-arc system.Seismic surveys recognized chimney structures that seem strongly controlled by a complex anticlinal axial fault system,and exhibit high seismic amplitudes with apparent pull-up structures,probably due to massive and dense accumulation of gas hydrate.Bottom simulating re ?ectors are widely developed,in particular within gas chimneys and in the gently dipping eastern ?ank of the anticline,where debris can store gas hydrates that may represent a potential natural gas resource.The axial fault system,the shape of the anticline,and the carrier beds induce thermogenic gas migration to the top of the structure,and supply gas to the gas hydrate stability zone.Gas reaching the sea ?oor produces strong seepages and giant plumes in the sea water column.
Crown Copyright ó2010Published by Elsevier Ltd.All rights reserved.
1.Introduction
This work aims to provide an overview about the tectono-sedimentary characteristics of the Umitaka Spur,and to recognize the in ?uence of these settings on the gas hydrate occurrence and distribution based on 2D single channel seismic sections.1.1.Geologic settings of Japan Sea and Joetsu Basin
Japan Sea is a typical back-arc basin formed behind the Japa-nese island-arc system initiated by the rifting of the eastern margin of the Eurasian Continent at around 25Ma (Tamaki and Isezaki,1996).The opening was almost completed before 15Ma (Jolivet et al.,1994;Takeuchi,1996).During the Middle Pliocene,the tectonic style changed from extensional to compressive (Tamaki,1988),and a series of NNE-SSW trending folds,such as Umitaka Spur,were formed along the eastern margin of Japan Sea
(e.g.,Okui et al.,2008),where an incipient subduction zone extends throughout the western side of the Japanese island-arc system (Tamaki and Honza,1985).As a result,several potential hydrocarbon traps were formed during this period and continuous subsidence created kitchen areas with mature source rocks (Okui et al.,2008).
Joetsu Basin,located southwest of Sado Island (Fig.1),was formed in the Miocene (Okui et al.,2008;Suzuki,1979).A favor-able source rock was developed in the Miocene by high production of organic matter under anoxic conditions in Nanatani (<12.5Ma)and Teradomari (12.5e 5.5Ma)(Okui et al.,2008).From around 10Ma to 7Ma,the Japan Sea was tectonically stable and coarse-grained sediments were transported to the Joetsu Basin and deposited as turbidite fans,which became primary reservoirs in Teradomari and Shiiya (5.5e 3.5Ma)formations,at the late Miocene to the early Pliocene (Okui et al.,2008).The Nishiyama formation (3.5e 1.3Ma)overlies the Shiiya Formation,and it is composed mainly of ?ne mudstones with sandstones,including also dacites and andesites.
The top of the Nishiyama formation is characterized by a “domino style ”with several horsts and grabens.Normal and reverse faults are observed re ?ecting the complex stress ?eld involved (Seno,1999).Some of these faults belong to the rifting time,and were reactivated during the inversion tectonic process
*Corresponding author.PETROBRAS/CENPES/PDEXP/GSEP,Av.Horácio Macedo,950,Cidade Universitária,Ilha do Fund?o,Rio de Janeiro-RJ,21941-915,Brazil.Tel.:t552138657511;fax:t552138653748/4562.
E-mail addresses:fernandofreire@https://www.360docs.net/doc/513665924.html,.br (A.F.M.Freire),ryo@eps.s.u-tokyo.ac.jp (R.Matsumoto),luiz_albertos@https://www.360docs.net/doc/513665924.html,.br (L.A.Santos).1
Tel./fax:t81358414522.2
Tel.:t552138654738;fax:t55213865
4739.Contents lists available at ScienceDirect
Marine and Petroleum Geology
journal h omepage:ww w.elsevi https://www.360docs.net/doc/513665924.html,/locate/marp
etgeo
0264-8172/$e see front matter Crown Copyright ó2010Published by Elsevier Ltd.All rights reserved.doi:10.1016/j.marpetgeo.2010.10.004
Marine and Petroleum Geology 28(2011)1967e 1978
(Jolivet et al.,1994;Taira,2001).The Haizume formation has been deposited since the late Pleistocene,and it is dominated mainly by clayey sediments (Son et al.,2001).
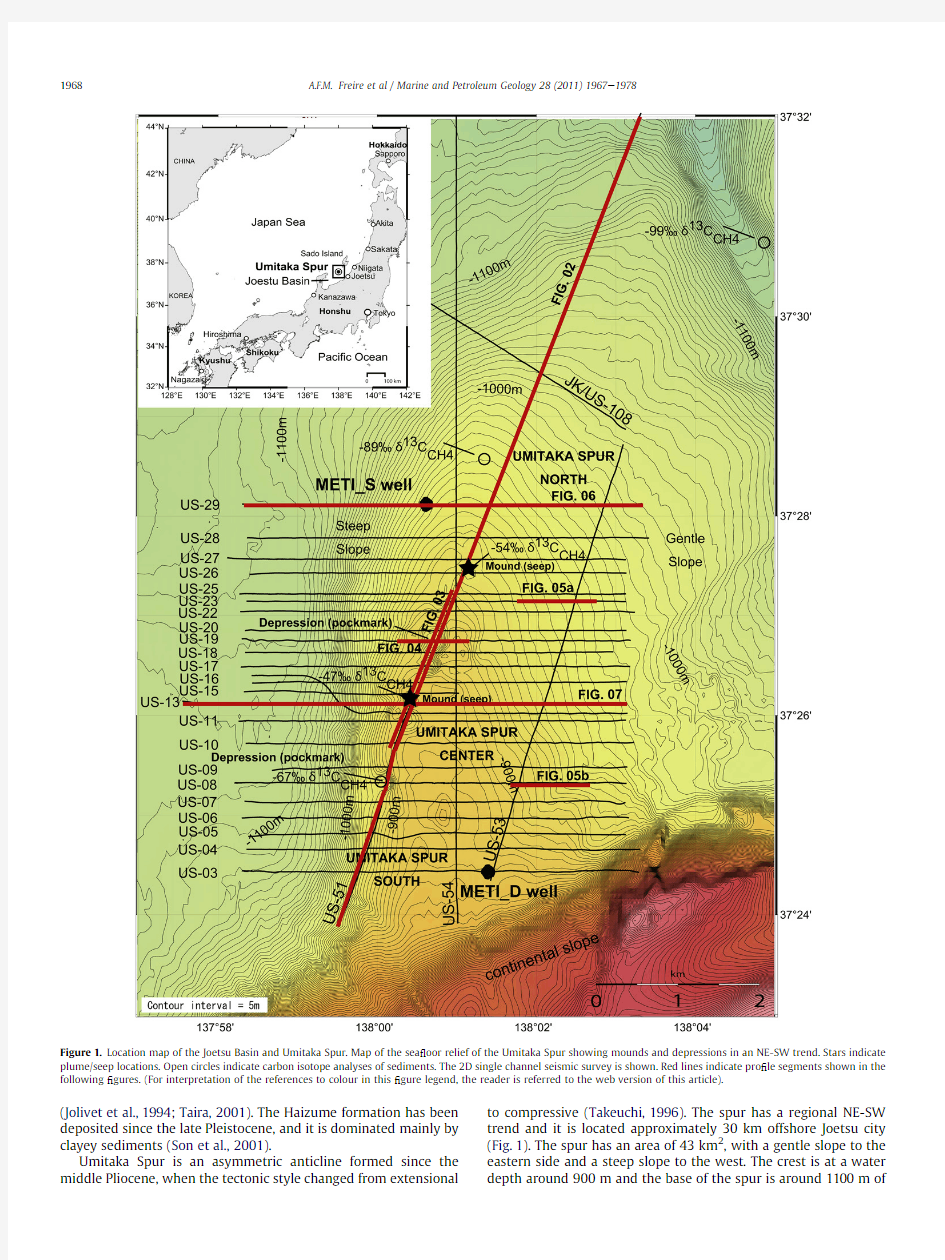
Umitaka Spur is an asymmetric anticline formed since the middle Pliocene,when the tectonic style changed from extensional to compressive (Takeuchi,1996).The spur has a regional NE-SW trend and it is located approximately 30km offshore Joetsu city (Fig.1).The spur has an area of 43km 2,with a gentle slope to the eastern side and a steep slope to the west.The crest is at a water depth around 900m and the base of the spur is around 1100m
of
Figure 1.Location map of the Joetsu Basin and Umitaka Spur.Map of the sea ?oor relief of the Umitaka Spur showing mounds and depressions in an NE-SW trend.Stars indicate plume/seep locations.Open circles indicate carbon isotope analyses of sediments.The 2D single channel seismic survey is shown.Red lines indicate pro ?le segments shown in the following ?gures.(For interpretation of the references to colour in this ?gure legend,the reader is referred to the web version of this article).
A.F.M.Freire et al /Marine and Petroleum Geology 28(2011)1967e 1978
1968
water depth.The anticlinal axis plunges north forming a nose-like spur (Fig.1).In the southern part,Umitaka Spur is connected to the continental slope,which plays an important role in the contribu-tion of sediments as debris-?ows.1.2.Previous studies on the Umitaka Spur
A 3-D seismic survey was conducted by the Ministry of Economy,Trade and Industry (METI)in 2003(Saeki et al.,2009),and two exploratory wells were drilled in 2004on the spur to con ?rm the petroleum system (Okui et al.,2008;Son et al.,2001).
The two wells (METI Deep and METI Shallow)and the 3-D seismic survey investigated the deep sedimentary section revealing an active petroleum system containing oil-bearing sand layers from 1000to 1300m below the sea ?oor (mbsf)and a thick Middle Miocene hydrocarbon source rock below 1360mbsf (Okui et al.,2008).Oil generation occurred in the Miocene,and a 15m oil column was con ?rmed in tuffaceous sandstones in the lower part of the Shiiya formation at the Shallow well (Okui et al.,2008).
The Umitaka Spur gas hydrate area has been studied since 2004by the Gas Hydrate Research Group of the Department of Earth and Planetary Science of the University of Tokyo and associated institutions (e.g.,Matsumoto,2005).Extended studies on gas hydrate issues such as geochemistry of sediments (e.g.,Freire et al.,2009),sea water chemistry at plume sites (Ishizaki,2008),pore-water chemistry (Hiruta et al.,2009;Tomaru et al.,2007),methane-related carbonates (Matsumoto et al.,2009a ),sea ?oor topography (Matsumoto,2005),and acoustic and seismic surveys (Aoyama and Matsumoto,2009;Saeki et al.,2009)conducted in the last few years have provided much information about this gas hydrate area.2.Methods
2.1.Single channel seismic (SCS)acquisition
The 2-D single channel seismic (SCS)acquisition system con-sisted of two Bolt air guns,with volume of 40cubic inches each.Operated at a pressure of 14MPa,they were deployed at 30m
behind the ship with depths varying from 1.5m to 7.4m due to the sea water wave movement.A short streamer (SIG type),with 48hydrophone receivers equally spaced at 1m,was also deployed at a minimum offset of 166.5m from the ship (136.5m from the source).The speed of the ship was 3.1knots with shots ?red at every 5s which corresponds to an average shot spacing of 8.3m.The recording time of seismogram was 4.0s with 1ms sampling rate yielding a Nyquist frequency of 500Hz.2.2.SCS survey
The SCS survey covered an area of 77km 2of the asymmetric anticline and surrounding areas (Fig.1).Strike and semi-strike pro ?les of approximately 15km in length each run parallel to the anticline axis of the spur.These pro ?les determine the axial structure of the spur and the link between METI Deep and Shallow wells.Also the strike lines establish relationships between gas chimney structures,seep site mounds and depressions (pock-marks)(Fig.1).
A total of 25dip pro ?les,approximately 7km in length each,were shot across the spur from west to east.They were obtained at an average spacing of 0.4km to study the structure and stratigraphy of Umitaka Spur,and to identify gas hydrate and free gas accu-mulations (Fig.1).2.3.SCS processing
Pre-processing was composed of trace editing,to avoid damaged traces,interpolation,and correction due to the system delay.A band pass ?lter with frequency limits of 25e 30e 360e 400Hz eliminated spurious signals greater than the Nyquist frequency of 500Hz,and any undesired low frequency oscillation.A spherical divergence was applied in the time domain.This was followed by a predictive deconvolution with a prediction distance of 6ms and an operator length of 150ms,which increased trace frequency content.
Finally,a frequency-wave number migration for constant common offset gathers was performed with a constant velocity of 1500m/s.The procedure increased section quality at
shallow
Figure 3.(a)non-interpreted and (b)interpreted detailed images of the near-strike SCS section US-51shown in Fig.2.Re ?ectors H-I to H-VI can be observed and correlated in all SCS sections.Note that faults link deep parts of the spur below the top of Nishiyama Formation to the sea ?oor and to the GHSZ,where offsets are observed.Pink dashed line is the potential BSR.See text for details.See Fig.1for pro ?le segment location.(For interpretation of the references to colour in this ?gure legend,the reader is referred to the web version of this article).
A.F.M.Freire et al /Marine and Petroleum Geology 28(2011)1967e 1978
1970
depths,but the applied velocity was not suitable for deeper hori-zons.After migration,the section was muted over the sea bottom to remove migration artifacts above the sea ?oor.3.Results
3.1.Identi ?cation of seismic re ?ectors
Saeki et al.(2009)observed a clear,strong and continuous re ?ector at around 1.9s two way travel (TWT)in 3D seismic pro ?les over the Umitaka Spur.Based on drilling data from METI,this re ?ector was identi ?ed as the top of Nishiyama formation,corre-sponding to the early Pleistocene at around 1.3Ma,at 622mbsf for the Deep well,and 364mbsf for the Shallow well (Okui et al.,2008).The same re ?ector could be identi ?ed and correlated in all SCS sections collected in Umitaka Spur region at around 1.8e 2.0s TWT,and provided a depth-age calibration using both METI Deep and Shallow wells (Freire,2010)(Fig.2).
Seismically,the top of the Nishiyama formation is character-ized by a strong re ?ector offset either by apparent normal and reverse faults (Figs.2and 3).Another six seismic events are clearly identi ?ed throughout the study area within the Haizume formation above the top of Nishiyama formation (Fig.3).Based on the depth control from both METI Deep and Shallow wells on
the top of Nishiyama Formation it was possible to infer the depths of the other six events within the Haizume Formation (Table 1).
3.2.Identi ?cation of faults and fractures
Almost all faults seem to be nearly vertical on SCS sections but the vertical exaggeration around 20times makes the geological structure appear much steeper than they are (Horozal et al.,2009).The faults appear as single fractures,with very small re ?ector offsets.However,offsets are clearly observed both at the top of Nishiyama formation and in the seismic events of Haizume formation (Figs.3and 4).
The 400m interval between SCS lines does not allow detailed mapping,but the lines give a general idea about the structural framework.
3.3.Identi ?cation of gas hydrate-and free gas-related features Both dip and strike SCS sections show characteristic features such as gas chimneys,BSR ’s,“pull-up ”structures,and the occur-rence of mounds and pockmarks on the sea ?oor,as described by Matsumoto et al.(2009a).
Table 1
Depth and velocity of Haizume Fm.seismic events inferred from the depth of Nishiyama Fm.observed on both METI Deep and Shallow wells.Epoch
Stratigraphy
Seismo Facies
TWT(ms)
OWT(ms)
OWT(msbsf)
Depth(mbsf)
Velocity(m/s)
Data from US-03(METI Deep Well)Holocene Haizume Fm.
Sea ?oor 1200600Pleistocene
H1128064040661659
H2139069595158H31480740140232H41550775175290H51620810210348H6
1750875275456Pliocene Nishiyama Fm.
Nishiyama
1950
975
375
622
Data from US-29(METI Shallow Well)Holocene Haizume Fm.
Sea ?oor 1300650Pleistocene
H1137068535571618
H214007005081H3148074090146H41530765115186H51600800150243H6
1700850200324Pliocene Nishiyama Fm.
Nishiyama
1750
875
225
364
TWT ?two way travel;OWT ?one way travel;msbsf ?milliseconds below the sea ?oor;mbsf ?meters below the sea ?
oor.
Figure 4.(a)non-interpreted and (b)interpreted detailed images of the dip section US-19showing pull-up structure within gas chimneys within the gas hydrate stability zone (GHSZ).Note that the seismic events,BSR and enhanced re ?ectors are offset by gas chimney boundary faults.See Fig.1for pro ?le segment location.
A.F.M.Freire et al /Marine and Petroleum Geology 28(2011)1967e 1978
1971
3.3.1.Gas chimneys and “pull-up ”structures
Gas chimneys are common in the presence of a subsurface migration of gas from a poorly sealed hydrocarbon accumulation.Relatively high gas concentrations can cause low velocity anoma-lies and are visible in seismic pro ?les as areas of poor data quality,or blanking zones.One characteristic of gas chimneys is that the seismic blanking obscures weak re ?ectors,while portions of the strongest re ?ectors can still be observed (Kou et al.,2007).Gas chimneys are widely observed in the Japan/East Sea and in other parts of the world,as reported by Haacke et al.(2009),Horozal et al.(2009),Riedel et al.(2002),Saeki et al.(2009),and are often related to the occurrence of gas hydrates.
Gas chimneys were identi ?ed in the axial part of the Umitaka Spur (Matsumoto et al.,2009a ).Their widths are 500e 700m,and they are located preferentially under sea ?oor mounds and pockmarks.The boundaries of gas chimneys are fault-related,and those faults extend downward to the top of Nishiyama formation (Fig.3).Offsets on the seismic events of Haizume formation indicate continuous tectonic activity throughout the Quaternary (Fig.4).
Because the strongest re ?ectors are still visible in some chim-neys,internal “pull-up ”structures can be mapped (Fig.4).These structures suggest that the velocity within gas chimneys is higher than the velocity in the surrounding sediments outside the gas chimneys inferring a higher gas hydrate concentration inside. 3.3.2.Bottom simulating re ?ectors and enhanced re ?ectors below Gas hydrate in the sediment pore space and fractures increases the seismic velocity within the gas hydrate stability zone (GHSZ),while the free gas accumulation just below the GHSZ decreases the seismic velocity.This difference in the seismic impedance appears as a strong re ?ector parallel to the sea ?oor,called a bottom simu-lating re ?ector (BSR).This re ?ector is stronger depending on the concentration of both gas hydrate and free gas (Hyndman and Davis,1992).
However,re ?ectors of Haizume formation are parallel to the sea ?oor at Umitaka Spur,and the recognition of a BSR is not an easy task since it is often dif ?cult to observe the BSR crossing the sedi-mentary re ?ections.The main indicator of the BSR is the enhanced re ?ection strength caused by the seismic velocity contrast between the gas-hydrate-rich region above and the free gas-rich layers below (Horozal et al.,2009).
The BSR extends from the axial part to the eastern ?ank of the spur (Fig.5),and can be mapped using the distribution of enhanced re ?ectors below as criteria.A ?at-spot re ?ector is observed cutting layers within the free gas zone just below the GHSZ in the eastern ?ank of Umitaka Spur and may represent a gas/water contact (Fig.5).Chaotic debris bodies below the BSR suggest free gas reservoirs while those located within the GHSZ may indicate gas-hydrate-charged zones,if the debris has enough permeability and porosity conditions to store ?
uids.
Figure 5.Non-interpreted and interpreted detailed images of the dip SCS sections US-23(a)and US-08(b).Chaotic zones are zones where re ?ectors are not continuous,and are here interpreted as debris-?ow deposits.Note a ?at re ?ector (blue dashed line)associated to the debris representing a possible gas/water contact just below the base of the GHSZ in the western ?ank of Umitaka Spur.See Fig.1for pro ?le segments location.(For interpretation of the references to colour in this ?gure legend,the reader is referred to the web version of this article).
A.F.M.Freire et al /Marine and Petroleum Geology 28(2011)1967e 1978
1972
3.3.3.Interval seismic velocities
Depth control by the METI Deep and Shallow wells on the Umitaka Spur in combination with the recognition of the top of Nishiyama formation in SCS pro ?les allow the calculation of interval velocities in the sediments of the northern and southern part of the spur (Table 1).In the Shallow well,the top of Nishiyama formation is identi ?ed at 364mbsf (Okui et al.,2008)and it is recognized at 450ms TWT on the SCS pro ?le US-29(Fig.6),giving an interval velocity of 1618m/s in the northern part of the spur (Table 1).In the Deep well,the top of Nishiyama formation is observed at 622mbsf (Okui et al.,2008)at around 750ms TWT on the SCS pro ?le US-03(Fig.6).The velocity calculated for the interval between the sea ?oor and the top of Nishiyama formation in the southern part of the spur is 1659m/s (Table 1
).
Figure 6.Dip SCS pro ?les US-29(a)and US-03(b),respectively at the northern and the southern part of Umitaka Spur.METI Deep and Shallow wells are plotted.See Fig.1for both the wells and pro ?les location.
A.F.M.Freire et al /Marine and Petroleum Geology 28(2011)1967e 19781973
Based on the results above,an average interval velocity of 1639m/s is given for the Haizume Formation sediments at both the northern and southern part of the structure (Fig.1).This velocity is slightly higher or similar to the velocities in shallow marine sediments of Japan Sea observed by Horozal et al.(2009)and Lee et al.(2005).In the axial part of the spur however,there are no direct well data to provide a reliable seismic time/depth conversion,but heat ?ow measurements can be used to provide an apparently estimate of the base of the GHSZ.
Machiyama et al.(2009)conducted an intensive heat ?ow measurements by means of ANTARES probe attached to 6to 8m-long piston cores or by 60cm-long heat probe (SAHF)on ROV
and
Figure 7.(a)non-interpreted and (b)interpreted detailed images of the dip SCS pro ?le US-13located on the central part of Umitaka Spur.Note strong gas chimney with blanking hiding weak re ?ectors.Pull-up structures within the gas chimneys affect both seismic events and the BSR.See Fig.1for pro ?le location.
A.F.M.Freire et al /Marine and Petroleum Geology 28(2011)1967e 1978
1974
revealed consistent and nearly constant heat ?ow of about 100mK/m over the study area (Machiyama et al.,2009).Matsumoto et al.(2009a)infer the depth of 115mbsf for the base of methane hydrate stability on the basis of the observed heat ?ow of 100mK/m,sea bottom temperature of 0.2 C and water salinity of 34000ppm,and the methane hydrate stability equation in sea water (Dickens and Quinby-Hunt,1994).
On the other hand,SCS survey showed that the time interval between the sea ?oor and BSR is around 200e 230ms TWT (Fig.7).Based on these data,Matsumoto et al.(2009a)
estimated
Figure 8.SCS-based map of Umitaka Spur.Deeper features are projected on the sea ?oor.
A.F.M.Freire et al /Marine and Petroleum Geology 28(2011)1967e 19781975
the interval velocity of 1000e 1150m/s between the sea ?oor and the BSR over the Umitaka spur.The estimated velocity is unusually low but 3D seismic data also provided the similar results.Saeki et al.(2009)applied 3D pre-stack time migration and continuous velocity analysis method to 3D seismic data,and revealed that the P-wave velocities below the sea ?oor in areas of the Umitaka Spur were generally low,ranging from 1200to 1300
m/s.
Figure 9.(b)Model for gas hydrate occurrence and main features of the Umitaka Spur gas hydrate/free gas system,based on dip SCS US-19(a)crossing the axial part of the structure in a W-E direction.H-I to H-VI are seismic events mapped along the SCS pro ?les within the Haizume formation (Freire,2010).Orange areas represent debris-?ow deposits.Arrows indicate potential gas migration pathways along faults,fractures and carrier beds.The arrows size represents the migration intensity.(For interpretation of the references to colour in this ?gure legend,the reader is referred to the web version of this article).
A.F.M.Freire et al /Marine and Petroleum Geology 28(2011)1967e 1978
1976
The anomalous low velocities of the Umitaka Spur sediments do not re?ect the absence of gas hydrate deposits,but the occurrence of the mixture of gas-charged and gas-hydrate-charged sediments, as proposed by Matsumoto et al.(2009a).The central part of the spur where gas chimneys occur is the region most affected by the presence of faults and fractures and this fact results in a strong conduit for free gas migration that enriches the GHSZ sediments with both free gas and gas hydrates.
Future multi-channel surveys using appropriate small offsets and high frequencies to evaluate shallow sediments within the GHSZ are recommended to provide realistic P-wave velocities with suf?cient accuracy to estimate the gas hydrate concentration at Umitaka Spur.
4.Discussion
The Quaternary Haizume Formation is the focus of this study because the entire GHSZ is located within that stratigraphic interval.The high frequency and the offset used during the seismic acquisition associated with the processing parameters applied allow a good evaluation of the Haizume Formation.It was possible to recognize six seismic events correlated between all SCS sections (Freire,2010)(Fig.3).
Seismically,the Haizume Formation is characterized by strong and continuous re?ectors,corresponding to the deposition of mainly clayey and silty sediments reported by Son et al.(2001). Some re?ectors are not continuous and stop in front of massive and chaotic zones.Chaotic zones are here interpreted as debris-?ows, deposits and they are common between events H-I to H-IV in the eastern?ank of Umitaka Spur(Fig.5).These zones may represent potential gas hydrate deposits,depending on characteristics of permeability and porosity.
The top of Nishiyama formation is characterized by several horsts and grabens(Fig.3),and apparent normal and reverse faults are observed indicating the complex stress?eld involved.Some of these faults are inherited from the rifting episode and reactivated during the inversion tectonic process(Seno,1999).The faults located at the axis of the structure,where fracturing is intense, propagate toward the top and promote the linkage of deep hydro-carbon reservoirs reported by Okui et al.(2008)to shallow sedi-ments and to the sea water column,inducing seepages and plumes.
Sea?oor mounds and pockmarks are located in the central part of the spur(Matsumoto,2005),and coincide with the strongest fractured zone.Due to this intense fracturing,Umitaka Spur center is the region with the higher concentration of methane seeps,gas hydrate outcrops,mounds and pockmarks(Matsumoto et al., 2009a).
The complex structural framework of the spur is also observed on the sea?oor,through the correlation of faults between SCS pro?les(Fig.8)(Freire,2010).Correlation of gas hydrate indicators such as gas chimneys and BSR can also be correlated across the SCS pro?les(Freire,2010)to produce a seismic-based map of the Umitaka Spur projected on the sea?oor.This map summarizes the location of gas chimneys and the relationship between mounds, pockmarks and seep sites.A clear SW-NE structural trend is observed and that trend also apparently controls gas chimney distribution,while the debris-?ow deposits distribution seems to be developed in an N e S trend.The latter suggests a probable linkage with the continental slope in the southern part of Umitaka Spur and may indicate a possible source of these debris deposits from the south.The extension of the present SCS survey to the south and west is necessary to promote a realistic discussion about the origin of debris.
Umitaka Spur has an inef?cient petroleum system because of the lack of trapped gas as revealed by the occurrence of seeps and plumes(Aoyama and Matsumoto,2009;Matsumoto,2005). Apparently,the seal and trap are not ef?cient because the deep axial faulting system is connecting gas/oil reservoirs to the sea?oor. Mud gas analysis conducted by Ishizaki(2008)indicates that depleted d13C CH4values are heavier thanà60&in sediments of the crest of the spur near the mound-seep sites,while the geochemical signatures are lighter thanà60&in sediments located far from seep sites(Fig.1).
The thermogenic character of those seeps and plumes in the central part of the spur(Hiruta et al.,2009;Matsumoto,2009)indi-cates that the gases are coming from deeper sources(Freire,2010), and cannot be generated in the shallow zones by biogenic processes. On the other hand,depleted mud gas analysis of d13C CH4in sediments collected outside gas chimneys indicates biogenic processes along those areas.Thus,both thermogenic and biogenic methane generation is observed at Umitaka Spur,depending on the location.
Intense and continuous thermogenic methane seeps generate plumes of700m height in the sea water column(Aoyama and Matsumoto,2009),and it is not possible to correlate such inten-sity with a primary migration from source rocks.High gas pressure and volume,associated with high sea water column pressure and low sea water temperature to stabilize gas hydrates,are necessary to provide such high,continuous and intense methane seeps and plumes.Such plumes are possible only if the gas bubbles belong to pressurized gas reservoirs located below the GHSZ,probably indicated by the enhanced re?ectors below the BSR(Fig.5).
Enhanced re?ectors and BSR are observed mainly on the eastern?ank and beneath the axial region of the spur.They are associated with the presence of debris-?ows deposits(Fig.5).This may indicate that the debris-?ow deposits have appropriate permeability and porosity conditions to concentrate gas hydrate within the GHSZ and free gas below the GHSZ,providing the observed high seismic impedance contrast.The debris reservoirs below the GHSZ are a potential source of free gas to supply the strong methane plumes in the axial part of the spur.
The weak ef?ciency of both seal and trap is not good for conventional gas and oil occurrence because the strong seeps indicate that large amounts of methane have been delivered to the sea?oor,but it is good for gas hydrate deposits because of the gas supply.Important gas migration provides hydrocarbons to the GHSZ and to the free gas accumulation zone just below it(Fig.5). The sedimentary column above these shallow potential free gas reservoirs may be is not enough to promote a conventional sedi-mentary seal for the pressurized free gas accumulation,but the gas-hydrate-?lling sediments within the GHSZ can decrease the sedimentary permeability and so allow an unconventional sedi-mentary-gas hydrate-seal for a free gas accumulation below the GHSZ in the eastern?ank of Umitaka Spur.
The combination of faults,carrier beds,depositional surfaces, thermogenic gas source location,and the geometry of the Umitaka Spur anticline focuses gas migration towards the top of the struc-ture,and also provides gas to the GHSZ.Elevated gas concentration results in the low velocities below BSR,creating enhanced re?ec-tors.The structural-stratigraphic features apparently control gas hydrate formation,gas chimneys,and seeps.A geological model for the gas hydrate and free gas occurrence based on the dip line US-08 crossing over a W-E direction in the central part of Umitaka Spur is summarized in Fig.9.
5.Summary
1)Within the Quaternary Haizume formation,overlaying the
Pliocene Nishiyama formation,six seismic re?ection events can be identi?ed.Offsets in these re?ectors can be interpreted as faults,indicating that tectonism is active during the
A.F.M.Freire et al/Marine and Petroleum Geology28(2011)1967e19781977
Quaternary.The faults connect deep reservoirs to the gas hydrate stability zone and to the sea?oor.Debris-?ows are common throughout the Quaternary sediments in the GHSZ, and may represent potential gas hydrate reservoirs.
2)Umitaka Spur is an asymmetric N e S anticline with a complex
axial fault system.In this fault system,both normal and reverse faults are observed.The center of the spur is the region most fractured because of the E-W regional compression.The combi-nation of faults,anticline shape and carrier beds induce ther-mogenic gas migration to occur in the central part of the spur.
3)The axial fault system results in an inef?cient seal and trap,and
high amounts of methane are delivered to the gas hydrate stability zone,where gas hydrate is generated.The excess gas ?ux from both deep reservoirs and gas hydrate dissociation produces methane plumes in the sea water.
4)Enhanced re?ectors below BSR indicate gas accumulation,and
may represent potential unconventional free gas reservoirs in debris-?ow deposits,depending on both permeability and porosity characteristics of those deposits.
Acknowledgments
The authors are thankful to Akihiro Hiruta,Carlson Leite,Dennis Miller,Fernando Castro,Hitoshi Tomaru,Luciano Magnavita,Nilo Matsuda,Osamu Ishizaki,Renato Kowsmann and Toshihiko Sugai for comments and discussions;to Hideaki Machiyama,Mikio Satoh and Mineo Hiromatsu for their support during the seismic acquisition;to all the colleagues of both Departments of Natural Environmental Studies and Earth and Planetary Science of the University of Tokyo;to the crew of R/V Natsushima during NT-07 and NT-08cruises.Special thanks to Adriano Viana,Almério Fran?a, Dimas Coelho,Gilmar Bueno,JoséCupertino,Luiz Antonio Trindade and Mario Carminatti for their valuable support.
We appreciate Dr.Michael Riedel and two anonymous reviewers for their thoughtful comments.
This research has been supported by the Grant-in-Aid from the Ministry of Education,Culture,Sports and Technology(MEXT)nos. 19204049and16201002.Also,this research has been conducted in collaboration with PETROBRAS/CENPES/PROFEX.
References
Aoyama,C.,Matsumoto,R.,2009.Acoustic surveys of methane plumes by Quanti-tative Echo Sounder in Japan Sea and estimate of the seeping amount of the methane hydrate bubbles.In:Matsumoto R.(Ed),Special Issue on“Methane Hydrate(Part1):Occurrence,Origin,and Environmental Impact”.Journal of Geography vol118(1),156e174.(In Japanese with abstract in English). Dickens,G.R.,Quinby-Hunt,M.S.,1994.Methane hydrate stability in seawater.
Geophysical Research Letters21(19),2115e2118.
Freire,A.F.M.,Menezes,T.R.,Matsumoto,R.,Sugai,T.,Miller,D.J.,2009.Origin of the Organic Matter in the Late-Quaternary Sediments of the Eastern Margin of Japan Sea.Journal of the Sedimentological Society of Japan68(2).
Freire,A.F.M.,2010.An Integrated Study on the Gas Hydrate Area of Joetsu Basin,Eastern Margin of Japan Sea,using Geophysical,Geological and Geochemical Data.Ph.D.
Thesis.The University of Tokyo,Graduate School of Frontier Sciences,247pages. Haacke,R.R.,Hyndman,R.D.,Park,K.-P.,Yoo,D.-G.,Stoian,I.,Schmidt,U.,2009.
Migration and Venting of deep gases into the Ocean through hydrate-Chocked chimneys offshore Korea.Geology37(6),531e534.
Hiruta,A.,Snyder,G.T.,Tomaru,H.,Matsumoto,R.,2009.Geochemical Constraints for the formation and dissociation of gas hydrate in an area of high methane
?ux,eastern margin of the Japan sea.Earth and Planetary Science Letters279, 326e339.
Horozal,S.,Lee,G.H.,Yi,B.Y.,Yoo,D.-G.,Parl,K.-P.,Lee,H.Y.,Kim,W.,Kim,H.J., Lee,K.,2009.Seismic indicators of gas hydrate and associated gas in the Ulleung basin,East Sea(Japan Sea)and Implications of heat?ows Derived from depths of the bottom-simulating re?ector.Marine Geology258, 126e138.
Hyndman,H.D.,Davis, E.E.,1992.A Mechanism for the formation of methane hydrate and sea?oor bottom-simulating re?ectors by vertical?uid Expulsion.
Journal of Geophysical Research97(B5),7025e7041.
Ishizaki,O.,2008.In?uence on the Marine Environment of Active Methane Plumes off Naoetsu,Eastern Margin of Japan Sea.The University of Tokyo,Master Thesis,p.79.
Jolivet,L.,Tamaki,K.,Fournier,M.,1994.Japan sea.Opening History and Mecha-nism:a Synthesis.Journal of Geophysical Research99(B11),22,237e22,259. Kou,W.-H.,Smith,M.A.,Ahmed,A.,Kuzela,R.,2007.Direct seismic indicators of gas hydrates in the Walker Ridge and Green Canyon areas,Deepwater Gulf of Mexico.The Leading Edge26-2,152e155.
Lee,J.H.,Baek,Y.S.,Ryu,B.J.,Riedel,M.,Hyndman,R.D.,2005.A seismic survey to Detect natural gas hydrate in the East Sea of Korea.Marine Geophysical Researches26,51e59.
Machiyama,H.,Kinoshita,M.,Takeuchi,R.,Masumoto,R.,Yamano,M., Hamamoto,H.,Hiromatsu,M.,Satoh,M.,Komatsubara,J.,2009.Heat?ow distribution around the Joetsu gas hydrate?eld,western Joetsu basin,eastern margin of the Japan sea.Journal of Geography118,986e1007.
Matsumoto,R.,2005.Methane plumes over a marine gas hydrate system in the eastern margin of Japan Sea:a possible mechanism for the transportation of subsurface methane to shallow waters.In:Proceedings of the5th International Conference on Gas Hydrates,Trondhein.pp.749e754.
Matsumoto,R.,2009.Formation and Collapse of gas hydrate deposits in high methane?ux area of the Joetsu basin,eastern margin of Japan sea,in:Mat-sumoto,R.(Ed.),Special Issue on“Methane Hydrate(Part1):Occurrence,Origin, and Environmental Impact”.Journal of Geography118(1),43e71.(In Japanese with abstract in English).
Matsumoto,R.,Freire,A.F.M.,Machiyama,H.,Satoh,M.,Hiruta,A.,2009a.Low Velocity Anomaly of Gas Hydrate Bearing Silty and Clayey Sediments,Joetsu Basin,Eastern Margin of Japan Sea.AOGS2009(Abstract).
Okui,A.,Kaneko,M.,Nakanishi,S.,Monzawa,N.,Yamamoto,H.,2008.An Integrated Approach to Understanding the petroleum system of a Frontier deep-water area,offshore Japan.Petroleum Geosciences14,1e12.
Riedel,M.,Hyndman,R.D.,Spence,G.D.,Chapman,N.R.,2002.Seismic Investiga-tions of a Vent?eld associated with gas hydrates,offshore Vancouver island.
Journal of Geophysical Researches,Solid Earth107(B9),2200.
Saeki,T.,Inamori,T.,Nagakubo,S.,Ward,P.,Asakawa,E.,2009.3D seismic structure below mounds and pockmarks in the deep water southwest of Sado island.In: Matsumoto,R.,et al.(Eds.),Special Issue on“Methane Hydrate(Part1): Occurrence,Origin,and Environmental Impact”.Journal of Geography vol 118(1),93e110.(In Japanese with abstract in English).
Seno,T.,1999.Synthesis of the regional stress?elds of the Japanese Islands.The Island Arc8,66e79.
Son,B.-K.,Yoshimura,T.,Fukazawa,H.,2001.Diagenesis of Dioctahedral and Tri-octahedral Smectites from Alternating beds in Miocene to Pleistocene rocks of the Niigata basin,Japan.Clays and Clay Minerals49(4),333e346.
Suzuki,U.,1979.Petroleum Geology of the Sea of Japan,northern Honshu.Journal of the Japanese Association for Petroleum Technology44,291e307(in Japanese with abstract in English).
Taira,A.,2001.Tectonic Evolution of the Japanese island arc system.Annual Review of Earth and Planetary Sciences29,109e134.
Takeuchi,A.,1996.Recent Crustal Movements and Strains Along the Eastern Margin of Japan Sea Floor.In:Isezaki,N.,et al.(Eds.),Geology and Geophysics of the Japan Sea(Japan-URSS Monograph Series1),pp.385e398.
Tamaki,K.,1988.Geological structure of the Japan Sea and its tectonic Implications.
Bulletin of Geology Survey of Japan39,269e365.
Tamaki,K.,Honza,E.,1985.Incipient subduction and Obduction along the eastern margin of the Japan sea.Tectonophysics119,381e406.
Tamaki,K.,Isezaki,N.,1996.Tectonic Synthesis of the Japan Sea Based on the Collaboration of the Japan-URSS Monograph Project.In:Isezaki,N.,et al.(Eds.), Geology and Geophysics of the Japan Sea(Japan-URSS Monograph Series1),pp.
483e487.
Tomaru,H.,Lu,H.,Snyder,G.T.,Fenh,U.,Hiruta,A.,Matsumoto,R.,2007.Origin and age of pore waters in an Actively Venting gas hydrate?eld near Sado island, Japan Sea:interpretation of Halogen and129I Distributions.Chemical Geology 236,350e366.
A.F.M.Freire et al/Marine and Petroleum Geology28(2011)1967e1978 1978