2A6a_1196
High Sensitive Ammonia Gas Sensor Based on Graphene Coated
Micro?ber
Xiaohui Sun1,2,Qizhen Sun1,2,Si Zhu1,
Ye Yuan1,Zhao Huang1,Xin Liu1,and Deming Liu1,2
1School of Optical and Electronic Information
Huazhong University of Science and Technology,Wuhan,Hubei430074,China
2National Engineering Laboratory for Next Generation Internet Access System
Huazhong University of Science and Technology,Wuhan,Hubei430074,China Abstract—We report a sensitive all-?ber ammonia gas sensor based on graphene coated mi-
cro?ber.Through light deposition and interaction with the evanescent?led of the micro?ber,the
graphene can be e?ectively coated onto it.The absorbed ammonia gas molecules signi?cantly
in?uent the conductivity of the graphene,resulting in the increase of the refractive index,which
makes the transmission optical power change with a sensitivity of0.1352dBm/100ppm and high
resolution of0.74ppm.The obtained results may have great potential applications in sensing
?elds with high sensitivity,fast response,easy fabrication and tunable ability.
1.INTRODUCTION
Ammonia is a kind of common poisonous gas in the atmosphere,mainly comes from the world of na-ture and arti?ciality.Being colorless and smelly,the ammonia gas may have irritation and corrosion e?ects to the human eyes and the upper respiratory tract mucous membrane.Therefore,ammonia gas sensor has been widely used in the?elds of?re,agriculture,chemical industry,medicine,etc., including portable,pumping suction and?xed type,the detection principle of which mostly are electrochemical principle.However,miniaturized,high sensitivity and electrical magnetic immune ammonia gas sensors are badly in need of for severe environment.
In recent years there has been reported a variety of new methods for the detection of ammonia. Based on the Lambert-Beer’s law,the traditional spectroscopy method is to detect the species and concentration according to the selective absorption to the spectra,which includes tunable diode laser absorption spectrum(TDLAS),non-dispersive infrared spectrum(NDIR)and Fourier transform infrared spectrum(FTIR)[1]etc..Nevertheless,these methods need lots of additional circuit and measurement instrument with complex operations. D.Cheng[2]proposed to use the near-?eld technology to prepare the polyaniline nano-?ber sensor and obtained the sensitivity of 2.7%at1×10?6.In the meantime,the carbon nanotube sensor,prepared by using two-dimensional electrophoresis technology,has good linear response when the concentration is higher than20×10?6. Fazel Yavari[3]demonstrated a macro graphene foam-like three-dimensional network ammonia gas sensor comprised of few-layer graphene sheets with the sensitivity of30%at1000ppm by detecting the electrical resistance.However,the sensor was susceptible to electromagnetic interference and the preparation process was complicated.
Micro/nano-?ber(MNF)[4]is a new type of optical waveguide with the diameter reaching to micron and nanometer level,featured with compact size,good?exibility,low loss,large evanescent ?eld and ease of integration,which has a wide application in communication and sensor systems. Graphene[5]has monolayer thickness of0.335nm,which appears as single two-dimensional hexag-onal lattice with high surface-to-volume ratio and excellent electronic-photonic properties.It has been used as transparent conductive?lm,lithium ion battery,super capacitor,organic photo-voltaic cell,electron?eld emitter,catalyst and gas https://www.360docs.net/doc/515738957.html,bining the advantages of MNF and graphene,we propose a passive and high sensitive ammonia gas sensor based on graphene coated micro?ber(GCMNF),which is of easy fabrication,miniaturization,low cost and high sensitivity.
2.WORKING PRINCIPLE
Graphene has large speci?c surface area to increase the contact area between sensor and ammonia gas molecules,thus improving the sensitivity.Due to being similar to the P-type semiconductor, when the molecules absorbed on the surface of graphene,its impurity band will emerge near the Fermi level and change the electronic properties of graphene[6].If the absorbed gas appears pull-electrical-e?ects[7],the holes will increase,making the electrical conductivity increase.On the
contrary,if the absorbed gas appears giving-electrical-e?ects,the redundant holes will be consumed,making the electrical conductivity decrease.Here ammonia gas molecule is the latter one,which makes the decreasing of the graphene electrical conductivity.
According to Ref.[8],the electrical conductivity and refractive index of graphene have the relationship of
εe?=1+iσc /ωε0d (1)n =√εe?(2)
Here σc is the electrical conductivity,d is the thickness of graphene,εe?is the e?ective permittivity,n is the refractive index of graphene.The real part of refractive index of graphene can be calculated as n gr = ?(σi ?ωε0d )+ (σi ?ωε0d )2+σ2r 2ωε0d
12
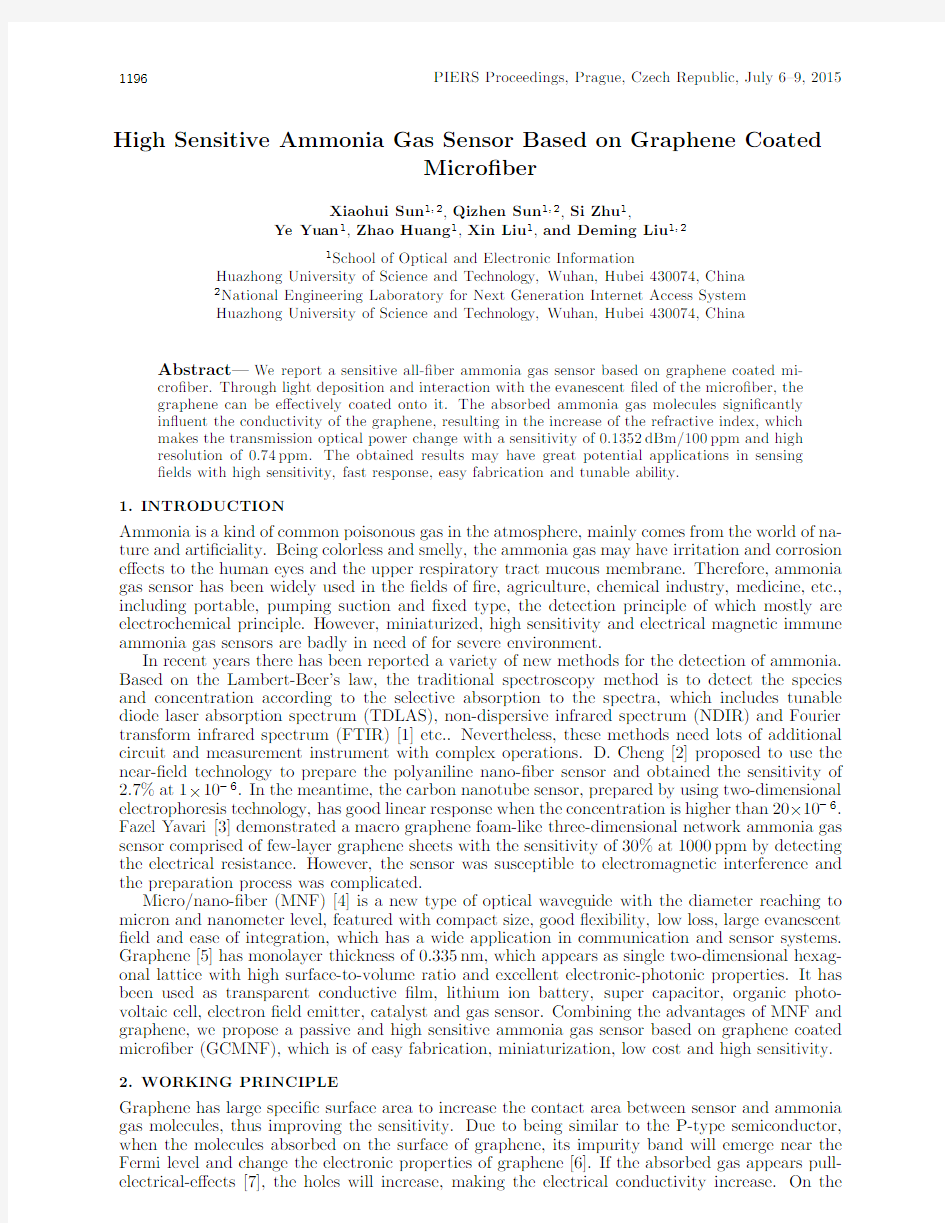
(3)The simulation result is showed in Fig.1,where the refractive index of graphene increases along with the increasing of the imaginary part of the electrical conductivity.According to the optical waveguide theory,the larger the refractive index of graphene,the larger of the n e?[9].Then the evanescent ?eld increases as well as the transmission optical power in the core decreases along with the increasing of the n e?.Based on the above analyses,the sensing of ammonia gas concentration can be achieved by measuring the variation of the transmitted optical
power.
Figure 1:The real part of refractive index of graphene changes with the real and imagine parts of conductivity.
3.SYSTEM CONFIGURATION
The micro?ber is bilaterally stretched from a standard single-mode-?ber (SMF)by using the ?ame-heating and taper-drawing technology.The microscope image of micro?ber with the waist diameter of about 5μm and the length of 10mm is shown in Fig.2(a).The graphene dispersion is confected by mixing 2mg reduction of oxide graphene powder into 20ml anhydrous ethanol with concentration of 0.1mg/ml,and then the solution is dispersed by 80w–59kHz ultrasonic cleaner for 60mins to make the graphene disperses in the ethanol uniformly,as depicted in Fig.2(b).Then ?x the two ends of the micro?ber onto the three-dimensional alignment stages,and adjust the stage to make the whole micro?ber dangling in the V groove.The whole deposition structure is shown in Fig.2(c).When 13dBm of radiation from a broadband optical source is propagating in the micro?ber,we drip several drops of graphene dispersion into the V groove,making the micro?ber immersed in it.Based on the [10],the light injection from air into the dispersion thermally causes swirl and convec-tion at the boundary,which helps to carry the graphene particles closer to the micro?ber.Then,the optical tweezer e?ect can trap micro/nano-sized objects by the optical intensity diversion in the solution.The micro?ber has large evanescent ?eld,which causes the optical intensity diversion.The Lorentz force is applied onto the objects in the electromagnetic ?eld and is stronger toward the higher optical intensity direction,thus tend to trap the graphene particles onto the micro?ber.
(a)
(b)(c)
(d)
Figure 2:(a)Microscope image of bare micro?ber,(b)microscope image of the graphene dispersion,(c)diagram of the deposition device,(d)microscope image of the graphene coated micro?ber.
When dripping the graphene dispersion,the transmission loss increases ?rst and then decreases gradually during the evaporation of ethanol.The optical power is collected by the optical power meter during the deposition process to measure the loss.Five minutes later,turn o?the light source and wait for the ethanol to evaporate.When the power remains unchanged,it means that the ethanol is evaporated completely and the micro?ber is well coated by graphene.Before and after the deposition,we both use alcohol and de-ionized water to clean the micro?ber for 2mins alternately to get rid of the dust and non-uniformly deposited graphene.
The graphene coated micro?ber is clearly seen through the microscopy,as showing in Fig.2(d).The thickness of the GCMNF is about 17.063μm.It’s a little thicker,maybe because of the high optical power leading to excess deposition,which may reduce the sensitivity of the GCMNF.
4.EXPERIMENT AND DISCUSSION
To evaluate the performance of the GCMNF for ammonia gas detection,we measured the trans-mission intensity of the GCMNF with ammonia gas concentration ranging from 0to 500ppm as shown in Fig.3.The GCMNF was ?xed into the gas chamber with the volume of about 1300ml.The broadband light source was injected into the GCMNF and collected by the optical power meter.The catheter of the outlet was inserted into the beaker with water inside,in case of the ammonia leaking to the environment.500ppm of ammonia and nitrogen mixed gas as well as the pure nitrogen gas acted as the gas generators.
At ?rst,we tested the stability of the broadband light source.The deviation of the output power of the light source was less than 0.001dB in 20mins,indicating that the light source was stable.Under the nitrogen atmosphere,enough NH 3was injected into the chamber uniformly,which lasted for 200s.To measure the reversibility of the system,inject N 2instead of NH 3and last for another 300s.The pressure reducing valve was used to control the gas velocity and the power was detected every 30s.We repeated the measurements for concentration rising and falling process and recorded the results to validate the repeatability of the gas sensor.
The experimental results are showing in Fig.4.During the concentration of NH 3increasing from 0to 500ppm,the translation power decreases from ?6.82to ?7.84dBm the ?rst time and ?6.72to ?7.38dBm the second time,respectively.Through the linear ?tting,we obtain the sensitivity of 0.1352dB/100ppm.Since the resolution of the commercial optical power meter can be as high as
Broadband
Optical power meter Figure 3:Schematic diagram of the ammonia gas
sensor system.
100200300400800900T r a n s m i s s i o n p o w e r /d B m Time/s
Figure 4:Transmission power changes with time.
0.001dBm,the ammonia concentration resolution can reach to0.74ppm.When the concentration of NH3decreases from500to0ppm,the power is higher than the initial value,which may be result from the instability of the MNF.
The experiment errors mostly come from the following aspects,the air doesn’t discharge com-pletely and the NH3is discharged too quickly without full e?ect with the graphene.In addition, the MNF is unstable under the air impact,which also in?uences the transmission power.
It should be noted that the sensitivity can be improved by fabricating more uniform micro?ber with small optical loss and appropriately adjusting the contact length between the graphene and MNF.
5.CONCLUSION
In conclusion,a sensitive all-?ber ammonia gas sensor based on the graphene coated micro?ber is proposed and demonstrated.The absorption of the ammonia gas molecules have a strong in?uence on the refractive index of graphene,resulting in the transmission power change in micro?ber with the sensitivity of0.1352dBm/100ppm and high resolution of0.74ppm.In addition,the sensitivity is tunable by adjusting the coating thickness of graphene.Such a graphene coated micro?ber with high sensitivity,fast response,easy fabrication,low cost and tunable ability would have great potential applications in environmental monitoring?elds.
ACKNOWLEDGMENT
This work was supported by the National Natural Science Foundation of China(No.61275004, No.61290315),the European Commission’s Marie Curie International Incoming fellowship(Grant No.328263),the Natural Science Foundation of Hubei Province for Distinguished Young Schol-ars(No.2014CFA036),and also partly supported by the National Key Scienti?c Instrument and Equipment Development Project of China(No.2013YQ16048707).
REFERENCES
1.Zhang,Q.,L.Wang,X.Yang,et al.,“Monitoring procedures of ammonia released from live-
stock farm,”Agro-Environment Science,Vol.26,No.B03,309–312,2007.
2.Chen,D.,S.Lei,R.Wang,et al.,“Dielectrophoresis carbon nanotube and conductive polyani-
line nano?ber NH3gas sensor,”Analytical Chemistry,Vol.40,2012.
3.Yavari,F.,Z.Chen,A.V.Thomas,et al.,“High sensitivity gas detection using a macroscopic
three-dimensional graphene foam network,”Scienti?c Reports,Vol.1,2011.
4.Tong,L.,R.R.Gattass,J.B.Ashcom,et al.,“Sub-wavelength diameter silica wires for low
loss optical wave guiding,”Nature,Vol.426,No.6968,816–819,2003.
5.Hanson,G.W.,“Dyadic Green’s functions and guided surface waves for a surface conductivity
model of graphene,”Journal of Applied Physics,Vol.103,No.6,064302,2008.
6.Zou,Y.,“Theoretical study on gas sensing properties of functionalized graphene,”Qufu Normal
University,2011.
7.Sun,F.and S.Xu,“Application of graphene material in gas-sensor,”South China Normal
University(Natural Science Edition),Vol.45,No.6,92–98,2013.
8.Simesek,E.,“A closed-form approximate expression for the optical conductivity of graphene,”
Optics Letters,Vol.38,No.9,1437–1439,2013.
9.Yao,B.,Y.Wu,Y.Cheng,et al.,“All optical Mach Zehnder interferometric NH3gas sen-
sor based on graphene/micro?ber hybrid waveguide,”Sensors and Actuators B:Chemical, Vol.194,142–148,2014.
10.Kashiwagi,K.and S.Yamashita,“Deposition of carbon nanotubes around micro?ber via
evanescent light,”Optics Express,Vol.17,No.20,18364–18370,2009.