ap微观经济真题-05

AP? Microeconomics
2005 Free-Response Questions
Form B
The College Board: Connecting Students to College Success
The College Board is a not-for-profit membership association whose mission is to connect students to college success and opportunity. Founded in 1900, the association is composed of more than 4,700 schools, colleges, universities, and other educational organizations. Each year, the College Board serves over three and a half million students and their parents, 23,000 high schools, and 3,500 colleges through major programs and services in college admissions, guidance, assessment, financial aid, enrollment, and teaching and learning. Among its best-known programs are the SAT?, the PSAT/NMSQT?, and the Advanced Placement Program? (AP?). The College Board is committed to the principles of excellence and equity, and that commitment is embodied in all of its programs, services, activities, and concerns.
Copyright ? 2005 by College Board. All rights reserved. College Board, AP Central, APCD, Advanced Placement Program, AP, AP Vertical Teams, Pre-AP, SAT, and the acorn logo are registered trademarks of the College Entrance Examination Board. Admitted Class Evaluation Service, CollegeEd, Connect to college success, MyRoad, SAT Professional Development, SAT Readiness Program, and Setting the Cornerstones are trademarks owned by the College Entrance Examination Board.
PSAT/NMSQT is a registered trademark of the College Entrance Examination Board and National Merit Scholarship Corporation. Other products and services may be trademarks of their respective owners. Permission to use copyrighted College Board materials may be requested online at: https://www.360docs.net/doc/619635545.html,/inquiry/cbpermit.html.
Visit the College Board on the Web: https://www.360docs.net/doc/619635545.html,.
AP Central is the official online home for the AP Program and Pre-AP: https://www.360docs.net/doc/619635545.html,.
MICROECONOMICS
SECTION II
Planning time—10 minutes
Writing time—50 minutes
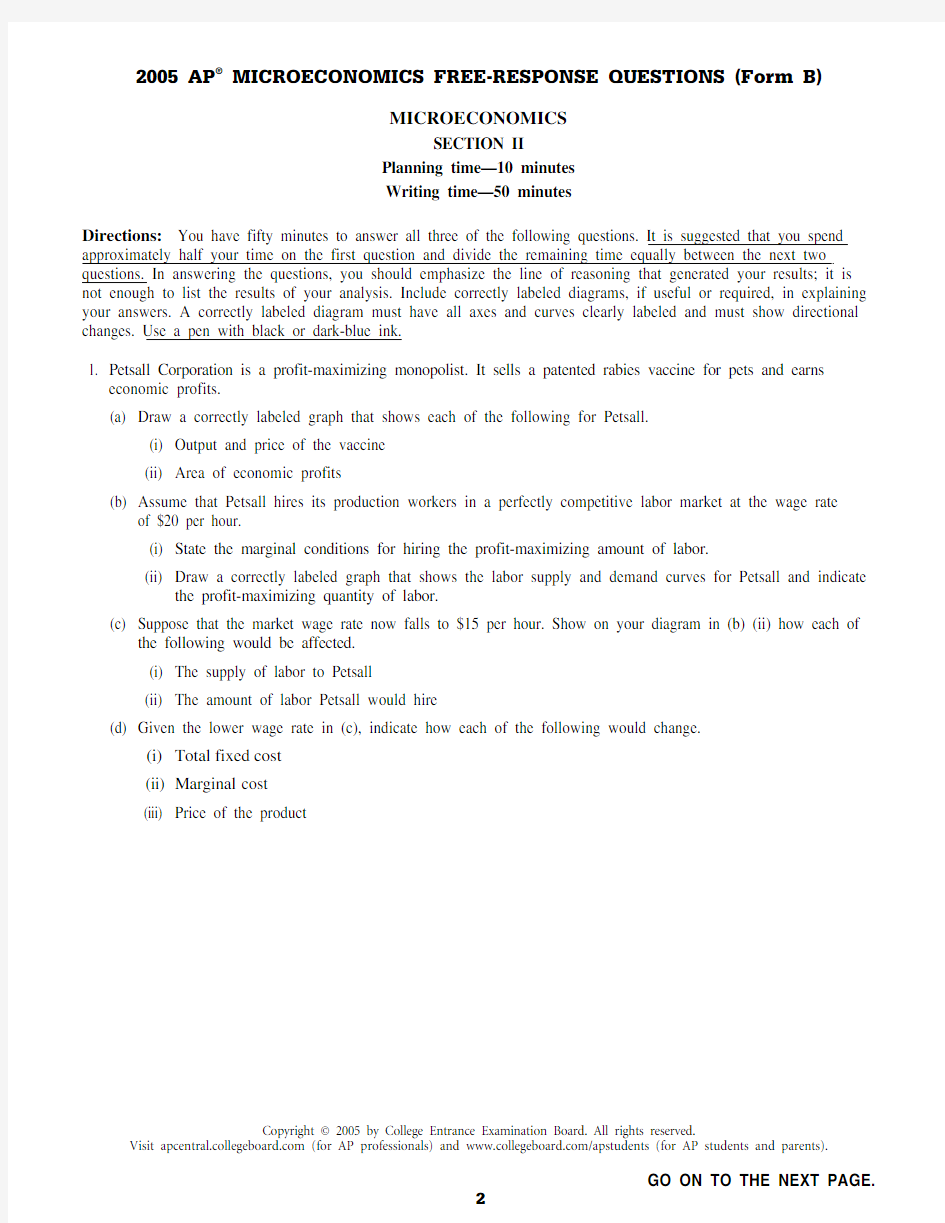
Directions: You have fifty minutes to answer all three of the following questions. It is suggested that you spend approximately half your time on the first question and divide the remaining time equally between the next two questions. In answering the questions, you should emphasize the line of reasoning that generated your results; it is not enough to list the results of your analysis. Include correctly labeled diagrams, if useful or required, in explaining your answers. A correctly labeled diagram must have all axes and curves clearly labeled and must show directional changes. Use a pen with black or dark-blue ink.
1. Petsall Corporation is a profit-maximizing monopolist. It sells a patented rabies vaccine for pets and earns
economic profits.
(a) Draw a correctly labeled graph that shows each of the following for Petsall.
(i) Output and price of the vaccine
(ii) Area of economic profits
(b) Assume that Petsall hires its production workers in a perfectly competitive labor market at the wage rate
of $20 per hour.
(i) State the marginal conditions for hiring the profit-maximizing amount of labor.
(ii) Draw a correctly labeled graph that shows the labor supply and demand curves for Petsall and indicate the profit-maximizing quantity of labor.
(c) Suppose that the market wage rate now falls to $15 per hour. Show on your diagram in (b) (ii) how each of
the following would be affected.
(i) The supply of labor to Petsall
(ii) The amount of labor Petsall would hire
(d) Given the lower wage rate in (c), indicate how each of the following would change.
(i) Total fixed cost
(ii) Marginal cost
(iii) Price of the product
2. The graph above shows the short-run cost structure of a firm in a perfectly competitive industry.
(a) Identify the cost curves that are denoted by each of the following labels.
(i) Curve 1
(ii) Curve 2
(iii) Curve 3
(b) Explain why curve 1 does each of the following as output increases.
(i) Initially decreases
(ii) Finally increases
(c) What measure of cost is represented by the vertical distance between curve 2 and curve 3 ?
(d) Explain why the vertical distance between curve 2 and curve 3 decreases as output increases.
(e) Using the letters on the graph, identify two points on the firm’s short-run supply curve.
3. Assume that bread and butter are complementary goods. The government begins to subsidize the production
of wheat, which is an input in the production of bread.
(a)For each of the following markets, draw correctly labeled supply and demand graphs and show the effect
of the subsidy on the equilibrium price and quantity in the short run.
(i) The wheat market
(ii) The bread market
(iii) The butter market
(b) If the demand for bread is price elastic, how will total revenues for the bread producers change as a result
of the government subsidy?
END OF EXAMINATION