高盛投行估值财务模型
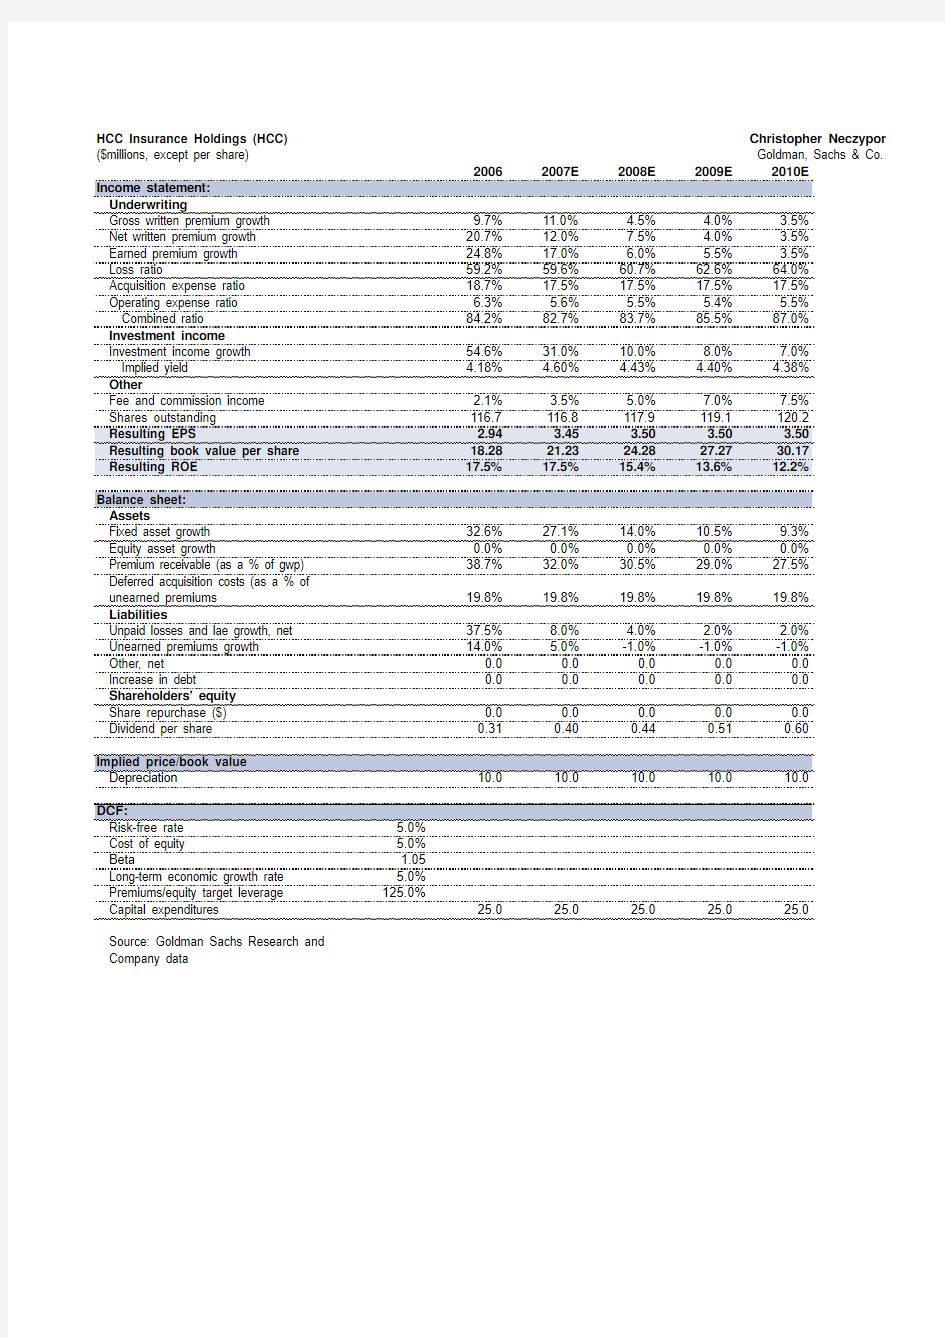
HCC Insurance Holdings (HCC)Christopher Neczypor ($millions, except per share)Goldman, Sachs & Co.
Gross written premium growth9.7%11.0% 4.5% 4.0% 3.5%
Net written premium growth20.7%12.0%7.5% 4.0% 3.5%
Earned premium growth24.8%17.0% 6.0% 5.5% 3.5%
Loss ratio59.2%59.6%60.7%62.6%64.0%
Acquisition expense ratio18.7%17.5%17.5%17.5%17.5%
Operating expense ratio 6.3% 5.6% 5.5% 5.4% 5.5%
Investment income
Investment income growth54.6%31.0%10.0%8.0%7.0%
Implied yield 4.18% 4.60% 4.43% 4.40% 4.38%
Other
Fee and commission income 2.1% 3.5% 5.0%7.0%7.5%
Fixed asset growth32.6%27.1%14.0%10.5%9.3%
Equity asset growth0.0%0.0%0.0%0.0%0.0%
Premium receivable (as a % of gwp)38.7%32.0%30.5%29.0%27.5%
Deferred acquisition costs (as a % of
unearned premiums19.8%19.8%19.8%19.8%19.8%
Liabilities
Unpaid losses and lae growth, net37.5%8.0% 4.0% 2.0% 2.0%
Other, net0.00.00.00.00.0
Increase in debt0.00.00.00.00.0 Shareholders' equity
Share repurchase ($)0.00.00.00.00.0
Dividend per share0.310.400.440.510.60
Cost of equity 5.0%
Beta 1.05
Long-term economic growth rate 5.0%
Premiums/equity target leverage125.0%
Capital expenditures25.025.025.025.025.0
Source: Goldman Sachs Research and
Company data
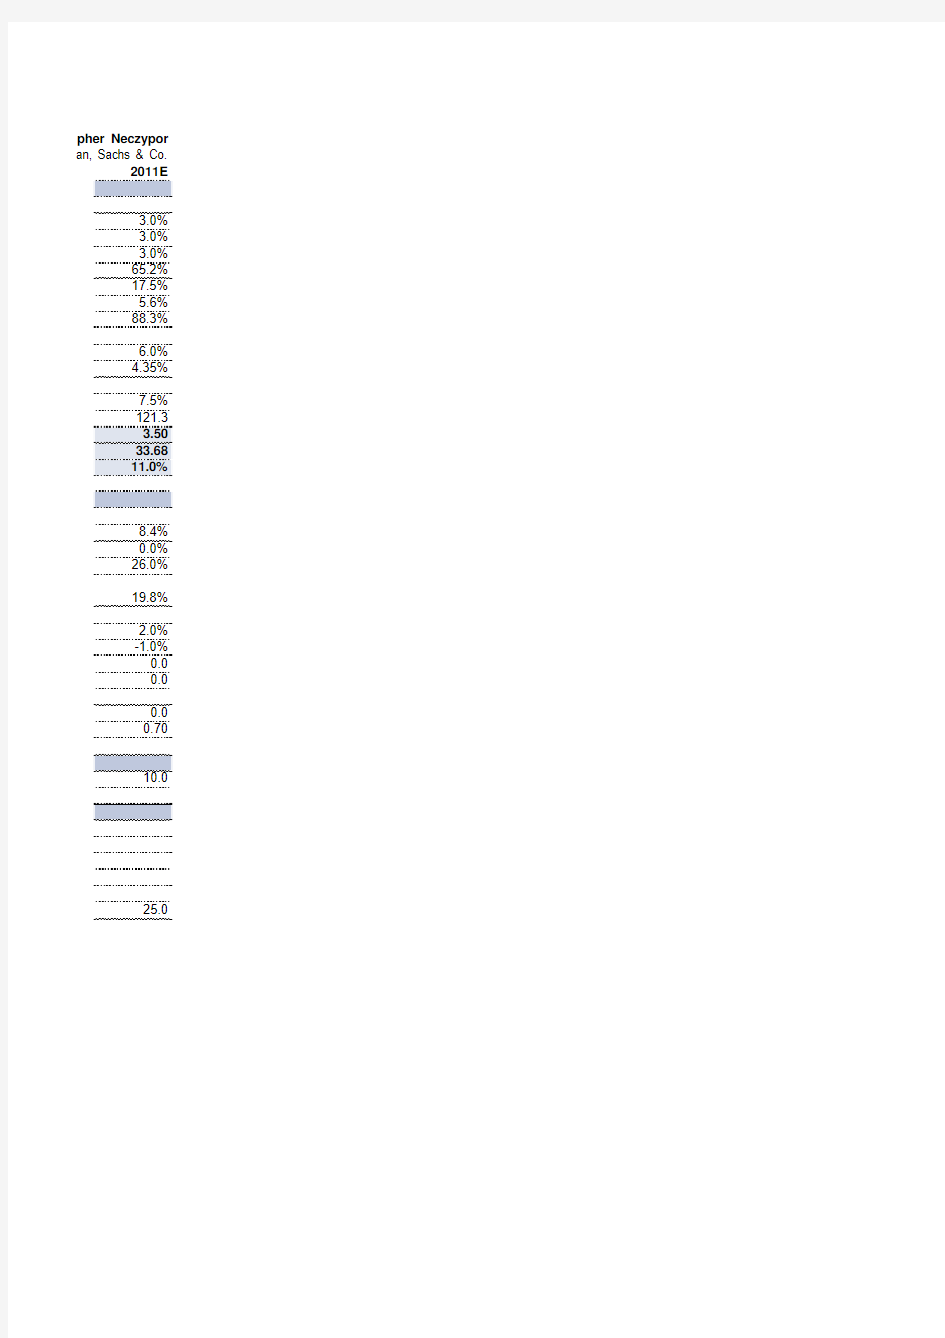
pher Neczypor an, Sachs & Co.
3.0%
3.0%
3.0%
65.2%
17.5%
5.6%
6.0%
4.35%
7.5%
8.4%
0.0%
26.0%
19.8%
2.0%
0.0
0.0
0.0
0.70
25.0