SampleFinalExam
Sample Final Exam
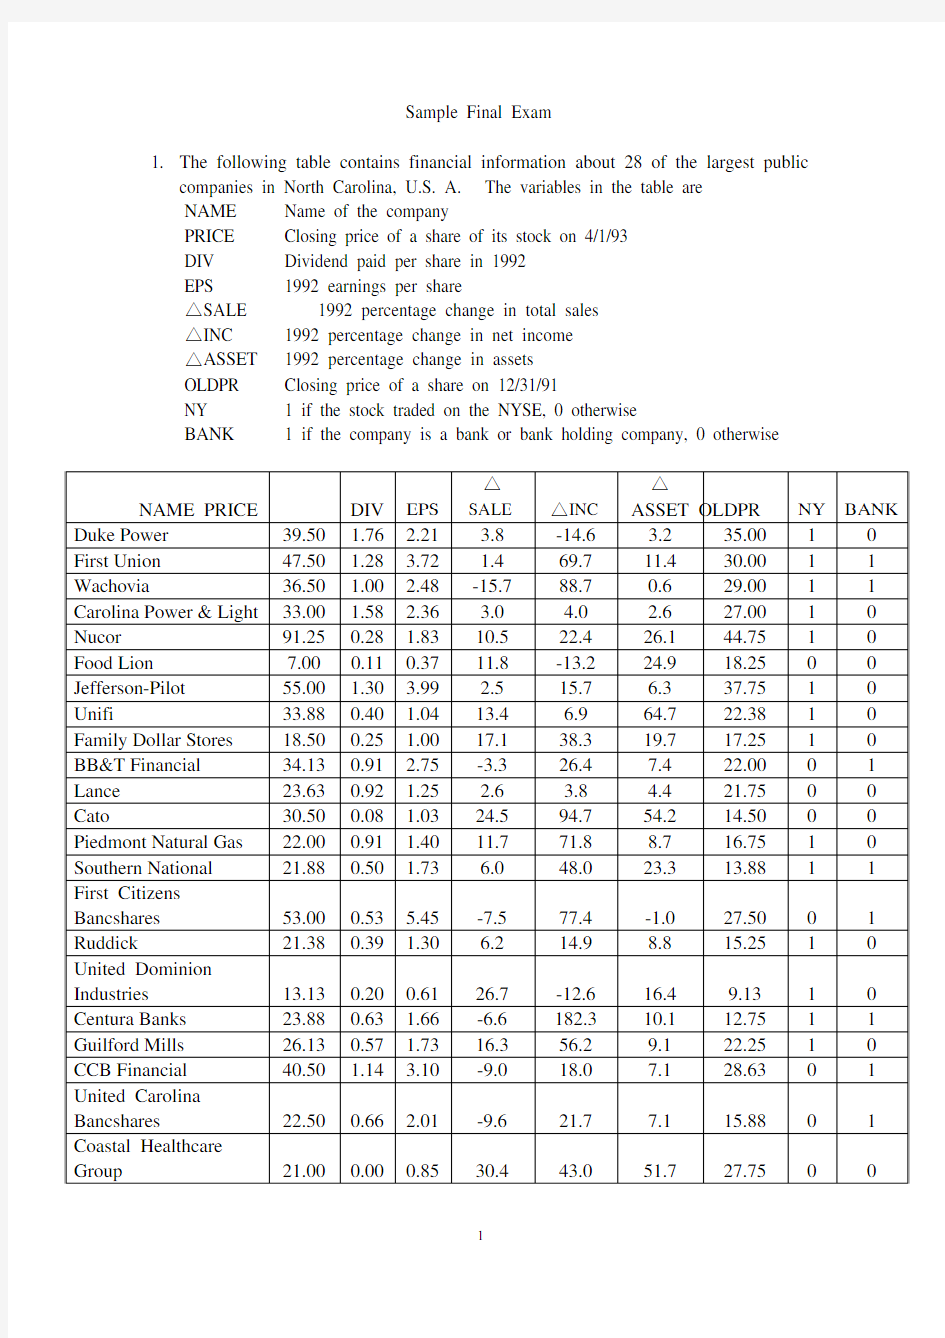
1. The following table contains financial information about 28 of the largest public
companies in North Carolina, U.S. A. The variables in the table are
NAME Name of the company
PRICE Closing price of a share of its stock on 4/1/93
DIV Dividend paid per share in 1992
EPS 1992 earnings per share
△SALE 1992 percentage change in total sales
△INC 1992 percentage change in net income
△ASSET 1992 percentage change in assets
OLDPR Closing price of a share on 12/31/91
NY 1 if the stock traded on the NYSE, 0 otherwise
BANK 1 if the company is a bank or bank holding company, 0 otherwise
NAME PRICE
DIV
EPS
△
SALE △INC
△
ASSET OLDPR NY BANK
Duke Power 39.50 1.76 2.21 3.8 -14.6 3.2 35.00 1 0 First Union 47.50 1.28 3.72 1.4 69.7 11.4 30.00 1 1 Wachovia 36.50 1.00 2.48 -15.7 88.7 0.6 29.00 1 1 Carolina Power & Light 33.00 1.58 2.36 3.0 4.0 2.6 27.00 1 0 Nucor 91.25 0.28 1.83 10.5 22.4 26.1 44.75 1 0 Food Lion 7.00 0.11 0.37 11.8 -13.2 24.9 18.25 0 0 Jefferson-Pilot 55.00 1.30 3.99 2.5 15.7 6.3 37.75 1 0 Unifi 33.88 0.40 1.04 13.4 6.9 64.7 22.38 1 0 Family Dollar Stores 18.50 0.25 1.00 17.1 38.3 19.7 17.25 1 0 BB&T Financial 34.13 0.91 2.75 -3.3 26.4 7.4 22.00 0 1 Lance 23.63 0.92 1.25 2.6 3.8 4.4 21.75 0 0 Cato 30.50 0.08 1.03 24.5 94.7 54.2 14.50 0 0 Piedmont Natural Gas 22.00 0.91 1.40 11.7 71.8 8.7 16.75 1 0 Southern National 21.88 0.50 1.73 6.0 48.0 23.3 13.88 1 1 First Citizens
Bancshares 53.00 0.53 5.45 -7.5 77.4 -1.0 27.50 0 1 Ruddick 21.38 0.39 1.30 6.2 14.9 8.8 15.25 1 0 United Dominion
Industries 13.13 0.20 0.61 26.7 -12.6 16.4 9.13 1 0 Centura Banks 23.88 0.63 1.66 -6.6 182.3 10.1 12.75 1 1 Guilford Mills 26.13 0.57 1.73 16.3 56.2 9.1 22.25 1 0 CCB Financial 40.50 1.14 3.10 -9.0 18.0 7.1 28.63 0 1 United Carolina
Bancshares 22.50 0.66 2.01 -9.6 21.7 7.1 15.88 0 1 Coastal Healthcare
Group 21.00 0.00 0.85 30.4 43.0 51.7 27.75 0 0
Public Service of NC 17.25 0.75 1.09 24.4 58.9 8.1 11.88 0 0 Oakwood Homes 20.25 0.06 0.90 42.4 58.0 25.3 10.63 1 0 NC Natural Gas 26.63 0.98 1.79 18.9 38.3 23.0 16.38 1 0 Bank of Granite 30.00 0.38 1.65 -9.7 13.3 7.9 19.63 0 1 PCA International 16.25 0.28 0.89 8.0 5.6 51.4 14.88 0 0 Ingles Markets 6.25 0.22 0.31 2.1 -48.8 2.0 6.13 0 0
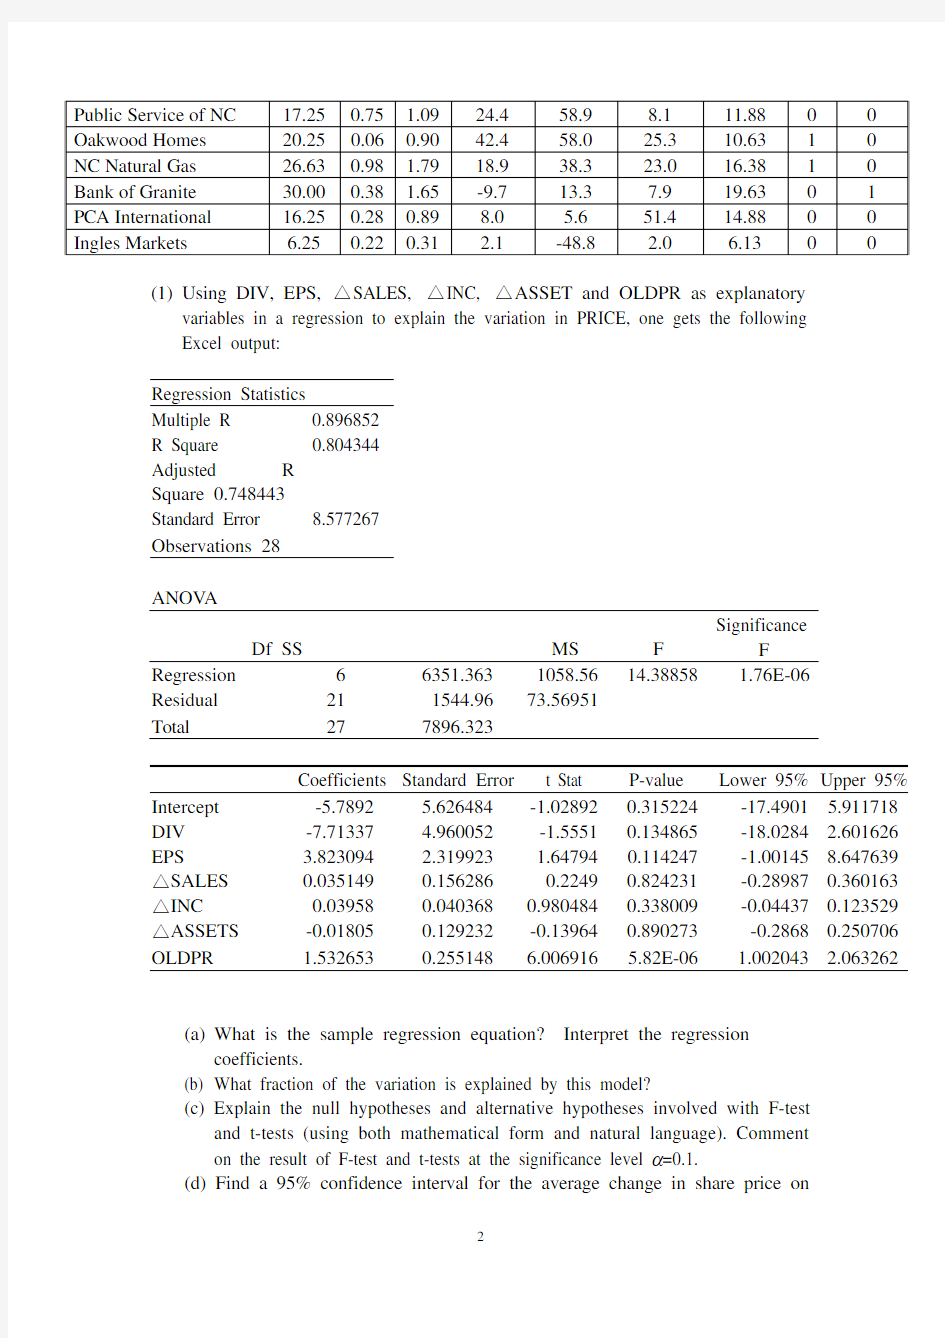
(1) Using DIV , EPS, △SALES, △INC, △ASSET and OLDPR as explanatory variables in a regression to explain the variation in PRICE, one gets the following
Excel output:
Regression Statistics
Multiple R 0.896852
R Square 0.804344
Adjusted R
Square 0.748443 Standard Error 8.577267
Observations 28
ANOV A
Df SS MS F Significance
F
Regression 6 6351.363 1058.56 14.38858 1.76E-06
Residual 21 1544.96 73.56951
Total 27 7896.323
Coefficients Standard Error t Stat P-value Lower 95%Upper 95%
Intercept -5.7892 5.626484 -1.02892 0.315224 -17.4901 5.911718 DIV -7.71337 4.960052 -1.5551 0.134865 -18.0284 2.601626 EPS 3.823094 2.319923 1.64794 0.114247 -1.00145 8.647639 △SALES 0.035149 0.156286 0.2249 0.824231 -0.28987 0.360163 △INC 0.03958 0.040368 0.980484 0.338009 -0.04437 0.123529 △ASSETS -0.01805 0.129232 -0.13964 0.890273 -0.2868 0.250706 OLDPR 1.532653 0.255148 6.006916 5.82E-06 1.002043 2.063262
(a) What is the sample regression equation? Interpret the regression
coefficients.
(b) What fraction of the variation is explained by this model?
(c) Explain the null hypotheses and alternative hypotheses involved with F-test
and t-tests (using both mathematical form and natural language). Comment
on the result of F-test and t-tests at the significance level α=0.1.
(d) Find a 95% confidence interval for the average change in share price on
4/1/93 per $5 increase in the share price on 12/31/91.
(2) Now use DIV , EPS, OLDPR, NY and BANK as the explanatory variables. Suppose the results are as follows:
Regression Statistics
Multiple R 0.902609 R Square 0.814703 Adjusted R
Square 0.77259 Standard Error 8.155215 Observations 28 ANOV A
Df SS MS F Significance F
Regression 5 6433.157 1286.631 19.34565 2.16E-07 Residual 22 1463.166 66.50753 Total 27 7896.323
Coefficients Standard Error t Stat P-value Lower 95%Upper
95% Intercept -5.93738 4.215727 -1.40839 0.172992 -14.6803 2.805515 DIV -9.92559 4.29679 -2.31 0.030653 -18.8366 -1.01459 EPS 4.58389 2.33242 1.965293 0.06213 -0.25326 9.421038 OLDPR 1.447293 0.234317 6.176645 3.23E-06 0.961348 1.933237 NY 5.167893 3.349587 1.542845 0.137131 -1.77873 12.11452 BANK 1.277249 4.358177 0.29307 0.772216 -7.76107 10.31556 (a) Interpret the regression coefficients on NY and BANK. At the significance
level α=0.1, are NY and BANK significant?
(b) Look at the following residual plot in detail, and write up on what you found
from the plot.
2. Two objects of unknown weights and are weighed on an error-prone pan 1w 2w
balance (托盘天平) in the following way: (1) object 1 is weighed by itself, and the measurement is 3g; (2) object 2 is weighed by itself, and the result is 3g; (3) the difference of the weights (the weight of object 1 minus the weight of object 2) is measured by placing the objects in different pans, and the result is 1g; (4) the sum of the weights is measured as 7g. The problem is to estimate the true weights of the objects from these measurements.
(a) Set up a linear model in the form εβ+=Z y .
(b) Find the least squares estimates of and .
1w 2w (c) Find the estimate of .
2σ(d) Find the estimated standard errors of the least squares estimates of part (b). (e) Estimate and its standard error.
21w w ?(f)
Test the null hypothesis 210:w w H = at significance level 0.01. (g) Calculate
2R and explain what it means.
3. An experiment was performed to determine whether two forms of iron ( and
) are retained differently. The investigators divided 108 mice randomly into 6 groups of 18 each; 3 groups were given in three different concentration, 10.2, 1.2, and .3 millimolar (毫摩尔,是一种测量单位), and 3 groups were given at the same three concentrations. The initial amount given was measured; at a later time, another measurement was taken for each mouse, and the percentage of iron retained was calculated.
+2Fe +3Fe +2Fe +3Fe (2) How many factors are there? What are the levels for the factors?
(3) Suppose the output from some computer package is as follows:
Analysis of Variance Table Source df Sum of Squares Mean Squares F
Iron form ? 2.074 ? ?
Dosage ? 15.588 ? ?
Interaction ? 4.810 ? ?
Error ? 35.296 ?
(a) Please fill in the quantities for “?”.
(b) What are the three hypothesis tests involved with the F statistics? What
are your conclusions regarding these three tests?
(c) Explain in our context what it means for interaction to have nonzero
effect.
(d) What is the design matrix if we treat this ANOV A problem as a linear
regression problem?
4. Consider a four-way contingency table of size T S C R ×××. For i=1,…,R , j=1,…,C , k=1,…,S , and l=1,…,T , let denote the probability that an individual selected at random from a given population will fall into the (i,j,k,l ) cell of the table. Let
ijkl p ∑∑===S k T l ijkl ij p p 11..,
. ∑∑===R i C
j ijkl kl p p 11..On the basis of a random sample of n observations from the given population, construct a test of the following hypotheses:
H0: kl ij ijkl p p p ....= for all values of i , j , k , and l ,
H1: The hypothesis H0 is not true.
5. (1) The following table describes the probability distribution of genotypes
(基因型) and phenotypes (表现型) for certain population under some theory (the genotype A _ is a short-hand notion for either AA or Aa , and B _ is a short-hand notion for either BB or Bb ):
Genotype Phenotype Probability A_B_ black 9/16
A_bb black 3/16
aaB_ grey 3/16
aabb white 1/16
In order to test this theory, 200 observations are randomly sampled from the population and it is found that 160 are black, 34 are gray and 6 are white. Test the hypothesis that the probabilities for black, gray, and white are in a 12:3:1 ratio as predicted by the previous theory versus the alternative that they are different. State hypotheses, compute a test statistic, and find the p-value.
(2) In a different experiment, an observation is either short or tall and green or yellow.
Observed counts of 250 observations are
Color
Yellow
Height Green
Tall 165 25
Short 50 10
Test whether these two traits (特性) are independent of one another. State hypotheses, compute a test statistic, and find the p-value.