Energy consumption and CO2 emissionsin
Energy consumption and CO2emissions in China’s cement
industry:A perspective from LMDI decomposition analysis
Jin-Hua Xu a,Tobias Fleiter b,Wolfgang Eichhammer b,Ying Fan a,n
a Center for Energy and Environmental Policy Research,Institute of Policy and Management,Chinese Academy of Sciences,Beijing100190,China
b Fraunhofer Institute for Systems and Innovation Research,Karlsruhe76139,Germany
H I G H L I G H T S
c We analyze the energy consumption an
d CO2emissions in China’s cement industry.
c The growth of cement output is the most important driving factor.
c The ef?ciency policies an
d industrial standards signi?cantly narrowed th
e gap.
c Ef?ciency gains cannot compensate for the huge increase in cement production.
c The potentials of energy-saving of26%an
d CO2mitigation of33%exist based on BAT.
a r t i c l e i n f o
Article history:
Received14February2012
Accepted16August2012
Available online7September2012
Keywords:
Chinese cement industry
Energy ef?ciency
CO2emission
a b s t r a c t
We analyze the change of energy consumption and CO2emissions in China’s cement industry and its
driving factors over the period1990–2009by applying a log-mean Divisia index(LMDI)method.It is
based on the typical production process for clinker manufacturing and differentiates among four
determining factors:cement output,clinker share,process structure and speci?c energy consumption
per kiln type.The results show that the growth of cement output is the most important factor driving
energy consumption up,while clinker share decline,structural shifts mainly drive energy consumption
down(similar for CO2emissions).These ef?ciency improvements result from a number of policies
which are transforming the entire cement industry towards international best practice including
shutting down many older plants and raising the ef?ciency standards of cement plants.Still,the
ef?ciency gains cannot compensate for the huge increase in cement production resulting from
economic growth particularly in the infrastructure and construction sectors.Finally,scenario analysis
shows that applying best available technology would result in an additional energy saving potential of
26%and a CO2mitigation potential of33%compared to2009.
&2012Elsevier Ltd.All rights reserved.
1.Introduction
Currently,China is the largest cement-producing and
consuming country in the world.Cement production in China
was 1.87billion metric tonnes in2010(CMIIT,2011),which
accounts for about57%of global cement production(USGS,2011).
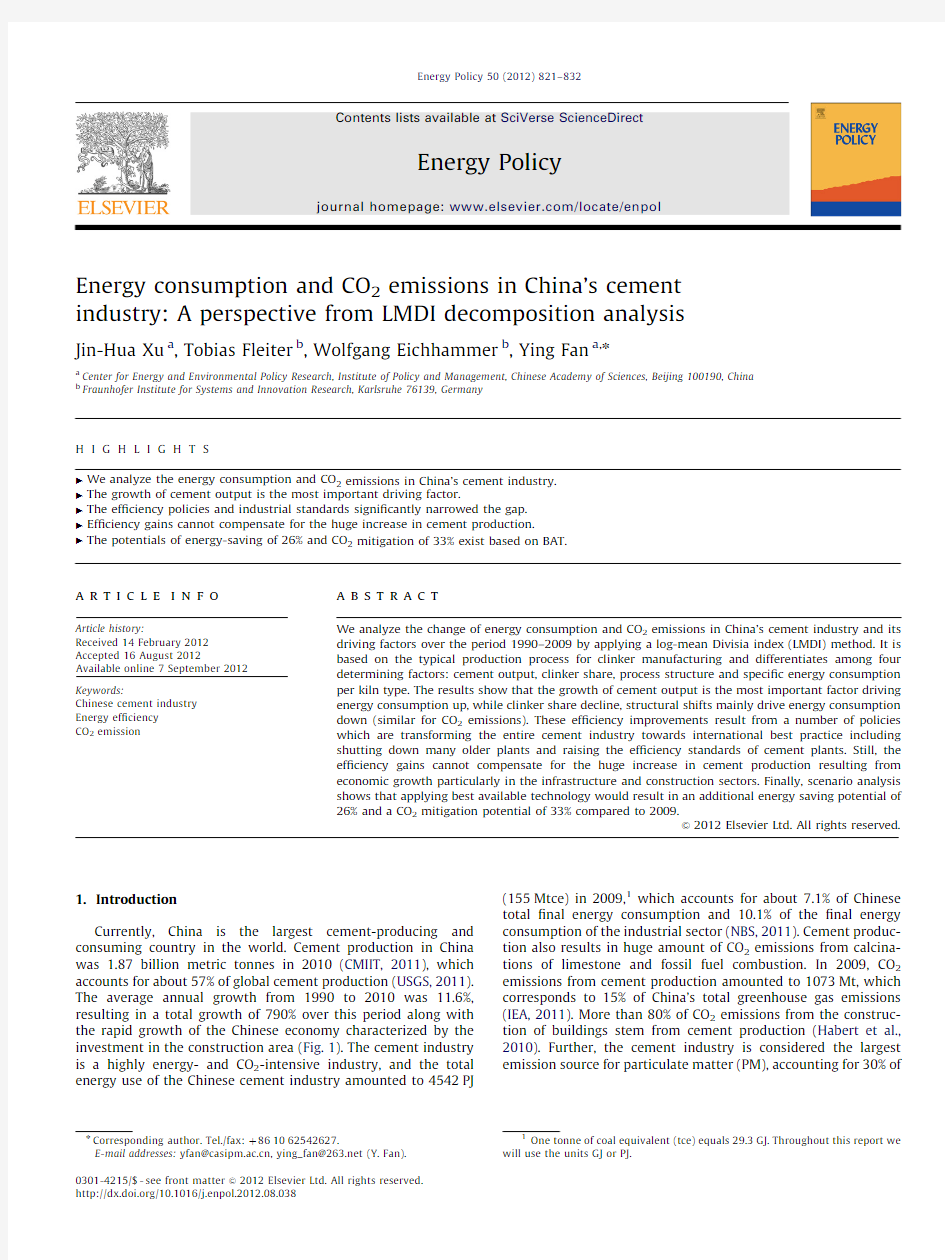
The average annual growth from1990to2010was11.6%,
resulting in a total growth of790%over this period along with
the rapid growth of the Chinese economy characterized by the
investment in the construction area(Fig.1).The cement industry
is a highly energy-and CO2-intensive industry,and the total
energy use of the Chinese cement industry amounted to4542PJ
(155Mtce)in2009,1which accounts for about7.1%of Chinese
total?nal energy consumption and10.1%of the?nal energy
consumption of the industrial sector(NBS,2011).Cement produc-
tion also results in huge amount of CO2emissions from calcina-
tions of limestone and fossil fuel combustion.In2009,CO2
emissions from cement production amounted to1073Mt,which
corresponds to15%of China’s total greenhouse gas emissions
(IEA,2011).More than80%of CO2emissions from the construc-
tion of buildings stem from cement production(Habert et al.,
2010).Further,the cement industry is considered the largest
emission source for particulate matter(PM),accounting for30%of
Contents lists available at SciVerse ScienceDirect
journal homepage:https://www.360docs.net/doc/c511827738.html,/locate/enpol
Energy Policy
0301-4215/$-see front matter&2012Elsevier Ltd.All rights reserved.
https://www.360docs.net/doc/c511827738.html,/10.1016/j.enpol.2012.08.038
n Corresponding author.Tel./fax:t861062542627.
E-mail addresses:yfan@https://www.360docs.net/doc/c511827738.html,,ying_fan@https://www.360docs.net/doc/c511827738.html,(Y.Fan).
1One tonne of coal equivalent(tce)equals29.3GJ.Throughout this report we
will use the units GJ or PJ.
Energy Policy50(2012)821–832
total industrial particulate matter emissions in 2009in China (CMIIT,2010).
Given the high importance of the cement industry with respect to energy consumption and greenhouse gas (GHG)emissions in China,cement production is increasingly the focus of energy ef?ciency and climate policies.In order to design ef?cient policies,knowledge about the in?uencing factors and their impacts on energy consumption and GHG emissions over time is required.
Energy ef?ciency in the Chinese cement sector has been inten-sively discussed in literature.Some studies focused either on the comparison of energy-ef?ciency policies (Price et al.,2001)or the cost of new technology and barriers to technical renovation (Liu et al.,1995)from an economic perspective,while other literature focused on retro?t measures,estimated conservation supply curves and energy-saving potentials from an engineering point of view (Li,2004;Lei et al.,2011;Worrell et al.,2008;Zeng,2006,2008).Hasanbeigi et al.(2010)compared the energy use of Chinese companies with international best practice and measured the average technical energy-saving potentials and costs for 16cement plants in China.The increase of energy use observed in this study results in an important increase in CO 2emissions.By estimating the CO 2emissions from the cement industry in China,Lei et al.(2011)showed that replacing old shaft kilns by pre-calciner kilns and improving energy ef?ciency can effectively reduce CO 2emissions.Cui and Liu (2008)found a huge CO 2mitigation potential in China’s cement industry resulting from calcinations of limestone,coal combustion and electricity consumption,respectively.
Most studies discussing energy use or CO 2emissions in China’s cement industry either focus on a speci?c year or on the overall industry level.Thus,they are not able to draw conclusions on the impact of different factors on the development of energy demand
and CO 2emissions over time.Furthermore,the industry-wide studies hardly take the particular structure of a sector like the cement industry into consideration.
In this paper,we analyze the determinants of energy consumption and consequent CO 2emissions in China’s cement industry over the period from 1990to 2009,based on a log-mean Divisia index (LMDI)method.Furthermore,the role of technical energy-ef?ciency standards in China since 2007is discussed,and an outlook of future energy consumption and CO 2emissions under different scenarios is performed according to best available technology (BAT).Finally,we discuss the observed developments in the light of energy-ef?ciency policies introduced in China in the considered time period.
Such a decomposition analysis can improve the foundation for energy-ef?ciency and CO 2mitigation policies as it reveals the contributions of different factors to the development of energy demand and CO 2emissions.The estimation of future potentials for energy conservation and CO 2mitigation further helps to identify areas of interest for such policies.
This paper is organized as follows.Section 2gives a brief overview of cement technologies used in China;Section 3describes the LMDI method used in the analysis and the data;Section 4contains the results and the discussion of the ?ndings;Section 5extends the results by an outlook on remaining energy and CO 2saving potentials,and Section 6concludes our analysis.
2.Cement production technology in China 2.1.Cement kiln types
The cement industry production chain can be divided into four stages,from original clinker manufacturing via cement and concrete production to end use of concrete (see Fig.2).
-80%
-60%-40%-20%0%20%40%60%80%100%120%0
200400600800100012001400160018002000195019531956195919621965196819711974197719801983198619891992199519982001200420072010
Growth Rate (%)
C e m e n t O u t p u t (M i l l i o n m e t r i c t o n n e s )
Year
Fig.1.Cement output and growth rate in China.
Sources :Chinese Cement Almanac (2009)and National Bureau of Statistics of China (2011).
Fig.2.Production chain in the cement industry.
200
4006008001000
1200140016001800
2000 C e m e n t p r o d u c t i o n (M i l l i o n m e t r i c t o n n e s )
Year
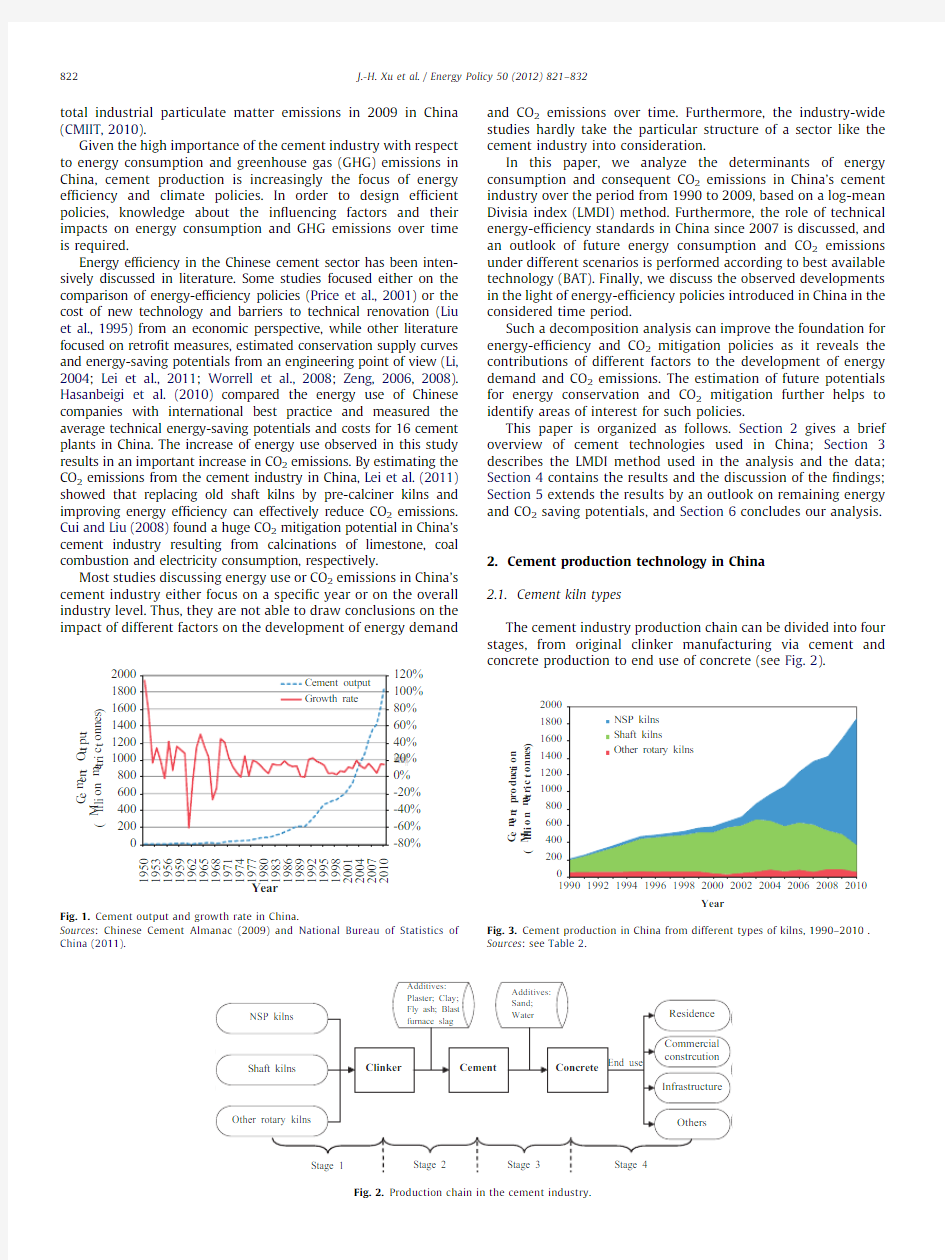
Fig.3.Cement production in China from different types of kilns,1990–2010.
Sources :see Table 2.
J.-H.Xu et al./Energy Policy 50(2012)821–832
822
We focus on the ?rst two stages in Fig.2and distinguish between three types of key kilns for clinker manufacturing:i.e.,dry rotary kilns that have new suspension pre-heaters or pre-calciners (NSP kilns),shaft kilns and other rotary kilns (including wet kilns,lepol kilns,hollow kilns)which have different speci?c energy consumption (SEC).
Two groups of clinker kilns are most dominant in China (the ?rst stage in Fig.2):shaft (vertical)kilns and rotary kilns.2In the period before 2000,shaft kilns dominated and accounted for more than half of clinker production in the cement industry.After 2000,the advanced NSP kilns as a modern rotary kiln process developed quickly and started to dominate the cement industry in China,as shown in Fig.3.
The Chinese government policy aims to phase out the obsolete shaft kilns and to replace them with modern rotary kilns by the end of 12th Five Year Plan.Therefore in recent years NSP kilns have been widely used (Fig.3).The proportion of cement production from NSP kilns rose from 12%in 2000to 80%in 2010(Sui,2009;CMIIT,2011).There are 241new NSP cement lines with a capacity greater than 4000t per day in China in 2008(Lei,2009).In addition,the SEC of NSP kilns are 20%lower than that of shaft kilns in China (CBMN,2010).
2.2.Clinker additives
For a given strength of cement type,replacing energy-intensive clinker with additives (?y-ash,plaster,clay,etc.)can effectively reduce energy use and CO 2emissions in cement production.Typically,a lower clinker share also reduces cement quality,imposing a minimum need for clinker.The increased use of NSP kilns raised clinker quality,so that less clinker was required to manufacture a given strength of cement.Therefore NSP kilns allow a lower clinker to cement ratio (clinker share)than shaft kilns.The clinker share in China has declined con-stantly from 75%in 1990to 62%in 2010(see Fig.4).
2.3.The use of waste for clinker production
The use of waste –as a substitute for coal –also plays an important role in reducing the use of fossil fuels and CO 2emissions.Currently,the use of waste as an alternative fuel (AF)for clinker calcinations is increasing in the global cement industry.The share of
industrial waste for clinker calcinations has reached more than 30%in Germany,Switzerland and France (Zeng,2006).
In China,although currently a few cement plants have begun to use solid waste as a fuel in kilns,the use of waste is mainly focused in plants close to large cities and still very limited.The wastes mainly used in China are coal gangue 3and industrial waste.In 2006,about 2.36million tonnes of coal gangue and 3.81PJ of industrial waste were burned as fuel in China’s cement industry.This produced total energy savings of 16.12PJ and just accounted for 0.42%of the total energy consumption of the cement industry (Zhou,2007).For this reason,this factor is neglected in the historic analysis,whereas it is included in the analysis of future CO 2mitigation potentials in Section 5.3.
3.Methodology and data sources 3.1.Methodology
In order to analyze the relative contribution of factors in?uen-cing energy consumption and related CO 2emissions in the cement industry,we use an index decomposition analysis.Since the 1980s,index decomposition analysis has been developed and applied widely,and many different decomposition methods were proposed (Ang et al.,2000).In the past decade,the arithmetic mean Divisia index and the Laspeyres methods were the two most often used methods.Ang (2004)compared various decom-position methods and argued that the log-mean Divisia index (LMDI)analysis was the preferred method due to its theoretical foundation,adaptability,ease of use and transparency in the interpretation of results.These results are con?rmed by Cahill and
Gallacho
′ir (2010),who evaluated ?ve decomposition methods and also found support for LMDI.It was applied in several energy and environmental studies,such as industrial CO 2emissions in China (Liu et al.,2007),CO 2emissions in Greece (Hatzigeorgiou,2008),US manufacturing energy consumption (Ang and Liu,2007)and energy consumption and CO 2emissions in Mexico’s iron and steel industry (Sheinbaum et al.,2010).We also use the LMDI approach for our analysis.
Cement is produced by mixing ground clinker with additives.Energy consumption in cement production mainly consists of three parts:(i)the thermal energy consumed in the calcination process of clinker manufacturing;(ii)the electricity consumption in the process of clinker manufacturing;(iii)the thermal energy consumed for drying additives (slag powder)as well as the electricity consumption in the cement manufacturing process.Therefore,we distinguish the total ?nal energy consumption according to the clinker manufacturing process and ancillary processes for cement manufacturing (stages 1and 2in Fig.2).4
E t ?X i
E clin ker ,i ,t tE anc ,t ?X i
eSEC thermal ,i ,t t0:0036?SEC ele àclin ker ,i ,t T
?Q clin ker ,i ,t tE anc ,t
e1T
Note:the factor 0.0036assures the conversion from kW h/t clinker to GJ/t clinker.
The de?nition of variables can be found in Table 1.
0%
10%20%30%40%50%60%70%80%90%
C l i n k e r s h a r e (%)
Year
Fig.4.Clinker share in cement industry from 1990to 2010.
Sources :China Cement Association (2010);National Bureau of Statistics of China (2011).
2
There are many variations of both types of kilns in China.
3
Coal gangue is the associated industrial solid residues which are discharged when coal is excavated and washed in the production process of coal mines,it contains 20–30%carbon,and is one of the most plentiful industrial solid castoffs in China.
4
Here,the calculation of clinker output includes the exported clinker,which could lead to under-or overestimation of the clinker share effect .However,as the share of exported clinker ranged between 0.27%in 1995and 1.31%in 2008(China Cement Association,2010),the error is negligible.
J.-H.Xu et al./Energy Policy 50(2012)821–832823
For the decomposition,we explicitly consider the following four factors.
1)The activity effect :total cement production (abbreviation:act ).
2)The structural shift effect :share of different kiln types with different SEC in the entire stock of kilns (abbreviation:str ).3)The clinker share effect :substituting cement clinker by (less energy-and CO 2-intensive)additives (?y-ash,plaster,clay,etc.)reduces the demand for clinker and consequently the total energy demand for cement production (abbreviation:sha ).
4)The kiln ef?ciency effect :the thermal SEC per kiln type (abbreviation:eff ).To consider the entire energy demand in the cement industry,we add the thermal energy consumed for drying additives as well as the electricity consumption for the grinding of clinker in the cement manufacturing stage (ancillary process,abbreviation —anc ).
The resulting decomposition formula can be written as fol-lows:E t ?
X
i
E clin ker ,i ,t tE anc ,t ?
X
i
Q cement ,t
Q clin ker ,t cement ,t Q clin ker ,i ,t clin ker ,t E clin ker ,i ,t
clin ker ,i ,t
tE anc ,t
e2T
We use the LMDI additive decomposition method for the analysis.We brie?y describe the LMDI approach but refer to Ang et al.(2003)for a more detailed description.The equation D E tot ?E t àE 0is used to calculate the total change of energy consumption for the year t compared to the base year 0.We apply the ‘‘non-changing’’decomposition analysis by using the data of the base year and the end year of the study period.L (x ,y )is the logarithmic mean of two positive numbers L (x ,y )?(y àx )/ln(y /x )and is a weighting coef?cient.Let w i ,0?E clin ker ,i ,0=E clin ker ,0,w i ,t ?E clin ker ,i ,t =E clin ker ,t ,w 0i ,0?E anc ,i ,0=E anc ,0,w 0i ,t ?E anc ,i ,t =E anc ,t .The equation can be further expressed as the contributions of differ-ent factors using LMDI:
D E tot ?D E act tD E sha tD E str tD E ef f tD E anc
e3T
where
D E act ?
P i L ew i ,0,w i ,t TP j j ,0j ,t L eE clin ker ,0,E clin ker ,t Tln Q cement ,t
Q cement
,0
D E sha ?
X i
L ew i ,0,w i ,t TP j L ew j ,0,w j ,t TL eE clin ker ,0,E clin ker ,t Tln Q clin ker ,t =Q cement ,t
Q clin ker ,0=Q cement ,0 D E str ?
X i
L ew i ,0,w i ,t TP j j ,0j ,t L eE clin ker ,0,E clin ker ,t Tln Q clin ker ,i ,t =Q clin ker ,t
clin ker ,i ,0clin ker ,0 D E ef f ?
X i
L ew i ,0,w i ,t TP j L ew j ,0,w j ,t TL eE clin ker ,0,E clin ker ,t Tln E clin ker ,i ,t =Q clin ker ,i ,t
E clin ker ,i ,0=Q clin ker ,i ,0 D E anc ?X L ew 0i ,0,w 0i ,t T
P j L ew 0j ,0,w 0
j ,t T
L eE anc ,0,E anc ,t Tln eE anc ,t =E anc ,0TIn the following,the method used for CO 2emissions is described.Total CO 2emissions of cement production are mainly due to the use of fossil fuels in clinker calcinations,the calcina-tions of limestone and electricity consumption in the cement production,which could be summarized as the fuel-related CO 2emissions,process-related CO 2emissions and electricity-related CO 2emissions,and are estimated using the IPCC methodology (Intergovernmental Panel on Climate Change,2006).
C t ?
X
i
eCEF f uel ?SEC thermal ,i ,t ?Clin ker ratio ,i ,t T?Q cement ,i ,t tX
i eCEF pro ?Clin ker ratio ,i ,t T?Q cement ,i ,t
tX i
Q cement ,i ,t ?SEC ele àcement ,i ,t ?CEF ele ,t
?
X
i
C F ,i ,t tX
i
C P ,i ,t t
X
i
C E ,i ,t
e4T
The de?nition of variables can be found in Table 1.
Currently in China the main fuel used in kilns is coal,and other fuels such as gas and petrol coke are rarely used,so for fuel combustion we only consider the CO 2emissions from coal combustion (Cui and Liu,2008).For the CO 2emission factors CEF fuel and CEF pro ,we adopted the method recommended by Intergovernmental Panel on Climate Change (2006).Their esti-mates were 92.8kg CO 2/GJ from coal combustion,and
Table 1
De?nition of variables.Variable De?nition
Unit
i
i ?1,2,3refer to the three kiln types:(1)NSP kilns,(2)other rotary kilns (including wet kilns,lepol kilns,hollow kilns),(3)shaft kilns None
SEC thermal ,i ,t Thermal SEC of kiln type i in year t
GJ/t clinker SEC ele -clin ker ,i ,t Average electricity intensity of kiln type i for clinker production in year t ,which is calculated by a conversion factor of electricity intensity per tonne of cement shown in Table 3(Zhou,2007)kW h/t clinker SEC ele -cement ,i ,t Average electricity intensity of kiln type i for cement production in year t kW h/t cement Clin ker ratio ,i ,t Clinker share of kiln type i in year t
t clinker/t cement CEF fuel CO 2emission factor from fuel burning process.As coal is exclusively used,no distinction between fuel types is necessary.The impact of waste fuels is still very limited (see the discussion in Section 2.3)t CO 2/GJ CEF pro CO 2emission factor for the calcinations of limestone (process emissions)t CO 2/t clinker CEF ele ,t Carbon emission factor for electricity in year t t CO2/kW h Q cement ,t Total cement output in year t
Mt Q cement ,i ,t Cement output of kiln type i in year t Mt Q clin ker ,t Total clinker output in year t
Mt Q clin ker ,i ,t Clinker output of kiln type i in year t
Mt E t
Total ?nal energy consumption in China’s cement industry in year t
GJ E clin ker ,i ,t Total ?nal energy consumption of kiln type i for clinker manufacturing in year t
GJ E anc ,t Total ?nal energy consumption of ancillary process for cement manufacturing in year t ,including thermal consumption for drying additives and electricity consumption for the grinding of clinker in the cement manufacturing stage GJ C t Total carbon emissions from the clinker manufacturing process
Mt CO 2C F ,i ,t Carbon emissions from the fuel burning during clinker manufacturing (fuel-related emissions:carbon-based fuels for heating)Mt CO 2C P ,i ,t Carbon emissions from the chemical reaction during clinker manufacturing (process emissions:calcinations of limestone)Mt CO 2C E ,i ,t
Carbon emissions from electricity consumption
Mt CO 2
Note :GJ ?Giga Joule;Mt ?Million metric tonnes.
J.-H.Xu et al./Energy Policy 50(2012)821–832
824
550kg CO 2/t clinker from the calcinations of limestone.The values for other variables are shown in Tables 2and 3.
Similar to energy consumption,the decomposition of CO 2emissions can be expressed as:
C t ?
X i
Q cement ,t Q clin ker ,t cement ,t Q clin ker ,i ,t clin ker ,t CEF f uel E clin ker ,i ,t
clin ker ,i ,t t
X i
Q cement ,t Q clin ker ,t Q cement ,t CEF pro ,i Q clin ker ,i ,t
Q clin ker ,t
tX
i
Q cement ,t
Q cement ,i ,t
cement ,t
SEC ele àcement ,i ,t CEF ele ,t
e5T
where in addition to the energy components shown in Eq.(2),CEF f uel eE clin ker ,i ,t =Q clin ker ,i ,t Trepresents the energy ef?ciency of kiln i .and CEF pro ,i eQ clin ker ,i ,t =Q clin ker ,t Trepresents the clinker structure factor.
As to CO 2emission changes,they are composed of the sum of changes in fuel-related CO 2emissions (C F )comprising the sum of
activity effect ,clinker share effect ,structure effect ,kiln ef?ciency effect ,plus the changes in calcining process-related CO 2emissions (C P ),comprising the sum of activity effect (act_pro ),clinker share effect (sha_pro ),and kiln structure effect (str_pro ),and plus the changes in CO 2emissions related to electricity consumption in cement production (C E ),comprising the sum of activity effect (act_ele ),cement structure effect (str_ele ),electricity intensity effect (int_ele ),and electricity carbon emission factor effect (CEF_ele ).Let v i ?C F ,i /C F ,v 0i ?C P ,i =C P ,v 00i ?C E ,i =C E ,and the equation is expressed as follows:
D C ?D C F tD C P tD C E
?eD C act tD C sha tD C str tD C ef f TteD C act _pro tD C sha _pro tD C str _pro T
teD C act _ele tD C str _ele tD C int_ele tD C CEF _ele Te6T
where
D C act ?
X i
L ev i ,0,v i ,t TP j j ,0j ,t L eC F ,0,C F ,t Tln Q
cement ,t
cement ,0D C sha ?
X i
L ev i ,0,v i ,t TP j L ev j ,0,v j ,t TL eC F ,0,C F ,t Tln Q clin ker ,t =Q cement ,t
Q clin ker ,0=Q cement ,0 D C str ?
X i
L ev i ,0,v i ,t TP j L ev j ,0,v j ,t TL eC F ,0,C F ,t Tln Q clin ker ,i ,t =Q clin ker ,t
Q clin ker ,i ,0=Q clin ker ,0 D C ef f ?
X i
L ev i ,0,v i ,t TP j j ,0j ,t L eC F ,0,C F ,t Tln CEF f uel eE clin ker ,i ,t =Q clin ker ,i ,t T
f uel clin ker ,i ,0clin ker ,i ,0 D C act _pro ?X i
L ev 0i ,0,v 0i ,t TP j L ev 0j ,0,v 0j ,t TL eC P ,0,C P ,t Tln Q cement ,t
Q cement ,0 D C sha _pro ?X i
L ev 0i ,0,v 0i ,t TP j L ev 0j ,0,v 0j ,t TL eC P ,0,C P ,t Tln Q clin ker ,t =Q cement ,t
Q clin ker ,0=Q cement ,0 D C str _pro ?X i
L ev 0i ,0,v 0i ,t TP j L ev 0j ,0,v 0j ,t TL eC P ,0,C P ,t Tln CEF i eQ clin ker ,i ,t =Q clin ker ,t T
CEF i eQ clin ker ,i ,0=Q clin ker ,0T D C act _ele ?X i
L ev 00i ,0,v 00i ,t TP j L ev 00j ,0,v 00j ,t TL eC E ,0,C E ,t Tln Q cement ,t Q cement ,0D C str _ele ?X i L ev 00i ,0,v 00i ,t TP j 00j ,000j ,t L eC E ,0,C E ,t Tln Q cement ,i ,t =Q cement ,t cement ,i ,0cement ,0 D C int_ele ?X i
L ev 00i ,0,v 00i ,t TP j L ev j ,0,v j ,t TL eC E ,0,C E ,t Tln SEC ele àcement ,i ,t SEC ele àcement ,i ,0D C CEF _ele ?
X i
L ev 00i ,0,v 00i ,t TP j L ev 00j ,0,v 00j ,t TL eC E ,0,C E ,t Tln
CEF ele ,t
CEF ele ,03.2.Data sources
As no single available source provides all time-series data needed,we rely on several statistical sources.The total cement production as time series from 1990to 2010is available from the China Cement Association (2010)and CMIIT (2011).The data of total clinker production stems from the China Cement Associa-tion 5and relevant literature survey (Kong,2005;Li,2004;Lei,2009;Wu,2009;Xiong et al.,2004;Zeng,2006etc.),as shown in Table 2and Fig.3.
We estimate energy consumption based on the historical production and energy ef?ciency data of typical kilns.In China,energy ef?ciency in the cement industry has improved signi?-cantly in the last two decades.The thermal SEC for cement fell from 5.74GJ/t in 1990to 4.75GJ/t in 2000(Xiong et al.,2004),and reached 2.78GJ/t in 2009(Lei,2010).SEC for electricity per
Table 3
Energy consumption in China’s cement industry,1990–2010.Year
SEC for fuels (GJ/t clinker)a
SEC for electricity
(kW h/t cement)b
Overall SEC (GJ/t cement)
c
Total energy consumption (PJ)d
NSP kilns Shaft kilns
OR kilns NSP kilns Shaft kilns OR kilns 1990 3.66 4.72 5.86114105120 5.7412011995 3.60 4.54 5.6511498118 5.1324322000 3.57 4.40 5.4211295116 4.7528422005 3.55 4.22 5.229993110 3.7239852008 3.34 4.07 5.079591108 3.0543072009 3.31 4.04 4.959590105 2.7845422010
3.28
4.01
4.89
93
90
102
2.70
5040
a
SEC for fuels by kiln —in1990and 2000(Xiong et al.,2004),in 1995(Lei et al.,2011),in 2005–2010(Zhou,2007;NDRC,2011;Zeng,2006;Sui,2009;Lei et al.,2011).
b
SEC for electricity —in 1995(Zeng,2006),2000(Soule et al.,2002;Li,2004),in 2005(Zhou,2007),in 2005and 2010(NDRC,2011),in other years (authors’estimate).
c
Total SEC (including fuels and electricity consumption of stages 1and 2in Fig.2)—in 1990and 2000(Xiong et al.,2004),in 1995(Zeng,2006),in 2005(Zeng,2008),in 2008–2009(Lei,2010),in 2010(authors’estimate according to reduction ratio of 2009).
d
Total energy consumption (including fuels and electricity consumption)are calculated by comprehensive energy intensity and cement production,which are consistent with government’s report (Sui,2010;CMIIT,2010;etc.).
Table 2
Cement and clinker production in China’s cement industry,1990–2010.Year
Clinker production (Mt)c
Cement production (Mt)
d
NSP kilns a Shaft kilns
OR kilns b Total NSP kilns Shaft
kilns OR kilns Total
19907111391571014951210199519271533432938562476200055336634547245867597200529841750765474534611069200861831247977895436891420200971728639104311294158616302010
82029438
11521494
318
56
1868
a
NSP kilns:new rotary suspension preheater,precalciner kilns.b
OR kilns:other rotary kilns.c
Source :Clinker production —in 1990and 2000(Xiong et al.,2004),in 1995(authors’estimate according to clinker capacity (Zeng,2006)),in 2000(Xiong et al.,2004),in 2005–2010(Digital Cement Net;CMIIT,2011;Chinese Cement Almanac (2009)).
d
Source :Cement production —in 1990(Liu et al.,1995),in 1995and in 2000(Li,2004;Lei and Zhang,2009;NDRC,2006),in 2005(Zeng,2006;Wu,2009),in 2008(Lei and Zhang,2009),in 2009–2010(CMIIT,2010,2011).
5
Digital Cement Net is the of?cial website of China Cement Association.URL:https://www.360docs.net/doc/c511827738.html,/.
J.-H.Xu et al./Energy Policy 50(2012)821–832825
tonne of cement of NSP kilns fell from 99kW h in 2005to 89kW h in 2010,a drop of 9.8%(NDRC,2011).
The thermal SEC of NSP kilns dropped from 3.66GJ/t clinker in 1990to 3.28GJ/t clinker in 2010(NDRC,2011),while the SEC of shaft kilns dropped from 4.72GJ/t clinker in 1990(Xiong et al.,2004)to 4.22GJ/t clinker in 2006(Zhou,2007)6.Despite this improvement,the total energy consumption for cement produc-tion increased from about 1201PJ in 1990(Liu et al.,1995)to 2842PJ in 2000(Zeng,2006),and reached 4542PJ in 2009(Lei,2010;CMIIT,2010).The data of electricity carbon emission factor CEF ele ,t is from Enerdata (2012).
Based on this SEC and production output information,the historical total energy consumption is estimated and further broken down into the three types of kilns according to corre-sponding SEC for fuel and electricity (Fig.5).
Relying on several different data sources might result in pro-blems if these use different system boundaries or de?nitions.As far as some production data and SEC data are concerned,the different sources are not always completely consistent.Given this situation,we ?rst took data from the literature review from the China Cement Association,7and when otherwise not available,we complete the time-series data with the data from other literature.Some SEC data for single years are estimated according to other literature (Liu et al.,1995;Lei et al.,2011).Despite this uncertainty,the resulting time-series data set is judged suf?ciently robust for the analysis and shows no unexplainable outliers or peaks.
4.Empirical results and discussions 4.1.Determinants of energy consumption
4.1.1.Overview of results
As shown in Table 4and Fig.6,the energy use in China’s cement industry increased by 3340PJ from 1990to 2009.The substantial growth in cement production (activity)was the main driving factor behind this rise in energy demand.The activity effect would have increased energy consumption by 4131PJ,which raises energy consumption by 344%.
The main factors driving the decline of energy consumption in the whole period were the clinker share,structural shifts between kiln types and the kiln ef?ciency improvement,which reduced energy consumption by 26.6%,30.0%and 24.6%,respectively.The total clinker share in China’s cement industry has reached 64%in 2009,a reduction of 14.7%compared to 1990.Likewise,kiln ef?ciency improvement and structural shifts have reduced energy use by 296PJ and 360PJ,respectively,until 2009.
Thus,energy demand during the period 1990–2009is driven by enormous growth of cement production,which is far from being offset by energy-ef?ciency improvements in terms of clinker share,kiln type shift or kiln ef?ciency.
4.1.2.The impact of cement industry output (activity)
The rising cement production is by far the most important factor driving energy consumption upwards.As shown in Table 4,the activity effect played an increasingly important role in the upsurge of energy consumption in China’s cement industry,especially after 2000.Main drivers behind the rising production are the market reform of real estate –beginning in 1998–and a dynamic development of the Chinese economy linked to an extensive infrastructure expansion.During this period,cement production increased from 597Mt to 1630Mt in 2009,at a growth rate of 11.8%per year (Table 2).
For a developing country with high economic growth like China,the rapid expansion of infrastructure is a necessary consequence –to a given extent –of the economic catching-up with more developed countries.The demand for cement products mainly stems from the building industry and infrastructure investment,which greatly boost the development of the Chinese economy (Lei,2009).But this large demand for cement is unsustainable in the long term,and currently there has been plenty of spare production capacity sitting idle,so redundant construction of cement plants with low technology standards are gradually being suppressed (CMIIT,2009).Therefore the impact of cement output on energy consumption may decrease gradually in the future 8.
4.1.3.The impact of clinker share
The clinker share played a more and more important role in the decline of energy consumption in the cement industry since 1990(Table 4).Only during the period 1995–2000is a rising clinker share observed,resulting from the increased use of shaft kilns which had a higher clinker share than NSP kilns.During this period the clinker share rose from 72.1%to 76.1%and conse-quently drove up energy consumption (Fig.4).
The decline of clinker share could be attributed to technology improvement by kiln type,on the one hand,and to the rise of the proportion of NSP kilns since 1990,on the other hand.Since the Chinese government launched and implemented a series of policies supporting NSP kilns (NDRC,2006;etc.),the NSP kilns gradually became the dominant kiln type.Two important examples are the policy of ‘‘restriction,elimination,transformation and improvement’’guidelines in 1995and ‘‘gross control and structure adjustment’’in the cement industry in 1999(NBMB,1999).The former aimed to prevent the redundant construction of cement plants with low technology standards,and eliminate the small-scale cement plants and outdated kiln technologies.The latter aimed to carry out technical renovation to outdated kilns by adopting the more modern NSP process on the premise of controlling the total cement output.
100020003000400050006000
E n e r g y c o n s u m p t i o n ( P J )
Year
Fig.5.Energy consumption of cement production in China by kiln type,1990–2010.
6
Shaft kilns are less ef?cient than other kiln types;their share reached 80%in the late 1990s,when China’s government started to gradually eliminate shaft kilns,beginning with the technologically most backward plants,and continually enhanced the technical standards of plants (NBMB,1999).This indirectly also improved the average SEC of shaft kilns.
7
The results are from the literature survey of the China Cement Association.URL:https://www.360docs.net/doc/c511827738.html,/.
8
The per capita production of cement in 2010in China was 1.34t/capita,while among the 20largest cement producers worldwide the per capita con-sumption varies between around 0.2for the US and India,up to around 1t/capita for South Korea,Spain or Iran.This indicates that the per capita production of China by far exceeds the present level of other countries and may have reached saturation level.
J.-H.Xu et al./Energy Policy 50(2012)821–832
826
The use of NSP kilns raised clinker quality,so that less clinker was required to manufacture a given strength of cement,which made a reduction of the clinker share possible.Therefore,the clinker share effect is partly related to the structural shift in kiln types.
Further,the implementation of a new standard for cement production allowed the production of cement products with lower clinker shares.The new cement standard GB175-1999,which was in line with international practice for the?rst time,was formulated in 1999,and came into effect on April1,2001.The new standard raised the requirement for the activity and?neness of clinker,which signi?cantly raised the clinker quality,and?nally reduced the clinker share(Yao and Wang,2003).During the period2000–2009,the clinker share effect reduced energy consumption by20.3%(2000as base year),far higher than that of period1990–2000,which only reduced energy consumption by4.6%(1990as base year).Compared to the other major cement-producing countries,the current clinker share in China’s cement industry seems relatively low.The clinker share in China declined from72%in2005to64%in2009,while the clinker share in India was about87%and the world average level was 82%in2005(IEA,2007).Depending on the quality requirements for cement and the production technology,a minimum share of clinker is required and the remaining energy-saving potential is relatively limited.94.1.4.The impact of the kiln type structure
The process of structural adjustment in China’s cement indus-try started in1995,but showed signi?cant effect only after1999 (Lei et al.,2009)as the result of policy(NBMB,1999)shown in Fig.3.The structure effect played an increasingly important role in declining energy consumption after2000,when China’s cement industry entered a structural adjustment period(Zeng,2005),and the Chinese government provided incentives to adjust the process structure by shutting down small-scale cement plants with low ef?ciency and outdated technology as discussed in Section4.1.3. Finally,the structure effect reduced energy consumption by6.3% and5.9%,respectively,during the periods2000–2005and2005–2009,far higher than that of other periods.
The share of cement production from NSP kilns exceeded the share of shaft kilns for the?rst time in2006,and reached69% market share in2009.This resulted in energy savings of234PJ during the period2005–2009.In the future this replacement process may further continue at the expense of the remaining shaft kilns,but most of the production capacity has already been replaced.
4.1.
5.The impact of changes in SEC per kiln type
Changes in SEC were a major factor in reducing energy consumption in the cement industry over the period1990–2009.In the whole period,it lowered energy use by296PJ (24.6%).
The role of kiln ef?ciency improvement in the decline of energy consumption was relatively stable until2006when the Chinese government formulated the‘‘Special Development Plan for the Cement Industry’’as a part of11th Five Year Plan(NDRC, 2006).The plan aimed to improve energy ef?ciency and produc-tion structure,and set a target for reducing energy consumption per unit of GDP by20%until2010compared to2005.Meanwhile, the overall target was allocated by province as the binding regulation for local economic development.From then on,as assessed by Price(2011),China has made substantial progress and many of the energy-ef?ciency programs appear to be on track to meet or even exceed their energy-saving targets,and among them the cement industry is one of the targeted sectors.The results of the LMDI analysis per period also con?rm this?nding and show that the kiln ef?ciency effect reduced energy use by6.3% during the period2005–2009,far higher than that during other periods.
Table4
Decomposition results:Impact of different factors on the changes in energy consumption in the cement industry in China,1990–2009.
Factor Variable1990–20091990–19951995–20002000–20052005–2009
PJ
Actual change D E tot333712363931146563
Activity D E act4143100244015821544 Clinker share D E shaà319à50103à167à410 Structural shift D E strà360à29à29à179à234
Kiln ef?ciency D E effà296à47à64à44à252 Ancillary processes D E anc173357à50à44à88
%
Actual change D E tot277.1102.616.140.414.1
Activity D E act343.983.217.955.738.9
Clinker share D E shaà26.6à4.0 4.2à5.8à10.3 Structural shift D E strà30.0à2.3à1.2à6.3à5.9
Kiln ef?ciency D E effà24.6à3.8à2.7à1.5à6.3 Ancillary processes D E anc14.329.7à2.1à1.6à2.2
Fig. 6.Energy consumption decomposition results:contributions of different
factors,1990–2009.
9The data are estimated according to historical average ratio(1.13)of energy
use per tonne of clinker and energy use per tonne of cement in2000–2004.
URL:http://www.jcassoc.or.jp/cement/2eng/eh1.html.
J.-H.Xu et al./Energy Policy50(2012)821–832827
4.2.Determinants of CO 2emissions
In order to analyze the changes in CO 2emissions,we distin-guish CO 2emissions from fuel consumption,from the calcining process and indirect CO 2emissions from electricity consumption.From 1990to 2009CO 2emissions in China’s cement industry increased from 187Mt in 1990to 1073Mt in 2009.Table 5and Fig.7show the changes in CO 2emissions for this period.For CO 2emissions from fuel use,the clinker share effect drove emissions down by 14.8%,except for 1995–2000where the clinker share rose and led to the increase of CO 2emissions.Structural shift effect of kiln type and kiln ef?ciency improvement drove emissions down by 17.1%and 13.3%,respectively.The emission coef?cient of fuel hardly impacted CO 2emissions because China mainly used hard coal throughout the period analyzed and only marginal shares of alternative fuels.
Table 5
Decomposition results:Impact of different factors on the changes in CO 2emissions in cement industry in China,1990–2009.Factor
Variable
1990–2009
1990–1995
1995–20002000–2005
2005–2009
Mt CO 2
Actual changes 885.9
211.8105.4320.2248.4From fuel Activity
D C act 358.186.637.8136.5133.7Clinker share D C sha à27.7à4.29.0à14.3à35.4Structural shift D C str à32.0à2.5à2.7à15.8à20.8Kiln ef?ciency D C eff à24.8à3.8à5.6à3.7à21.2From process Activity
D C act_pro 528.0107.449.4190.9208.1Clinker share D C sha_pro à40.9à5.211.7à20.0à55.1Structural shift D C str_pro 0.00.00.00.00.0From electricity Activity
D C act_ele 151.335.014.651.756.0Structural shift
D C str_ele 1.0à0.70.4 2.1 1.8Electricity intensity D C int_ele à11.7à2.3à1.8à4.7à5.1Carbon emission factor
D C CEF_ele
à15.3
1.6
à7.3
à2.6
à13.6
%
Actual changes 474.4
113.426.463.530.1From fuel Activity
D C act 191.746.49.527.116.2Clinker share D C sha à14.8à2.3 2.2à2.8à4.3Structural shift D C str à17.1à1.3à0.7à3.1à2.5Kiln ef?ciency D C eff à13.3à2.0à1.4à0.7à2.6From process Activity
D C act_pro 282.757.512.437.925.2Clinker share D C sha_pro à21.9à2.8 2.9à4.0à6.7Structural shift D C str_pro 0.00.00.00.00.0From electricity Activity
D C act_ele 81.018.7 3.710.3 6.8Structural shift
D C str_ele 0.5à0.40.10.40.2Electricity intensity D C int_ele à6.3à1.2à0.4à0.9à0.6Carbon emission factor
D C CEF_ele
à8.2
0.9
à1.8
à0.5
à1.7
Fig.7.CO 2emission decomposition results:contributions of different factors,1990–2009.
J.-H.Xu et al./Energy Policy 50(2012)821–832
828
Process-related CO 2emissions increased,mainly driven by the sharp increase in cement production (activity effect ).But the decline of the clinker share drove process emissions down by 21.9%over the whole period.
Electricity-consumption-related CO 2emissions also increased due to the increase in cement production (activity effect ),but the decline of electricity intensity of each kiln type contributed to a reduction of 6.3%of overall CO 2emissions.Meanwhile,the speci?c CO 2emissions per kW h electricity in China continually decreased from 1228g CO 2/kW h in 1990to 998g CO 2/kW h (Enerdata,2012),a decline of 19%,which drove emissions down by 8.2%in China’s cement industry.
To conclude,the picture is very similar to that presented for energy consumption:the sharp increase in cement production is the main driving force and cannot be offset by the factors improv-ing carbon ef?ciency,such as the decrease of clinker share,kiln ef?ciency improvement and structural shifts between kiln types.
5.Outlook on remaining improvement potentials
The following sections further extend the results of the above analysis by ?rst discussing the role of technical energy-ef?ciency
standards in China since 2007,and then concluding with an outlook on future potentials for energy-ef?ciency improvement and CO 2mitigation in China’s cement industry.
5.1.The role of technical energy-ef?ciency standards for cement production
China has introduced 27energy-ef?ciency standards for energy-intensive processes,among others for cement (GB 16780-2007:SAC,2007),which was one of the ?rst when it was introduced in 2007.At the regional level even more stringent standards were required for construction of new plants.
The explicit standards are shown in Table A1in Appendix.Important elements are:
Existing and new plants have different standards.
The standards are currently not dynamic,but a progress value was speci?ed and formally applied from 1st June 2008.
The standards are differentiated according to the size of the plants,considering that small-scale plants are still present and less ef?cient to some degree.
Fig.8compares the above ef?ciency standards to actual average thermal SEC in China’s cement industry.The results show that these standards may certainly have in?uenced the take-up of more ef?cient cement technology in China,and promote the energy ef?ciency of China’s cement industry.
Waltisberg (2011)compiled the SEC values for clinker produc-tion for 150plants worldwide (Table 6).The comparison with the Chinese standards shows that the standards for the existing plants in China are in the upper range,the standards for the new plants and the ‘‘progress values’’are around or below the average of the better PC5tfurnaces with ?ve or six cyclone pre-heaters.The values for the speci?c electricity use in clinker production are below the average of the better plants worldwide (Table 6).The world-best plants today achieve 2.95GJ/t clinker according to Waltisberg (2011).
In summary,these comparisons show that the standards have been set at a comparatively ambitious level for China (although more stringent standards may have been possible,from an international perspective).The standards have contributed to promoting ef?ciency improvements since 2005.
5.2.Outlook on remaining potentials of best available technology
5.2.1.De?ning best available technology
In this section,we estimate future potentials for energy ef?ciency and CO 2mitigation based on current and best available technology (BAT).For the scenario calculations we use Eqs.(1)and (4)and de?ne one baseline scenario and three scenarios with varying BAT.We use the following considerations for BAT.
0.0
0.51.01.52.02.53.03.54.04.5
G J /t C l i n k e r
Year
https://www.360docs.net/doc/c511827738.html,parison between standards and actual average SEC in China’s cement industry.
Sources :NDRC (2011),Zhou (2007),Lei (2010).
Table 6
Comparison of average values,80%limit for the speci?c fuel and electricity consumption for clinker production worldwide in 150plants and the standard for existing and new cement plants in China.
Source :Waltisberg (2011);National ef?ciency standard for cement GB 16780–2007shown in Table A1of Appendix.Furnace type/factory scale
SEC thermal (GJ/t clinker)
SEC ele-clinker
(kW h/t clinker)
Worldwide:average 150furnaces DS4 3.74–PC4 3.5176PC5t
3.25–Worldwide:80%of the furnaces has SEC below DS4 3.97–PC4 3.7690PC5t 3.47–China:standards for production capacity S Z 4000t/d Standard for existing cement plants r 3.75r 68Standard for new cement plants r 3.46r 62‘‘Progress value’’for new cement plants r 3.34
r 60
Note :DS4,PC4and PC5tnote the most common cement furnace types with 4,5or more cyclone pre-heaters.
Table 7
Current and best available technology (BAT)in China’s cement industry.Technology parameter
Unit
Current technology
in China (2009)Best
available technology SEC thermal,i,t
GJ/t clinker 3.63 3.29CEF fuel kg CO 2/GJ
92.865CEF pro
t CO 2/t clinker 0.5480.478Clinker ratio,i,t t clinker /t cement
64%
50%
Note :Current technology in the cement industry is set to the average technology level in 2009in China.The best available technology assumed in this study refers to Japanese (JCA,2011)and French cement kilns (Habert et al.,2010).
J.-H.Xu et al./Energy Policy 50(2012)821–832829
For energy ef?ciency (SEC thermal ,i ,t ),Japan is the most ef?cient clinker producer (IEA,2007).In Japan 89%of clinker production was from pre-calciner kilns and 11%was from suspension pre-heater kilns in 2009.In the future,converting all cement plants to use the dry production process with pre-heater or pre-calciner like Japan could be considered as an ambitious objective for China,but seems still realistic.Accordingly,we use a SEC of 3.29GJ/t clinker for the BAT scenarios.
CO 2emissions from fuel combustion (CEF fuel ).Currently,coal accounts for more than 99%of all fuels used in cement production in China (Zhou,2007).Alternative fuels,such as waste or biomass,could reduce the production cost and CO 2emissions.Although most alternative fuels expect biomass are not de?ned as carbon-neutral by Intergovernmental Panel on Climate Change,2006),it is important to realize that transferring waste fuels from incin-eration plants to cement kilns could result in CO 2reduction because cement kilns are more ef?cient and generate no residues (Habert et al.,2010).The current use of alternative fuels is close to zero (Zeng,2006),while in Europe it has reached a stable level of around 28%(Habert et al.,2010).Assuming a similar share in China would result in an average fuel emission coef?cient of 65kg CO 2/GJ for the BAT scenario,derived from the average SEC of France (Table 7).
CO 2emissions from raw materials (CEF pro ).In principle,the limestone can be substituted by materials with lower carbon content,such as slag and cement waste.Currently,limestone is being hardly substituted in China (Zeng,2006),and a 10%substitution is assumed for BAT (Habert et al.,2010).
Clinker share (Clinker ratio ,i ,t ).The substitution of clinker by alternative (waste)materials such as ?y ash and plaster resulted in a clinker share of 64%in China in 2009.We assume a clinker share of 50%for BAT,which is also regarded as a technical minimum limit (Habert et al.,2010).
The technology parameter setting is shown in Table 7.
We only consider current BAT in this approach,but not emerging future technology.Currently,several low-carbon cement production processes are being developed.For example,the Celitement process is estimated to save roughly 50%of CO 2emissions and energy use compared to current BAT (Celitement,2010).So in the future,further potentials based on new technol-ogy applications are still expected.
5.2.2.Scenario setting
In order to differentiate the impact of individual factors,we de?ne four different scenarios as described in the following.
Baseline (current technology):all technology parameters are set to their 2009values and kept constant.
Scenario 1(BAT ef?ciency):SEC thermal,i,t and CEF fuel are set to BAT,while other factors are kept to their 2009values.
Scenario 2(BAT material substitution):material substitutions:(CEF pro and Clinker ratio,i,t )were set to BAT,while other factors are kept at their 2009values.
Scenario 3(BAT combined):all technology parameters are set to BAT.
In all scenarios,the cement production is assumed to be constant at the 2009level.This will not be the case in the near future where some increase in production will still occur,but as we focus on relative saving or mitigation potentials,the absolute level of production is not critical for our analysis.
5.2.3.Analysis of results
The scenario results are presented in Table https://www.360docs.net/doc/c511827738.html,pared to the baseline,Scenario 1reduces energy consumption and CO 2emis-sions by 5.6%and 18.3%,respectively,while in Scenario 2,energy consumption and CO 2emissions fall by 19.3%and 24.1%,respec-tively.Scenario 3implies a 25.5%reduction in energy consump-tion and a 33.4%reduction in CO 2emissions compared to the baseline.Although such potentials are further restricted by a number of factors like the heterogeneity in the industry,the time it takes for new technologies to diffuse through the stock,or the availability of alternative fuels,they still show that it is possible to reduce energy consumption and CO 2emission signi?cantly by applying technologies available on the market.Furthermore,as discussed above for the example of the Celitement process,further potentials will certainly emerge as a result of innovative low-carbon cement production techniques.
6.Conclusions
In this paper,the main factors responsible for changes in energy consumption and CO 2emissions in China’s cement indus-try are identi?ed and quantitatively analyzed.The decomposition analysis shows that from 1990to 2009the activity effect drove up energy consumption by 344%,as cement production grew rapidly from 210Mt in 1990to 1630Mt in 2009.The clinker share effect ,structural effect and kiln ef?ciency effect reduced energy consump-tion by 26.6%,30.0%and 24.6%,respectively.Besides those factors,ancillary processes in the cement manufacturing stage contrib-uted a 14.3%increase in energy consumption.Thus,the consider-able ef?ciency improvement was by no means able to offset the production growth resulting in an actual net increase of energy demand by 277%.
Speci?cally,the highest increase in the activity effect has taken place in the period from 2000to 2009,when cement production was driven by the rapid growth in construction and infrastructure development.This increase in activity resulted in a rise in energy consumption by 110.2%instead of the actual 60.3%.Likewise,
Table 8
Energy use and CO 2emission outlook in the different technology scenarios.
Unit
Baseline scenario (current technology)Scenario 1
(BAT ef?ciency)Scenario 2
(BAT material substitution)Scenario 3
(BAT combined)SEC
GJ/t cement 2.78 2.70 2.31 2.13Energy use
PJ 4659n 439537803487Change to baseline %
–à5.6à19.3à25.5Speci?c CO 2emissions t CO 2/t cement 0.570.490.410.35CO 2emissions
Mt CO 21076.2879.2817.4719.1Change to baseline
%
–
à18.3
à24.1
à33.4
Note :In all scenarios,energy use and CO 2emissions are calculated according to average SEC as shown in Table 7.The variations of energy use and emissions are calculated in relation to the 2009value.
n
For consistency,results for energy use in 2009slightly deviate from that of Section 3.2(4542PJ)because here we calculate energy use by an average SEC rather than SEC by kiln type.
J.-H.Xu et al./Energy Policy 50(2012)821–832
830
after2000,technological changes signi?cantly improved energy ef?ciency:shaft kilns were widely substituted by NSP kilns after 2000;the small-scale cement plants and outdated kiln technol-ogies were eliminated;and new mandatory technical standards have been implemented since2007.
The decomposition analysis for CO2emissions for the period 1990–2009shows that activity effect was the main driving force for the rise in CO2emissions from fuel combustion,calcining process and electricity consumption,and resulted in a rise of 192%,283%and81%,respectively.For the fuel combustion emission,the clinker share effect,structural shift effect and kiln ef?ciency effect reduced CO2emissions by15%,17%and13%, respectively,while for the process emission,the clinker share effect decreased CO2emissions by22%.For emissions related to elec-tricity consumption,electricity intensity effect and carbon emission factor effect decreased emissions by6.3%and8.2%,respectively.
However,an outlook shows that signi?cant potentials to further reduce energy demand and CO2emissions using available technologies still exist.Particularly the replacement of hard coal by alternative fuels has only just begun in China.Not only did the structural adjustment phasing out backward processes contain energy conservation and CO2mitigation potentials,but also the ef?ciency improvement by kiln type could entail further poten-tials.Ambitiously increasing the level of the minimum standards would also contribute to further exploiting these potentials.
However,our results also show that ef?ciency improvements are far from offsetting the great effect of production growth in the past two decades and will be most likely unable to do so in the near future—even if output growth is going to slow down in the coming years.Substantial energy and CO2savings will probably only be achieved if new energy-ef?cient,low-carbon kiln process types enter the market.If the market introduction of such new low-carbon process types turns out to face barriers that cannot be overcome in the coming decade,policies might address the demand for cement clinker and aim to substitute clinker by other less carbon-and energy-intensive materials to achieve the neces-sary cuts in CO2emissions.
Acknowledgment
Authors would like to thank Matthias Reuter from Fraunhofer ISI for his valuable comments on the earlier draft of our paper and which helped to improve the content.Special thanks from Jin-Hua Xu go to Fraunhofer ISI for all the help and support received during his visit in ISI.Financial support from the Chinese Academy of Sciences(No.XDA05150700)and the National Natural Science Foundation of China(No.70825001,71133005 and71210005)is acknowledged.The authors also thank the anonymous reviewers for their helpful comments and suggestions and Christine Mahler-Johnstone for the English proof-reading. Appendix
Table A1.
References
Ang,B.W.,Zhang,F.Q.,2000.A survey of index decomposition analysis in energy and environmental studies.Energy25(12),1149–1176.
Ang,B.W.,Liu,F.L.,Chew,E.P.,2003.Perfect decomposition techniques in energy and environmental analysis.Energy Policy31(14),1561–1566.
Ang,B.W.,2004.Decomposition analysis for policymaking in energy:which is the preferred method?Energy Policy32(9),1131–1139.
Ang,B.W.,Liu,N.,2007.Energy decomposition analysis:IEA model versus other methods.Energy Policy35(3),1426–1432.
Cahill, C.J.,Gallacho′ir, B.P.O′.,2010.Monitoring energy ef?ciency trends in European industry:which top-down method should be used?Energy Policy 38,6910–6918.
CelitementGmbH.,2010.The mineral binder of the future.www.celitement.de. China Cement Association,2010.China cement almanac2001–2005&2009.China Building Materials Press,Beijing.
Chinese Ministry of Industry and Information Technology(CMIIT),2009.Opinions on restricting excess production capacity and redundant to guide the healthy development of cement industry.Nov.21,2009.Number575Directive,2009 (in Chinese).
Chinese Ministry of Industry and Information Technology(CMIIT),2010.Operation Status of Major Industry Sectors in2009:Material Industry./http://www.
https://www.360docs.net/doc/c511827738.html,/n11293472/n11293832/n12768545/13568172.html S.
Chinese Ministry of Industry and Information Technology(CMIIT),2011.Operation Status of Major Industry Sectors in2010:Material Industry./http://www.
https://www.360docs.net/doc/c511827738.html,/n11293472/n11295125/n11299605/13578992.html S.
Cui,S.P.,Liu,W.,2008.Analysis of CO2emission mitigation potential in cement producing processes.China Cement4,57–59,in Chinese.
China Building Materials News(CBMN),2010.Review of Energy Consumption in Building Material Industry./https://www.360docs.net/doc/c511827738.html,/ac/pageDetail.jc?pkCnt= 45159&pkTree=15304&cntype=1S.
Enerdata(2012),Global Energy&CO2Database,/www.enerdata.fr S. Hasanbeigi, A.,Price,L.,Lu,H.,Lan,W.,2010.Analysis of energy-ef?ciency opportunities for the cement industry in Shandong Province,China:a case study of16cement plants.Energy35(8),3461–3473.
Hatzigeorgiou, E.,Polatidis,H.,Haralambopoulos, D.,2008.CO2emissions in Greece for1990–2002:a decomposition analysis and comparison of results
Table A1
National energy-ef?ciency standards for the cement industry in China(GB16780-2007). Source:National energy-ef?ciency standard for cement GB16780-2007
Speci?c energy consumption standard for existing cement plants
Factory scale Coal consumption
(GJ/t clinker)Electricity consumption a
(kW h/t clinker)
Electricity consumption b
(kW h/t cement)
Energy consumption
(GJ/t clinker)
Energy consumption
(GJ/t cement)
S Z4000t/d r3.52r68r105r3.75r3.08 2000r S o4000t/d r3.66r73r110r3.93r3.19 1000t/d r S o2000t/d r3.81r76r115r4.07r3.34 S o1000t/d r3.96r78r120r4.25r3.46
Speci?c energy consumption standard for new cement plants
Factory scale Coal consumption
(GJ/t clinker)Electricity consumption a
(kW h/t clinker)
Electricity consumption b
(kW h/t cement)
Energy consumption
(GJ/t clinker)
Energy consumption
(GJ/t cement)
S Z4000t/d r3.22r62r90r3.46r2.81 2000r S Z4000t/d r3.37r65r93r3.60r2.93
‘‘Progress value’’for new cement plants
Factory scale Coal consumption
(GJ/t clinker)Electricity consumption a
(kW h/t clinker)
Electricity consumption b
(kW h/t cement)
Energy consumption
(GJ/t clinker)
Energy consumption
(GJ/t cement)
S Z4000t/d r3.14r60r85r3.34r2.72
2000r S Z4000t/d r3.28r62r90r3.52r2.84
a For cement producing factories which work on clinker production only.
b For cement producing factories which work both on cement production and on cement powder grinding.
J.-H.Xu et al./Energy Policy50(2012)821–832831
using the arithmetic mean Divisia index and logarithmic mean Divisia index techniques.Energy33(3),492–499.
Habert,G.,Billard,C.,Rossi,P.,Chen,C.,Roussel,N.,2010.Cement production technology improvement compared to factor4objectives.Cement and Con-crete Research40(5),820–826.
International Energy Agency(IEA),2007.Tracking Industrial Energy Use and CO2 Emissions.Paris:IEA/OECD.
International Energy Agency(IEA),2011.CO2Emissions from Fuel Combustion2011.
OECD Publishing./https://www.360docs.net/doc/c511827738.html,/co2highlights/CO2highlights.pdf S. Intergovernmental Panel on Climate Change(IPCC),2006.IPCC Guidelines for National Greenhouse Gas Inventories.Tech.Rep.,IGES,Japan.
Japan Cement Associate(JCA),2011.Demand and Supply and Energy Consumption Sections./http://www.jcassoc.or.jp/cement/2eng/ea.html S.
Kong,X.Z.,2005.Scale and technical equipments status of Chinese cement industry.China Building Materials5,34–38,in Chinese.
Lei Q.Z.,Zhang J.X.,2009.Cement Industry’s Great Changes:Report of Commemorate the60th Anniversary of the Founding of PRC(I;&).China Cement(9;10):9–16and8–13(in Chinese).
Lei Q.Z.,2010.Speech of welcome.China International Cement Conference.
/https://www.360docs.net/doc/c511827738.html,/news/2010/3-31/C231849259.htm S.
Lei,Y.,Zhang,Q.,Nielsen,C.,He,K.,2011.An inventory of primary air pollutants and CO2emissions from cement production in China,1990–2020.Atmospheric Environment45(1),147–154.
Liu,F.,Ross,M.,Wang,S.,1995.Energy ef?ciency of China’s cement industry.
Energy20(7),669–681.
Liu,L.C.,Fan,Y.,Wu,G.,Wei,Y.M.,https://www.360docs.net/doc/c511827738.html,ing LMDI method to analyze the change of China’s industrial CO2emissions from?nal fuel use:an empirical analysis.
Energy Policy35(11),5892–5900.
Li,T.P.,2004.Report on present status of energy ef?ciency in China’s cement industry and its energy saving potentiality.China Building Materials9,23–27, in Chinese.
National Development and Reform Commission(NDRC),2006.Special Plan on Cement Industry Development./https://www.360docs.net/doc/c511827738.html,/zcfb/zcfbtz/tz2006/ W020061019573686371500.doc S(in Chinese).
National Development and Reform Commission(NDRC),2011.Further Improve-ment in the Industrial Structure of China’s Building Materials./http://gys.
https://www.360docs.net/doc/c511827738.html,/gzdt/t20110130_393698.htm S.
National Building Materials Bureau(NBMB),1999.Detailed Rules for the Imple-mentation of Controlling Total Amount and Adjusting Structure in Building Material Industry.May7,1999.Number105Directive,1999(in Chinese). National Bureau of Statistics of China(NBS),2011.China Energy Statistical Yearbook2010.China Statistical Press,Beijing.
Price,L.,Worrell,E.,Sinton,J.,Yun,J.,2001.Industrial energy ef?ciency policy in China.ACEEE Summer Study on Energy Ef?ciency in Industry in2001, Lawrence Berkeley National Laboratory and China Energy Conservation Association.Price,L.,Levine,M.,Zhou,N.,et al.,2011.Assessment of China’s energy-saving and emission reduction accomplishments and opportunities during the11th Five Year Plan.Energy Policy39(4),2165–2178.
Sui T.,2009.China’s Cement Industry Towards Sustainability.Report in Italce-menti Group./https://www.360docs.net/doc/c511827738.html,/NR/rdonlyres/4FFAD881-52B9-439B-8D51-965D7CC4588F/F0/FTongbo_UK.pdf.S.
Sui,T.,2010.IEA-BEE International Workshop on Industrial Energy Ef?ciency.
/https://www.360docs.net/doc/c511827738.html,/work/2010/india_bee/tongbo.pdf.S.
Sheinbaum,C.,Ozawa,L.,Castillo,D.,https://www.360docs.net/doc/c511827738.html,ing logarithmic mean Divisia index to analyze changes in energy use and carbon dioxide emissions in Mexico’s iron and steel industry.Energy Economics32(6),1337–1344. Standardization Administration of the People’s Republic of China(SAC),2007.
The norm of energy consumption per unit product of cement./http://www.
https://www.360docs.net/doc/c511827738.html,/uploads/soft/110727/1-110HG33910.pdf S.
Soule,M.H.,Logan,J.S.,and Stewart,T.A.,2002.Toward a Sustainable Cement Industry:Trends,Challenges,and Opportunities in China’s Cement Industry.
Produced by Battelle for the World Business Council for Sustainable Development.
U.S.Geological Survey(USGS),2011.Mineral Commodity Summaries2011.United States Government Printing Of?ce,Washington.
Waltisberg,J.,2011.Presentation at Seminar of‘‘Sino-German Seminar about the development and implementation of energy consumption standards in the industry sector,organized by Chongqing Municipal Economic Commission and Deutsche Gesellschaft f¨ur Internationale Zusammenarbeit(GIZ)GmbH, Chonqing,2011-3-16/17.
Worrell E.,Galitsky C.,Price L.,2008.Energy Ef?ciency Improvement Opportu-nities for the Cement Industry.Berkeley,CA:Lawrence Berkeley National Laboratory./https://www.360docs.net/doc/c511827738.html,/node/402S.
Wu,H.M.,2009.A brief discussion about China’s shaft kiln cement and structure adjustment.Conference Paper in the11th China National Cement Technology Conference2009(in Chinese).
Xiong,H.W.,Zheng,Z.Y.,Xu,Y.X.,Dai,X.Z.,2004.Research on the impact of cement industry structure adjustment to reduction of energy consumption.China Building Materials8,23–27,in Chinese.
Yao,Y.,Wang,W.Y.,2003.Analysis on product quality improvement after China cement standard connected with international.Cement6,1–6,in Chinese. Zeng,X.M.,2005.New epoch in the development of China’s cement industry—new dry process begins to dominate the industry.China Cement3,7–11,in Chinese.
Zeng,X.M.,2006.Energy consumption status and energy saving potential in cement industry.China Cement3,16–21,in Chinese.
Zeng,X.M.,2008.Current status and energy ef?ciency improvement of China cement industry.Workshop on International Comparison of Industrial Energy Ef?ciency.
/https://www.360docs.net/doc/c511827738.html,/work/2008/comparison/ZENG_CEMENT_EN.pdf S.
Zhou,H.J.,2007.A review on energy consumption of cement industry in2006.
China Cement10,26–29,in Chinese.
J.-H.Xu et al./Energy Policy50(2012)821–832 832
一生励志的正能量短句子大全
一生励志的正能量短句子大全 一生励志的正能量短句子摘抄 1. 不经历风雨,长不成大树,不受百炼,难以成钢。 2. 耐心和恒心总会得到报酬的。 3. 宝剑锋从磨砺出,梅花香自苦寒来。 4. 表示惊讶,只需一分钟;要做出惊人的事业,却要许多年。 5. 不放弃!决不放弃!永不放弃! ——邱吉尔 6. 不积跬步,无以至千里;不积小流,无以成江海。——荀子 7. 苟有恒,何必三更起五更眠;最无益,只怕一日曝十日寒。——毛泽东 8. 成功最终属于耐心等待得人。 9. 凡是新的事情在起头总是这样一来的,起初热心的人很多,而不久就冷淡下去,撒手不做了,因为他已经明白,不经过一番苦工是做不成的,而只有想做的人,才忍得过这番痛苦。——陀思妥耶夫斯基 10. 放弃时间的人,时间也会放弃他。——莎士比亚 11. 斧头虽小,但经历多次劈砍,终能将一棵最坚硬的
橡树砍刀。 12. 告诉你使我达到目标的奥秘吧,我惟一的力量就是我的坚持精神——巴斯德 13. 一个人最痛苦的时候不是吃不上饭的时候,而是想努力奋斗没有机会。 14. 与其做一个有价钱的人,不如做一个有价值的人;与其做一个忙碌的人,不如做一个有效率的人。 15. 没有目标的人,永远为有目标的人打工。 16. 智者创造机会,强者把握机会,弱者坐等机会。 17. 说出的苦不叫苦,说不出的苦才叫苦。 18. 人若把自己框在一定的范围内,就容易限制了自己的思维和格局。 19. 人往往年轻时用健康换财富,老时再用财富换健康。发达国家的人们是透支金钱,储存健康;我们国家的人是透支健康,储存金钱。 20. 人因为有理想、梦想而变得伟大,而真正伟大就是不断努力实现理想、梦想。 一生励志的正能量短句子精选 1. 一件事被所有人都认为是机会的时候,其实它已不是机会了。 2. 天上最美的是星星,人间最美的是真情。 3. 活鱼会逆流而上,死鱼才随波逐流。 4. 怕苦的人苦一辈子,不怕苦的人苦一阵子。
能量的转化和转移-初中物理知识点习题集
能量的转化和转移(北京习题集)(教师版) 一.选择题(共5小题) 1.(2016秋?昌平区期末)下列说法中不正确的是 A .发电机工作时,将机械能转化为电能 B .电风扇工作时,扇叶的机械能是由电能转化的 C .在被阳光照射时,太阳能电池将太阳能转化为电能 D .干电池给小灯泡供电时,干电池将电能转化为化学能 2.(2016秋?西城区校级期中)下列生活实例中,只有能量的转化而没有能量的转移的是 A .利用煤气灶将冷水烧热 B .汽车行驶一段路程后,轮胎会发热 C .太阳能水箱中的水被晒热了 D .把冰块放在果汁里,饮用时感觉很凉快 3.(2015秋?东城区校级期中)在能的转化过程中,下列叙述不正确的是 A .木柴燃烧过程中是化学能转化为内能 B .发电机工作时是机械能转化为电能 C .电源是将其它形式的能转化为电能的装置 D .干电池使用时,是把电能转化为化学能 4.(2014秋?北京校级月考)下列现象中,只有能的转移而不发生能的转化的过程是 A .水蒸气会把壶盖顶起来 B .洗衣机工作 C .用锤子打铁件,铁件发热 D .冬天用手摸户外的东西时感到冷 5.(2011秋?西城区校级月考)下列过程中,机械能转化为内能的是 A .锯木头,经过一段时间后,锯条和木头都发热 B .锅里的水沸腾时,水蒸气把锅盖顶起 C .神州号飞船点火后,腾空而起 D .礼花弹在节日的夜空中绽开 二.多选题(共1小题) 6.(2008?宣武区二模)在以下事例中,机械能转化为内能的是 ()()()() ()()
A .流星与空气摩擦,生热发光 B .水壶中的水沸腾后,壶盖被水蒸气顶起 C .反复弯折铁丝,铁丝弯折处温度升高 D .金属汤勺放在热汤中,其温度升高 三.填空题(共3小题) 7.(2016秋?西城区校级期中)如果你去参观中国科技馆四层“挑战与未来” 厅 “新型材料”展区,你就可以看到这种能发电的神奇布料。会发电的衣服是用一种可以利用运动产生电力的新型纤维织造的,当人穿上这种纤维织成的衣物后,在身体运动过程中会产生一些压折,或者遇上一阵微风,就能够形成源源不断的电流,这种发电方式是将人体的 能转化为电能、并加以应用的最简单也最经济的方式。发电纤维与压电陶瓷都是通过压力来产生电力,而使小灯泡发光的。 8.(2013?西城区一模)如图所示是北京郊区官厅风力发电场的巨大的风车。这种装置可以利用风能带动扇叶转动,并把风车的机械能转化为 能。 9.(2012秋?宣武区校级月考)某人使用手机通话时,锂电池此时的能量转化是 。 四.实验探究题(共1小题) 10.(2016秋?海淀区期中)阅读《压电陶瓷》回答问题。 压电陶瓷 打火机是日常生活中常用的物品,最初的打火机是靠拨动齿轮与火石摩擦起火的,而今人们常用的是压电式打火机。这种打火机中装有一块压电陶瓷。使用时只需按压点火开关,利用压电陶瓷的压电效应,在两点火极之间产生 的电压而引起火花,引燃丁烷气(如图甲所示)。 某些物质在沿一定方向上受到外力的作用而变形时,就会在它的两个相对表面上形成一定的电压。当外力去掉后,它又会恢复到不带电的状态,这种现象称为压电效应。这种压电效应不仅仅用于打火机,还应用于煤气灶打火开关、炮弹触发引线、压电地震仪等许多场合。 某种压电陶瓷片外形如图乙所示。它是把圆形压电陶瓷片与金属振动片粘合在一起。当在压电陶瓷片上施加一个压力时,在陶瓷片与金属振动片之间就会产生电压。可用如图丙的方法来观察压电现象并检查压电陶瓷片的质量好坏,即用导线把金属振动片和压电陶瓷片分别与电压表的、接线柱连接,当用拇指与食指挤压压电陶瓷片和金属振动片的两面时,电压表的指针就会偏转,这说明在压电陶瓷片与金属振动片之间产生了电压。 在压力相同的情况下,电压表指针摆幅越大,说明压电陶瓷片的灵敏度越高 。 A --10~20kV +-
工作励志正能量句子
工作励志正能量句子 1)对于攀登者来说,失掉往昔的足迹并不可惜,迷失了继续前时的方向却很危险。 2)奋斗者在汗水汇集的江河里,将事业之舟驶到了理想的彼岸。 3)含泪播种的人一定能含笑收获。 4)很多失败不是因为能力有限,而是因为没有坚持到底。 5)机会不会主动找到你,必须亮出你自己。 6)驾驭命运的舵是奋斗。不抱有一丝幻想,不放弃一点机会,不停止一日努力。 7)困难和挫折都不可怕,可怕的是丧失做人的志气和勇气。 8)漫漫长路,你愿一人独撑,忍受着孤独与寂寞,承受着体力与精神的压迫,只任汗水溶于泪水,可脚步却从不停歇。好样的,纵然得不了桂冠,可坚持的你,定会赢得最后的掌声。 9)莫找借口失败,只找理由成功。 10)世上没有绝望的处境,只有对处境绝望的人。 11)每一发奋努力的背后,必有加倍的赏赐。 12)赚钱之道很多,但是找不到赚钱的种子,便成不了事业家。 13)大多数人想要改造这个世界,但却罕有人想改造自己。 14)当一个人先从自己的内心开始奋斗,他就是个有价值的人。 15)即使爬到最高的山上,一次也只能脚踏实地地迈一步。 16)穷人缺的是钱而不是时间,富人缺的是时间而不是钱。
17)好心不一定会换来感恩,但千万不要因此而灰心。 18)若不给自己设限,则人生中就没有限制你发挥的藩篱。 19)最有效的资本是我们的信誉,它小时不停为我们工作。 20)人生不是一种享乐,而是一桩十分沉重的工作。 1)忙于采集的蜜蜂,无暇在人前高谈阔论。 2)你追我赶拼搏争先,流血流汗不留遗憾。 3)懦弱的人只会裹足不前,莽撞的人只能引为烧身,只有真正勇敢的人才能所向披靡。 4)勤奋是你生命的密码,能译出你一部壮丽的史诗。 5)人生伟业的建立,不在能知,乃在能行。 6)你的上司越忙,你的饭碗越危险。 7)如果你最近的工作很闲,注意了,这可能是危机的先兆。 8)到处都是有才华的穷人,千万别觉得自己无可替代。 9)每一个成功者都有一个开始。勇于开始,才能找到成功的路。 10)当一个人用工作去迎接光明,光明很快就会来照耀着他。 11)如果我们想要更多的玫瑰花,就必须种植更多的玫瑰树。 12)漂亮的脸孔是给别人看的,而有智慧的头脑才是给自己利用的。 13)人只有在布满陡峭的路上,才能使自己的脚跟变的更稳;人只有在布满荆棘的路上,才能使自己的身体变的不怕伤痕;人只有在布满危险的路上,才能使自己的战斗力变的无比之强! 14)选择自信,就是选择豁达坦然,就是选择在名利面前岿然不动,就是选择在势力面前昂首挺胸,撑开自信的帆破流向前,展示搏击的风采。
正能量励志短句子(精选300句)
正能量励志短句子(精选300句) 2021-02-28 正能量励志短句子(精选300句) 1、当你尽了自我的最大努力时,失败也是伟大的。 2、生命力的意义在于拼搏,因为世界本身就是一个竞技场。 3、荆棘的存在是为了野草不轻易地任人践踏。 4、少一点预设的期盼,那份对人的关怀会更自在。 5、当你能梦的时候就不好放下梦。 6、以往拥有的,不要忘记;已经得到的,更要珍惜;属于自我的,不要放下;已经失去的,留着回忆;想要得到的,必须努力;但最重要的,是好好爱惜自我。 7、留心记下自我平常所说的话,看看其中有多少是陈述性的,有多少是询问性的。假如你总是向别人发问,你就是在寻求赞许。 8、学习是苦根上长出来的甜果。 9、我们一向以为最艰难的总是当下,却发现人生从来不曾有最艰难,只会有更艰难。唯一还值得庆幸的是,所有打不倒你的都将使你变得更强大,所有打倒了你的也并没将你彻底击垮。风是无常的,人,也是无常的,我的忙碌,也是无常,世事无常。 10、生活中若没有兄弟姐妹,就像生活中没有阳光一样。 11、不要因为没有掌声而放下你的梦想。 12、人生就是一般此刻时和此刻进行时,没有一般过去时。 13、拒绝严峻的冶炼,矿石并不比被发掘前更有价值。 14、人生的路经历过,才知道有短有长;岁月,在无憾中微笑,才美丽;回过头,想着明天抱一抱。那些年最初的梦想在我们心中依旧完美,我们只需要记住那些完美。把握此刻,活在当下才是真理。 15、此岸,彼岸,终究是尘归尘,土归土。一季绯红也只是一季花凉,几许艳丽,几许妩媚,几经风雨,尘埃落地。活着,就要慢慢老去,途径坎坷,感受
悲喜,生命最终是寂灭。缘有长短,人有来去,再深的情也会淡泊,再浓的意也会无痕,初见永远不会再见。 16、命是弱者的借口,运是强者的谦词。 17、要假设你融不到一分钱的情景去做事业。 18、人生如逆旅,我亦是行人。 19、就算全世界都说我漂亮,但你却说我不漂亮,那么我就是不漂亮。 20、如果我们能够改变情绪,我们就能够改变未来。 21、拥有的,要珍惜,要知足;做人必须要有一颗平常心,肤浅的羡慕,无聊的攀比,笨拙的效仿,只会让自我整天活在他人的影子里面。我们应当认清自我,找到属于自我的位置,走自我的道路,过自我的生活。 22、一些伤口之所以总会痛,那是因为你总是去摸。 23、一个人变强大的最好方式,就是拥有一个想要保护的人。 24、欲望得不到满足痛苦;欲望一旦满足就无聊,生命就是在痛苦和无聊之间摇摆。 25、萤火虫的光点虽然微弱,但亮着便是向黑暗挑战。 26、人格的完善是本,财富的确立是末。 27、若不尝试着做些本事之外的事,你就永远不会成长。 28、名利都是虚幻的,自我的心才是最实在的。[由https://www.360docs.net/doc/c511827738.html,整理] 29、要诚恳,要坦然,要慷慨,要宽容,要有平常心。 30、做一名自信者,牢牢把住自我生命的罗盘,让生命充畅。做一名自谦者,慢慢拓展自我生命的容量,让生命充实。做一名自爱者,深深领会自我生命的价值,让生命充美。做一名自安者,悄悄抚平自我生命的伤痕,让生命充悦。做一名自洁者,时时清除自我生命的淤积,让生命充盈。 31、经过云端的道路,只亲吻攀登者的足迹。 32、单纯是我追求的一种生活方式,也是我持续的一种创作心态,但追求单纯需付出许多代价,你必须要有勇气承担因为单纯而带来的被他人利用欺瞒及孤立。但我觉得人生本来就该尽可能坚持一种单纯的状态,因这种状态是最接近自我的内心,一个纯静的内心会把许多事情导入正向,让你拥有一个物质之外的丰富人生。
初中物理能量的转化和守恒教案
《能量的转化和守恒》教案 一、教学目标: 1、知道各种形式的能是可以相互转化的。 2、知道在转化的过程中,能量的总量是保持不变的。 3、列举出日常生活中能量守恒的实例。 4、有用能量守恒的观点分析物理现象的意识。 教学重点:能的转化和守恒定律,强调能的转化和守恒定律是自然科学中最基本定律。 教学难点:运用能的转化和守恒原理计算一些物理习题;运用能的转化和守恒定律对具体的自然现象进行分析,说明能是怎样转化的。 二、资料准备:教材分析: 教材从能量的转化与守恒中,列举出生活中的能量守恒实例来加强教学。 三、教学过程: 环节一:引入新课 我们知道物体的动能和热能,是由物体的机械能运动情况决定的能量,内能跟物体内部分子的热运动和分子间的相互作用情况有关。物体内部分子的热运动,物体的机械运动都是物质运动的形式,由于运动形式不同,与之相联系的能量也不相同。 环节二:进行新课 的事例,说明各种形式的能的转化和转移)。在热传递过程中,高温物体的内能转移到低温物体。运动的甲钢球碰击静止的乙钢球,甲球的机械能转移到乙球。在这种转移的过程中能量形式没有变。 在自然界中能量的转化也是普遍存在的。小朋友滑滑梯,由于摩擦而使机械能转化为内能;在气体膨胀做功的现象中,内能转化为机械能;在水力发电中,水的机械能转化为电能;在火力发电厂,燃料燃烧释放的化学能,转化成电能;在核电站,核能转化为电能;电流通过电热器时,电能转化为内能;电流通过电动机,电能转化为机械能。有关能量转化的事例同学们一定能举出许多,课本图2-17中画出了一些农常用的生活、生产设备。请同学分析在使用图中设备时能量的转化。 (3)在能量转化和转移的过程中,能的总量保持不变。大量事实证明,在普遍存在的能量的转化和转移过程中,消耗多少某种形式的能量,就得到多少其他形式的能量。如在热传递过程中,高温物体放出多少热量(减少多少内能),低温物体就吸收多少热量(增加多少内能);克服摩擦力做了多少功,就有多少机械能转化为能量,但能量的总量不变。就是说某物体损失的能量等于几个物体得到几个物体得到的能量的总和。例如,把烧热的金属块,投到冷水中,冷水,盛水的容器以及周围的空气等,都要吸收热量,它们所吸收的热量总和跟金属块放出的热量相等。再如水电站里,水从高处流下,损失了机械能,一方面由于推动发电机转动而转化为电能,一方面水跟水轮机、管道摩擦而转化为内能。那么水的机械能的损失等于产生的电能和内能的总和。 以上规律是人类经过长期的实践探索,直到19世纪,才确立了这个自然界最普遍的定律棗能量的转化守恒定律。通常把它表述为: 能量既不会消灭,也不会创生,它只会从一种形式转化为其他形式,或者从一个物体转移
50条超励志的正能量经典句子
50条超励志的正能量经典句子 1、当你觉得自已充满斗志,充满信心,别人就会觉得你就是值得相信的你。 2、当你觉得没有人来爱你,别人看见的就是可怜兮兮,毫无魅力的你。 3、当你觉得自己满怀希望,对未来充满信心,别人看到的就是有魅力,风华绝代的你。 4、人生与其说你有不幸的事实存在,倒不如说是你的悲观的观念所带来的。 5、有一则谚语说,绵羊每"咩咩"叫上一次,它就会失掉一口干草,如果你的心态是沉重的,总是抱怨你的苦恼,那么每说一次你便失掉一个快乐的机会。 6、相信自已。 不要妄加评判自已,也不会把自已交给别人评判,更不会贬低自已。 7、你想要别人是你的朋友,你必须是别人的朋友,心要靠心来交换,感情只有用感情来博取。 8、人生的游戏不在于拿了一副好牌,而在于怎样去打好坏牌,世上没有常胜将军,勇于超越自我者才能得到最后的奖杯。 9、既然时间是最宝贵的财富,那么珍惜时间,合理地运用时间就很重要,如何合理地花费时间,就如同花钱的规划一样重要,钱花
完了可再挣,时间花完了就不能再生,因此,更要利用好你的时间。 10、解铃还需系铃人,躲避责任会解决不了任何问题,它只导致一个失败的人生。 11、人不怕走在黑夜里,就怕心中没有阳光。 12、逃避不一定躲得过,面对不一定难受.转身不一定最软 弱.13、话多不如话少,话少不如话好。 14、曾经拥有的不要忘记,已经得到的要珍惜,属于自已的不要放弃。 15、永远都不要停止微笑,即使是在你难过的时候,说不定哪一天有人会因为你的笑容面爱上你。 16、因为某人不如你所愿爱你,并不意味着你不被别人所爱。 17、一个真正的朋友会握着你的手,触动你的心。 18、也许上帝让遇见那个适合你的人之前,会遇见很多错误的人,所以当一切发生的时候,你应该心存感激。 19、勇敢的面对不一定成功,但你不面对就一定不成功。 20、黑夜的转弯是白天,愤怒的转弯是快乐,所以有的时候让心情转个弯就好了。 21、一天要做三件事,第一要笑,第二要微笑,第三要哈哈大笑。 22、小树会大,大树会老,老树会凋零。 23、如果你不想做,你可以找一个理由,如果你肯做,你也可以
(励志句子)激励自己奋斗的正能量励志句子
激励自己奋斗的正能量励志句子 励志句子 1、在别人肆意说你的时候,问问自己,到底怕不怕,输不输的起。不必害怕,不要后退,不须犹豫,难过的时候就一个人去看看这世界。多问问自己,你是不是已经为了梦想而竭尽全力了? 2、人生从来没有真正的绝境。无论遭受多少艰辛,无论经历多少苦难,只要一个人的心中还怀着一粒信念的种子,那么总有一天,他就能走出困境,让生命重新开花结果。 3、幻想一步成功者突遭失败,会觉得浪费了时间,付出了精力,却认为没有任何收获;在失败面前,懦弱者痛苦迷茫,彷徨畏缩;而强者却坚持不懈,紧追不舍。 4、进步和成长的过程总是有许多的困难与坎坷的。有时我们是由于志向不明,没有明确的目的而碌碌无为。但是还有另外一种情况,是由于我们自己的退缩,与自己亲密的妥协没有坚持到底的意志,才使得机会逝去,颗粒无收。 5、决不能习惯失败,因为你要知道,身体的疲惫,不是真正的疲惫;精神上的疲惫,才是真的劳累。 6、理想是什么?它不是口上说的计划,也不是敷衍的借口,它是自己的心,理想的最终汇集地,是幸福,为了自己有了理想,为了恋人有了理想,为了家人有了理想,有了理想才有梦,梦想与理想,一字之差千里之遥。
7、路是自己选的,后悔的话,也只能往自己的肚子里咽。 8、没有钱、没有经验、没有阅历、没有社会关系,这些都不可怕。没有钱,可以通过辛勤劳动去赚;没有经验,可以通过实践操作去总结;没有阅历,可以一步一步去积累;没有社会关系,可以一点一点去编织。但是,没有梦想、没有思路才是最可怕的,才让人感到恐惧,很想逃避! 9、每颗珍珠原本都是一粒沙子,但并不是每一粒沙子都能成为一颗珍珠。想要卓尔不群,就要有鹤立鸡群的资本。忍受不了打击和挫折,承受不住忽视和平淡,就很难达到辉煌。年轻人要想让自己得到重用,取得成功,就必须把自己从一粒沙子变成一颗价值连城的珍珠。 10、每一个人的成功之路或许都不尽相同,但我相信,成功都需要每一位想成功的人去努力、去奋斗,而每一条成功之路,都是充满坎坷的,只有那些坚信自己目标,不断努力、不断奋斗的人,才能取得最终的成功。但有一点我始终坚信,那就是,当你能把自己感动得哭了的时候,你就成功了!
正能量励志的句子经典短句50个
正能量励志的句子经典短句50个 1、经历,只是让我们在下一次面对困难时更加淡定和从容! 2、十年前,你周围的人会根据你父母的收入对待你。十年后,你周围的人会根据你的收入对待你的父母和你的孩子!这就是人性和人生,除了努力别无选择。记住:没有伞的孩子,必须努力奔跑! 3、成功没有快车道,幸福没有高速路,一份耕耘一份收获,所有的成功都来自不倦的努力和奔跑,所有幸福都来自平凡的奋斗和坚持。 4、立志越高,所需要的能力越强,相应的,逼迫自己所学的,也就越多。 5、人活着不是要用眼泪博得同情,而是用汗水赢得掌声。 6、认定了的路,再痛也不要皱一下眉头,再怎么难走都是你自己选的,你没有资格喊疼。 7、该来的自然来,会走的留不住。不违心,不刻意,不必太在乎,放开执念,随缘是最好的生活。 8、有句话说的好,不打没有准备的仗,做事之前要修炼自己,有能力才会有魄力,有魄力才会有勇气,有这样的胆色才能把能力发挥到极致,那么你就成功了! 9、人生是一种承受,我们要学会支撑自己。人的成长,在于学习,也在于经历。人的修养,在于领悟,也在于静修。人的幸福,在于得到,也在于放下。人生秘诀,在于别人,也在于自己。
10、世界那么大,你的野心再大,它也一定装得下。 11、走过的路成为背后的风景,不能回头不能停留,若此刻停留,将会错过更好的风景,保持一份平和,保持一份清醒。 12、多和优秀的人在一起,他们就像一团光芒,呆久了,就再也不想走回黑暗了。 13、每天提升正能量,心中充满小太阳。 14、没有太晚的开始,不如就从今天行动。总有一天,那个一点一点可见的未来,会在你心里,也在你的脚下慢慢清透。生活,从不亏待每一个努力向上的人。 15、如果你真的想做一件事情,那么就算障碍重重,你也会想尽一切办法去办到它。但若是你不是真心的想要去完成一件事情,那么纵使前方道路平坦,你也会想尽一切理由阻止自己向前。 16、过去的事,交给岁月去处理;将来的事,留给时间去证明。我们真正要做的,就是牢牢地抓住今天,让今天的自己胜过昨天的自己。 17、做事不需要人人都理解,但你要尽心尽力;做人不需要人人都喜欢,但你要坦坦荡荡。梦想的坚持注定有孤独彷徨,因为少不了他人的质疑和嘲笑,但那又怎样,哪怕遍体鳞伤,也要活得漂亮! 18、人的一生不长,今天的辛酸经历,就是明天最美好的回忆,今天的努力将成为明天更多的收获!错过的就让它永远的错过。要珍惜眼前的生活,活出自己的人生,为自己的人生加油! 19、你走过的每一条弯路,其实都是必经之路,你要记住的是,
苏科初中物理九下《18.4能量转化的基本规律》word教案 (3)
四、能量转化的基本规律 学习要求 1.知道能量守恒定律。能举出日常生活中能量守恒的实例。有用能量转化与守恒的分析物理现象的意识。 2.初步了解在现实生活中能量的转化与转移有一定的方向性。 3.讨论和分析两个具体的永动机设计方案,说明永动机是不可能的。 学习指导 1.能量守恒定律:能量既不会凭空消灭,也不会凭空产生,它只会从一种形式转化为另一种形式,或者从一个物体转移到另一个物体,而在转化或转移的过程中,其总量保持不变。能量守恒定律是自然界最普遍、最重要的基本定律之一。一切有能量转化或转移的场合,大到宇宙、小到原子核内部,也不论是生物、化学还是物理、地质现象,都遵守能量守恒定律。自然界中能的总量保持不变,但是对于某一物体可能改变。 2.能量转化和转移的方向性:热量只能从高温物体转移到低温物体,不能相反,具有方向性,否则就要消耗其他的能。不是什么能源都可以利用,能源的利用是有条件的,也是有代价的,有的东西能成为能源,有的则不能。虽然能量在转化和转移的过程中是守恒的,但具有方向性,因此我们一定要节约能源。 典型范例 例题市场经济的今天,一些厂商一改过去“酒香不怕巷子深”的做法,纷纷对产品进行广告宣传。可是有些厂商在广告上弄虚作假,夸大其词,欺骗消费者。如某品牌电热水器这样写道:“我厂电热水器功率只有55W,烧开一瓶水只需5min,节钱省电,最适合普通家庭使用。”这则广告可信吗? 精析:电热水器烧开水,是电能转化为热能被水吸收的过程。方法一:根据题意求出电热水器所产生的热能,再利用热量公式,算出这些热量能够烧开多少质量的水,与事实进行比较,判断信息是否可信;方法二:先求出电热电热水器所产生的热能,再估算出烧开一瓶水所需要的热量,两者进行比较,判断信息是否可信,判断的依据是能量守恒定律。 全解:方法一:电热水器产生的热能为W=Pt=55W×5×60s=1.65×10⁴J。 假设一般情况下烧开水是把水从20℃加热到100℃,则这些热量可以烧开的水的质量m= Q c△t = W c△t = 1.65×10⁴J 4.2×10³J/(kg·℃×(100℃-20℃)) =0.049kg。
关于唯美励志充满正能量的句子和图片.doc
关于唯美励志充满正能量的句子和图片 在路上,我们生命得到了肯定,一路上,我们有失败也有成功,有泪水也有感动,有曲折也有坦途,有机遇也有梦想。下面是我精心整理的唯美励志充满正能量的句子和图片,希望能给大家带来帮助! 1.你不喜欢我,我一点都不介意。因为我活下来,不是为了取悦你! 2.要成功,就要长期等待而不焦躁,态度从容却保持敏锐,不怕挫折且充满希望。 3.行走红尘,别被欲望左右迷失了方向,别被物质打败做了生活的奴隶,给心灵腾出一方空间,让那些够得着的幸福安全抵达,攥在自己手里的,才是实实在在的幸福。 4.所谓成长,就是逼着你一个人,踉踉跄跄的受伤,跌跌撞撞的坚强。 5.如有谁让你难过,一定不要难过太久,因为太多时候,都是被自己编织故事困扰,只是从自己的角度看了事实的一角,只是需求没有满足的夸大,只是习惯于按自己的模式判断,远离事实真相的结果。真相往往没有你想像的悲壮和恶劣,真相中,多有你的误解,和自以为是的受伤,而真心伤人的人真不多见。 6.有时候不是不懂,只是不想懂;有时候不是不知道,只是不想说出来;有时候不是不明白,而是明白了也不知道该怎么做,于是就保持了沉默。 7.人生的每一场相遇,都是缘分,没有对错。人生的每一个清晨,
都该努力,不能拖延。 8.有些人、有些话、说不说、理不理都无所谓。因为看清了,也就看轻了。 9.爱上一个人,会从高傲变成卑微。一举一动,一句话,都会小心翼翼如履薄冰。但对方若爱你,肯定会将这卑微慢慢扳平,变成毫无拘束的相处。如果一段感情让你只能处在下风才能进行,那一定不是真正相互深爱的感情。 10.不管脚步有多慢都不要紧,只要你在走,总会看到进步。 11.如果我在意的人对我忽冷忽热,而我又为此感到了患得患失,那么我便会选择不辞而别,因为我没那么多耐心去品尝患得患失的感觉。 .一辈子不长,只有珍惜了,才不至于后悔。 13.人生是坎坷的,人生是崎岖的。我坚信:在人生中只有曲线前进的快乐,没有直线上升的成功。只有珍惜今天,才会有美好的明天;只有把握住今天,才会有更辉煌的明天!人生啊,朋友啊!还等什么?奋斗吧! 14.没有伞的孩子,必须努力奔跑! 15.当我觉得我倒霉了,我就会想:这是在挥洒我的霉运,挥洒之后,剩下的就全都是幸运了! 16.如果你的面前有阴影,那是因为你的背后有阳光。 17.心情的颜色是活泼热烈的红色,是生机盎然的绿色,是尊贵华丽的黄色,好好地,用这种种颜色做心情,来书写生活,不要让它变得灰暗...... 18.你向我张开手臂,我会小跑几步;你向我微笑,我会驻足聆听;
精品-关于拼搏正能量励志句子大全100句
关于拼搏正能量励志句子大全100句 关于拼搏正能量励志句子大全100句 1、没有人陪你走一辈子,所以你要适应孤独,没有人会帮你一辈子,所以你要一直奋斗。 2、我们自己选择的路,即使跪着也要走完;因为一旦开始,便不能终止。这才叫做真正的坚持。 3、不如意的时候不要尽往悲伤里钻,想想有笑声的日子吧。 4、把困难举在头上,它就是灭顶石;把困难踩在脚下,它 就是垫脚石。 5、思路决定出路,气度决定高度,细节决定成败,性格决定命运。 6、后悔是一种耗费精神的情绪,后悔是比损失更大的损失,比错误更大的错误,所以不要后悔。
7、我们比较容易承认行为上的错误、过失和缺点,而对于思想上的错误、过失和缺点则不然。 8、相信朋友的忠诚。相信自己的勇气。相信敌人的愚蠢。 9、每一枝玫瑰都有刺正如每个人的性格里都有你不能容忍的部分。 10、为自己选择的跑道去冲刺,即使很漫长,即使有阻碍,即使会跌倒;但是,坚定的信念会一直陪伴着我欢笑的、努力地、飞快地奔跑。即使非常非常的辛苦,只要有坚持下去的勇气,再大的山、再阔的海都可以跨越,努力的奔跑,天空的那一边就不再遥远! 11、在人生的道路上,谁都会遇到困难和挫折,就看你能 不能战胜它。战胜了,你就是英雄,就是生活的强者。 12、顺境的美德是节制,逆境的美德是坚韧,这后一种是 较为伟大的德性。 13、一个社团的基本努力或许就是设法使其成员平等,但 其成员个人的自尊心却总是希望自己出人头地,在某处形成某种对自己有利的不平等。
14、在青春的世界里,沙粒要变成珍珠,石头要化作黄金,青春的魅力,应当叫枯枝长出鲜果,沙漠布满森林,这才是青春的美,青春的快乐,青春的本分! 15、穷人缺什么:表面缺资金,本质缺野心,脑子缺观念,机会缺了解,骨子缺勇气,改变缺行动,事业缺毅力。 16、人终归是要生活着的,“不要以为你的努力徒劳无功,权当做磨练你的意志”,只要努力去做事了,多多少少会有收获,一直坚持做下去,就会走向成功! 17、成功不是将来才有的,而是从决定去做的那一刻起, 持续累积而成。 18、只有感受饥饿,才能知道温饱幸福;只有经历风雨,才能见到七彩虹;只有历尽崎岖,才能全力奋起拼搏。在以后的 生活中,我不知道我会遇到多少坎坷但是我相信,我会用全力征服挫折。 19、在世界的前进中起作用的不是我们的才能,而是我们 如何运用才能。 20、人世间,比青春再可宝贵的东西实在没有,然而青春
正能量工作励志短句子
正能量工作励志短句子 1.我走得很慢,但我从不后退! 2.微笑拥抱每一天,做像向日葵般温暖的女子。 3.待人对事不好太计较,如果太计较就会有悔恨! 4.仅仅活着是不够的,还需要有阳光自由,和一点花的芬芳。 5.世上没有绝望的处境,只有对处境绝望的人。 6.有人问我,如果看不到确定的未来,还要不好付出。我只能说,并不是每一种付出都是在追寻结果。有时在付出的路上,能够收获的,是清楚地看到了自我想要的,或者不想要的,这又何尝不是一 种宝贵的结果。命运会厚待温柔多情的人,好过冷漠的一颗心。 7.没有伞的孩子务必发奋奔跑! 8.失败是什么?没有什么,只是更走近成功一步;成功是什么?就 是走过了所有通向失败的路,只剩下条路,那就是成功的路。 9.坚信梦想是价值的源泉,坚信眼光决定未来的一切,坚信成功的信念比成功本身更重要,坚信人生有挫折没有失败,坚信生命的 质量来自决不妥协的信念。 10.人的生命要疯狂一次,无论是为一个人,一段情,一段旅途,或一个梦想。 11.只有十分十分年轻时,人们才能那么用力地,去喝酒交朋友 打人耳光,往人脸上泼酒,才能如此猛烈地摧残自我。青春期的人,动作总是变形的,每一样感情的流露都放大了一百倍,爱和恨,孤 独与喜悦,都是。 12.天再高又怎样,踮起脚尖就更接近阳光。
13.自我选取的路跪着也要把它走完。 14.不乱于心,不困于情,不畏将来,不念过往。如此,安好。 15.不好去追一匹马,用追马的时刻种草,待到来年春暖花开之时,就会有一批骏马任你选取。 1.只有经历过地狱般的折磨,才有征服天堂的力量。只有流过血的手指才能弹出世间的绝唱。 2.世界愈悲伤,我要愈快乐。当人心愈险恶,我要愈善良。当挫折来了,我要挺身应对。我要做一个乐观向上,不退缩不屈不饶不 怨天尤人的人,勇敢去理解人生所有挑战的人。 3.人生没有彩排,每一天都是现场直播。 4.每个人的性格中,都有某些无法让人理解的部分,再完美的人也一样。因此不好苛求别人,不好埋怨自我。玫瑰有刺,正因是玫瑰。 5.前有阻碍,奋力把它冲开,运用炙热的激情,转动心中的期盼,血在澎湃,吃苦流汗算什么。 6.人生太短,岁月太长。生活是公平的,要活出精彩,需要一颗奋进的心。以勤为本,以韧为基,尽自己的全力,求最好的结果, 行动成就梦想,奋斗成就人生。人生苦短,财富地位都是附加的, 生不带来死不带去,简单的生活就是快乐的生活。 7.“我羡慕你,但我还是做我自我!”——成熟的人生态度。 8.必须要有你所向往的生活,那将会是你最终得到的生活。 9.沉默不是冷漠,只是不想再让那些无关痛痒的人看到真实的自我。热闹的日子看不清未来,一个人也能独自盛开。 10.沉默不是冷漠,只是不想再让那些无关痛痒的人看到真实的 自我。热闹的日子看不清未来,一个人也能独自盛开。 11.没有一种不透过蔑视忍受和奋斗就能够征服的命运。
(九年级物理)能量(能量的转移和转化)
能量(能量的转移和转化) 【复习要点】: 要点(40):了解能量及其存在的不同形式,描述各种能量和生产生活的联系; 例题1:关于信息和能源,下列说法正确的是() A.电风扇工作时,电能主要转化为内能 B.目前的核电站是利用核裂变释放的核能工作的 C.煤、石油、风能、天然气等都是不可再生能源 D.能量在转移、转化过程中总是守恒的,我们无需节约能源 要点(41):通过实验,认识能量可以从一个物体转移到另一个物体,不同形式的能量可以互相转化; 例题2:随着智能手机的普及,人们的聊天方式也不断推陈出新,由于智能手机的待机时间很短,因此需要经常充电,当给电池充电时是将能转化成能.当手机正常使用时是将能转化成。将微风扇通电时它可以转动,这是将能转化成能,如果转动微风扇的风叶,还可以使与风扇插头相连的二极管发光,这是将 能转化成能。 要点(42):结合实例,认识功的概念。知道做功的过程就是能量转化或转 移的过程; 例题3:如图,在空气压缩引火仪玻璃筒的底部放一小撮干燥的棉絮,用力 将活塞迅速向下压,棉絮燃烧起来。此实验得到的结论是:对(选 填“棉絮”或“筒内气体”)做功,它的内能会增加,其能量转化情况与 单缸四冲程汽油机的冲程相同,若汽油机的转速是2400r/min,则此汽油机每秒对外做功次。
要点(43):知道动能、势能和机械能。通过实验,了解动能和势能的相互转化。举例说明机械能和其它形式能量的相互转化。 例题4:如图所示是演示点火爆炸的实验装置.按动电火花发生器的按钮,点燃盒内酒精,盒盖被打出去.在汽油机工作的四个冲程中,与此能量转化相同的冲程示意图是() 【反馈练习】: 1.以下说法正确的是() A.太阳能和核能都属于可再生能源 B.发光二极管主要使用的材料是超导体 C.热量不能自发地从低温物体传递给高温物体,说明能量转移具有方向性, D.飞 机的 机翼 做成 上面 凸起,下面平直.是因为流过机翼上方的空气流速大,压强大。 2.周末小明骑自行车去傅家边游玩.自行车下坡的过程中,为了减小车速,他捏紧车闸,这是通过的方法增大摩擦,此时刹车皮会发热,这是通过
正能量的励志句子100条
正能量的励志句子100条 1.踩着垃圾到达的高度和踩着金子到达的高度是一样的。 2.每天告诉自己一次:我真的很不错。 3.人生最大的挑战没过于战胜自己! 4.愚痴的人,一直想要别人了解他。有智慧的人,却努力的了解自己。 5.生命的道路上永远没有捷径可言,只有脚踏实地走下去。 6.只要还有明天,今天就永远是起跑线。 7.火把倒下,火焰依然向上。 8.认真可以把事情做对,而用心却可以做到完美。 9.宁可自己去原谅别人,莫等别人来原谅自己。 10.如果我们一直告诫自己要开心过每一天,就是说我们并不开心。 11.天气影响身体,身体决定思想,思想左右心情。 12.不论你在什么时候结束,重要的是结束之后就不要悔恨。 13.你把思考交给了电视,把联系交给了手机,把双腿交给了汽车,把健康交给了药丸。 14.不是某人使你烦恼,而是你拿某人的言行来烦恼自己。 15.人生要用简单的心境,对待复杂的人生,最无情的不是人,是时间;最珍贵的不是金钱,是情感;最可怕的不是失恋,是心身不
全;最舒适的不是酒店,是家里;最难听的不是脏话,是无言;最美好的不是未来,是今天。 16.在一切变好之前,我们总要经历一些不开心的日子,这段日子也许很长,也许只是一觉醒来。有时候,选择快乐,更需要勇气。 17.不要因为众生的愚疑,而带来了自己的烦恼。不要因为众生的无知,而痛苦了你自己。 18.如果你的生活已处于低谷,那就,大胆走,因为你怎样走都是在向上。 19.你可以哭但不能输,你可以难过但不可以落魄,你不努力怎么会知道自己可以赢得多少掌声?如果你能每天呐喊遍“我用不着为这一点小事而烦恼”,你会发现,你心里有一种不可思议的力量,试试看,很管用的。 20.我不敢休息,因为我没有存款。我不敢说累,因为我没有成就。我不敢偷懒,因为我还要生活。我能放弃选择,但是我不能选择放弃。坚强、拼搏是我唯一的选择。 21.生活不是用来妥协的,你退缩得越多,能让你喘息的空间就越有限。日子不是用来将就的,你表现得越卑微,一些幸福的东西就会离你越远。 22.过去的事,就让它过去吧,我们错过了昨日的日落,再也不能错过今日的日出,保持平衡的心态,以最美好的心情来对待每一天,每一天都会充满阳光,洋溢着希望。 23.一粒尘埃,在空气中凝结,最后生成磅礴的风雨;一粒沙石,
滨州市邹平县初中物理九年级全册14.3能量的转化和守恒练习题
滨州市邹平县初中物理九年级全册14.3能量的转化和守恒练习题 姓名:________ 班级:________ 成绩:________ 一、练习题 (共12题;共25分) 1. (2分)某品牌手机充电宝,上面标有电压为5V,容量为12000mA?h,它充满电后,可以储存的电能是________J,在充电过程中,将电能转化为________能储存. 2. (2分)大量事实证明“永动机”是不可能存在的,因为它违背了________定律。热机的效率总是会________1.(填“大于”“小于”或“等于”) 3. (2分)木材燃烧是将化学能转化为________能,这一过程能量的总量将________(填变大、变小或不变). 4. (3分) 2017年1月5日19时45分,西昌卫星发射中心用长征三号运载火箭,成功发射两颗北斗三号全球组网卫星。预计到22018年底,将有18颗北斗卫星发射升空,服务区覆盖“一带一路”沿线国家及周边国家,长征三号乙运载火箭起飞过程中燃料燃烧释放的内能将转化为火箭的________能,加速上升过程中受到________(选填“平衡力”或“非平衡力”)作用,北斗卫星与地面之间通过________传递信息。 5. (2分)(2020·绵阳模拟) 如图甲所示,小明在吹气球时,被吹大了的气球没能用手握住,呼啸着飞了出去,若他及时捡拾起气球,将会感觉到它喷气的嘴部温度和原来相比________(选填“变高”、“变低”或“没有变化”),发生的能量转化与汽油机的________冲程的能量转化是一致的。 6. (2分)关于热机中的能量转化关系,下列说法中正确的是() A . 热机是将机械能转化为内能的机器 B . 热机是将内能转化为机械能的机器 C . 热机是将燃料的化学能转化为机械能的机器 D . 热机是利用化学能来做功,它是将化学能转化为内能 7. (2分) (2017九上·广州月考) 如图所示,在一个配有活塞的厚壁玻璃筒里放一小团硒化棉布,用力把活塞迅速下压,棉花就会立即燃烧.根据该实验现象,下列结论正确的是()
关于拼搏的人生的正能量励志句子合集
关于拼搏的人生的正能量励志句子合集 大家要始终相信一句话:只要更好,不求最好!奋斗是成功之父! 1.人生有几件绝对不能失去的东西:自制的力量,冷静的头脑,希望和信心。 2.买得起自己喜欢的东西,去得了自己想去的地方,不会因为身边人的来或走损失生活的质量,反而会因为花自己的钱,来得更有底气一些,这就是应该更努力的原因。 3.最珍贵的不是你现在有多好,而是经过努力,每一天的自己都比之前更好。 4.你是老师的百分之一,是父母的百分之五十,但却是你自己的百分之百,所以要非常非常努力,去追求自己想要的一切。 5.不要去拒绝忙碌,因为它是一种充实;不要去抱怨挫折,因为它是一种坚强;不要去拒绝微笑,因为爱笑的女孩最美。你的优秀,不需要任何人来证明。 6.人有两条路要走,一条是必须走的,一条是想走的,你必须把必须走的路走漂亮,才可以走想走的路。 7.愿你沉稳又执着,对热爱的事情都全力以赴,又满载而归。 8.一件事如果想做,就早点下定决心。拖一天就纠结一天,早一天就多赚一天。 9.自己喜欢的日子,就是最美的日子;适合自己的生活,是最好的活法。
10.安全感不是别人给的,它取决于你有多爱自己,吃饱穿暖,手机有电,钱包永远不扁。 11.成功的人懂得熬,失败的人懂得逃,卓越的人懂得迎风前行并思考!其实放弃和坚持就在一瞬间,扛住了,世界就是你的。 12.做人要抬头有勇气,面对现实。低头有底气,面对自己。做事要有骨气,据理力争。做人要有志气,铮铮铁骨。凡事要争气。 13.在哪里跌倒,就在哪里站起来,所有不能打败你的,都会促成你的成长。 14.不要用自己的时间去见证别人的成功,愿你走过的所有弯路,最后都成为美丽彩虹! 15.没有谁的幸运,凭空而来。只有当你足够努力,你才会足够幸运,这世界不会辜负每一份努力和坚持。 16.有能力的人影响别人,没能力的人受人影响;不是某人使自己烦恼不安,而是自己拿某人的言行来烦恼自己;树一个目标,一步步前行,做好自己就好。 17.雄鹰,不需鼓掌,也在飞翔;小草,没人心疼,也在成长;野花,没人欣赏,也在芬芳;做事不需人人都理解,只需尽心尽力;做人不需人人都喜欢,只需坦坦荡荡。 18.努力到无能为力,拼搏到感动自己;吃过的苦,受过的累,会照亮未来的路;没有年少轻狂,只有胜者为王。 19.真正成功的人生,不在于成就的大小,而在于你是否努力地去实现自我,喊出自己的声音,走出属于自己的道路。 20.选一个方向,定一个时间;剩下的只管努力与坚持,时间
正能量激励人奋斗上进的好句子
正能量激励人奋斗上进的好句子也许你想成为太阳,可你却只是一颗星辰;也许你想成为大树,可你却是一棵小草。于是,你有些自卑。其实,你和别人一样,也是一片风景:做不了太阳,就做星辰,在自己的星座发光发热;做不了大树,就做小草,以自己的绿色装点希望…… 行走红尘,别被欲望左右迷失了方向,别被物质打败做了生活的奴隶,给心灵腾出一方空间,让那些够得着的幸福安全抵达,攥在自己手里的,才是实实在在的幸福。 如果寒暄只是打个招呼就了事的话,那与猴子的呼叫声有什么不一样呢?事实上,正确的寒暄务必在短短一句话中明显地表露出你对他的关怀。 人活着,要有所追求,有所梦想,要生活得开心,快乐,这才是理想的人生。上天给我们机会,让我们来到世间走一遭,我们要珍惜,因为生命是如此的短暂,如果我们不知道珍惜,它将很快的逝去,到头来我们将一事无成。 要成功,就要时时怀着得意淡然失意坦然的乐观态度,笑对自己的挫折和苦难,去做,去努力,去争取成功!
人生是坎坷的,人生是崎岖的。我坚信:在人生中只有曲线前进的快乐,没有直线上升的成功。只有珍惜今天,才会有美好的明天;只有把握住今天,才会有更辉煌的明天!人生啊,朋友啊!还等什么?奋斗吧! 认定了的路,再痛也不要皱一下眉头,你要知道,再怎么难走都是你自己选的,你没有资格喊疼。到最后,你总会明白,谁是虚心假意,谁是真心实意,谁为了你不顾一切。不去期望,失去了不会伤心,得到了便是惊喜。对于过去,不可忘记,但要放下。因为有明天,今天永远只是起跑线。 敏感之人,遭遇一点风声也会千疮百孔。命运给每个人同等的安排,而选择如何经营自己的生活,酿造自己的情感,则在于自己的心性。人生应该活得舒心。人生,就是不断的面对,人生很残酷,错过的,不要奢望还会重来,放下了,才知道它的沉重,今天不做的事,往后可能永远没有机会。 恐惧自我受苦的人,已经正因自我的恐惧在受苦。 夫妇一条心,泥土变黄金。 用心的人在每一次忧患中都看到一个机会,而消极的人则在每个机会都看到某种忧患。
激励励志正能量句子50个
激励励志正能量句子50个 导读:1、哪有什么错过的人,会离开的都是路人。愿你脚踏实地,也愿你仰望星空,往事不回头,未来不将就! 2、小黄人没有肩膀照样穿背带裤,没耳朵照样戴眼镜啊,别老埋怨你的世界缺点什么。 3、环境永远不会十全十美,消极的人受环境控制,积极的人却控制环境。 4、我不怕别人在背后捅我一刀,我怕回头后看到背后捅我的人,是我用心对待的人;我不怕把心里话告诉最好的朋友,我怕回过头他把它当成笑话告诉别人。 5、走不下去到时候停下来想想,总会找到坚持下去的理由。 6、这世界上最强大的人,就是那些能一个人孤单生活的人。 7、人与人之间的距离,要保持好,太近了会扎人,太远了会伤人。 8、别总是抱怨生活不够幸运,是你欠了生活一份努力,每一个你讨厌的现在,都有一个不够努力的曾经,未来美不美,取决于你现在拼不拼。 9、高一步立身,退一步处世。 10、人生没有如果,只有后果和结果。少问别人为什么,多问自己凭什么。现在不玩命,将来命玩你,现在不努力,未来不给力。现在不努力,将来拿什么向曾经抛弃你的人证明它有多瞎!
11、不管失败多少次,都要面对生活,充满希望。竹根即使被埋在地下无人得见,也决然不会停止探索而力争冒出新笋。希望,只有和勤奋作伴,才能如虎添翼。 12、世上没有白费的努力,也没有碰巧的成功,一切无心插柳,其实都是水到渠成。人生没有白走的路,也没有白吃的苦,跨出去的每一步,都是未来的基石与铺垫。 13、其实,没有过不去的事情,只有过不去的心情。很多事情,我们之所以过不去,是因为我们心里放不下。比如被欺骗了,报复放不下,被讽刺了,怨恨放不下,被批评了,面子放不下。 14、做个内心向阳的人。不忧伤,不心急。坚强、向上,靠近阳光。 15、成功不是将来才有的,而是从决定去做的那一刻起,持续累积而成。 16、梦想不会让一个人瞬间伟大,而是让生活拥有色彩和希望。只要你愿意努力,只要你相信,总有一天你会同样熠熠发光。 17、每个人的背后都会有心酸,都会有无法言说的艰难。每个人都会有自己的泪要擦,都会有自己的路要走。 18、人生的路漫长而多彩,在阳光中我学会欢笑,在阴云中我学会坚强;在狂风中我抓紧希望,当我站在终点回望,我走出了一条属于我的人生之路。 19、坚持不一定成功,但不坚持一定不会成功,并不是井里没水,