FRM2012数量分析(习题)
QUANTITATIVE ANALYSIS
1.Assume you have a portfolio of 10 obligors that are not correlated. Given that each obligor's
probability of default is 5%, what is the probability that no defaults will occur over the next year?
A. 5.0%
B.50.0%
C.60.0%
D.95.0%
2.The annual marginal probability of default of a bond is 15% in year 1 and 20% in year 2.
What is the probability of the bond surviving (i.e. no default) to the end of two years?
A.68%
B.65%
C.80%
D.85%
3. A portfolio of bonds consists of five bonds whose default correlation is zero. The one-year
probabilities of default of the bonds are: 1%, 2%, 5%, 10% and 15%. What is the one-year probability of no default within the portfolio?
A.71%
B.67%
C.85%
D.99%
4.The characteristic function of the product of independent random variables is equal to the:
A.square root of the product of the individual characteristic functions
B.product of the individual characteristic functions
C.exponential root of the product of the individual characteristic functions
D.sum of the individual characteristic functions
5.An investor is choosing one of twenty securities. Ten of the securities are stocks and ten are
bonds. Four of the ten stocks were issued by utilities; the other six were issued by industrial firms. Two of the ten bonds were issued by utilities; the other eight were issued by industrial firms. If the investor chooses a security at random, the probability that it is a bond or a security issued by an industrial firm is:
A.0.80
B.0.70
C.0.60
D.0.50
6.Dependent random variables are defined as variables where their joint probability is:
A.equal to zero
B.not equal to the product of their individual probabilities
C.greater than the product of their individual probabilities
D.equal to the product of their individual probabilities
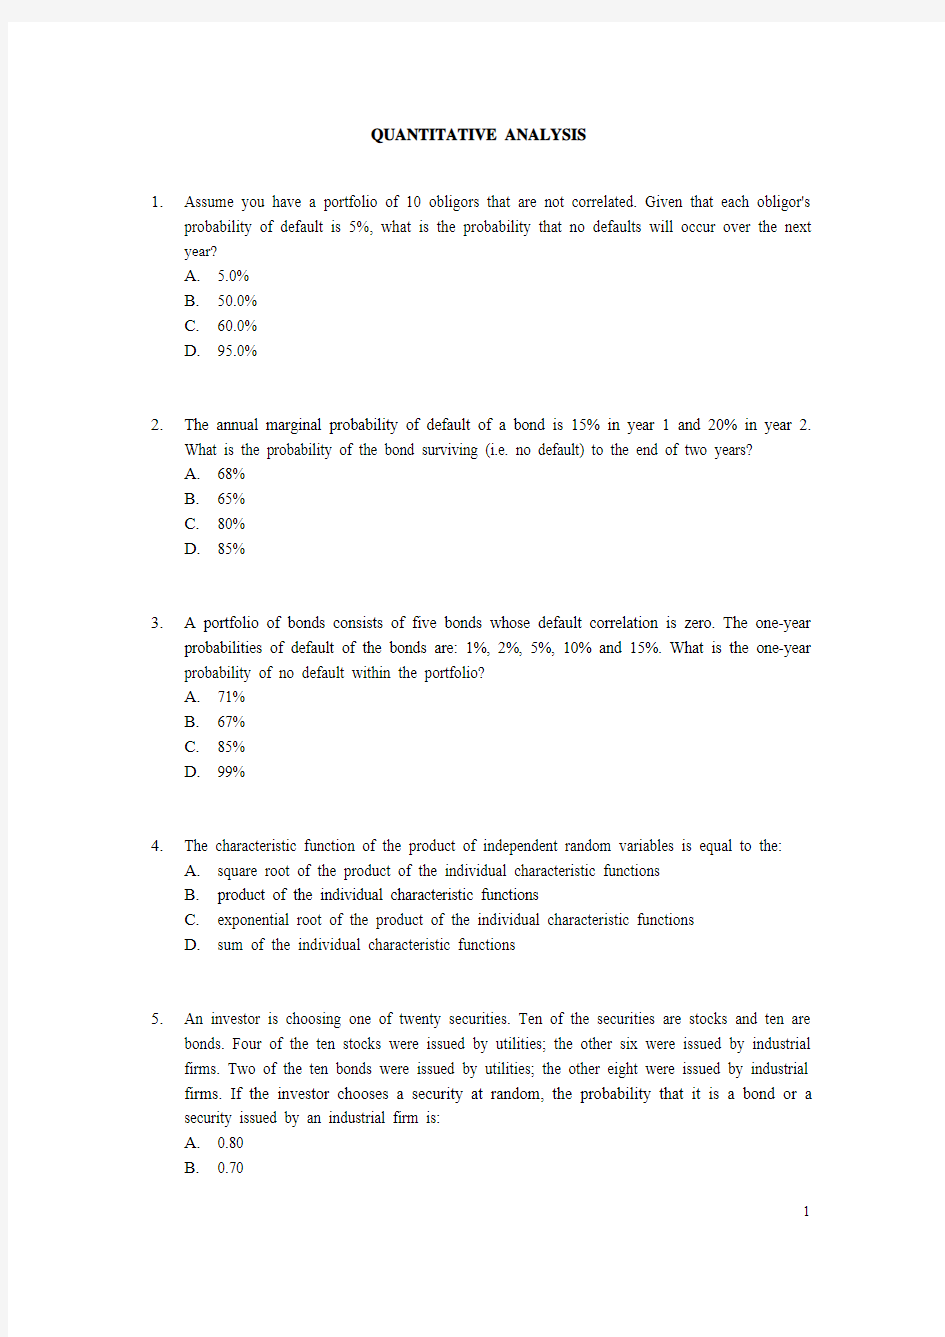
7.Given the following data for a market variable, what is the best estimate of its variance?
Probability Value
24% -12
40% 4
36% 14
A. 6
B.10
C.32
D.97
8.An analyst is studying a stock that is currently trading at $35. The analyst estimates that there
is 33% probability that the stock will trade at $50 after one year, a 20% probability that the stock will trade at $42, and a 47% probability that the stock will trade at $20. What is the volatility of this stock price?
A.13%
B.24%
C.31%
D.39%
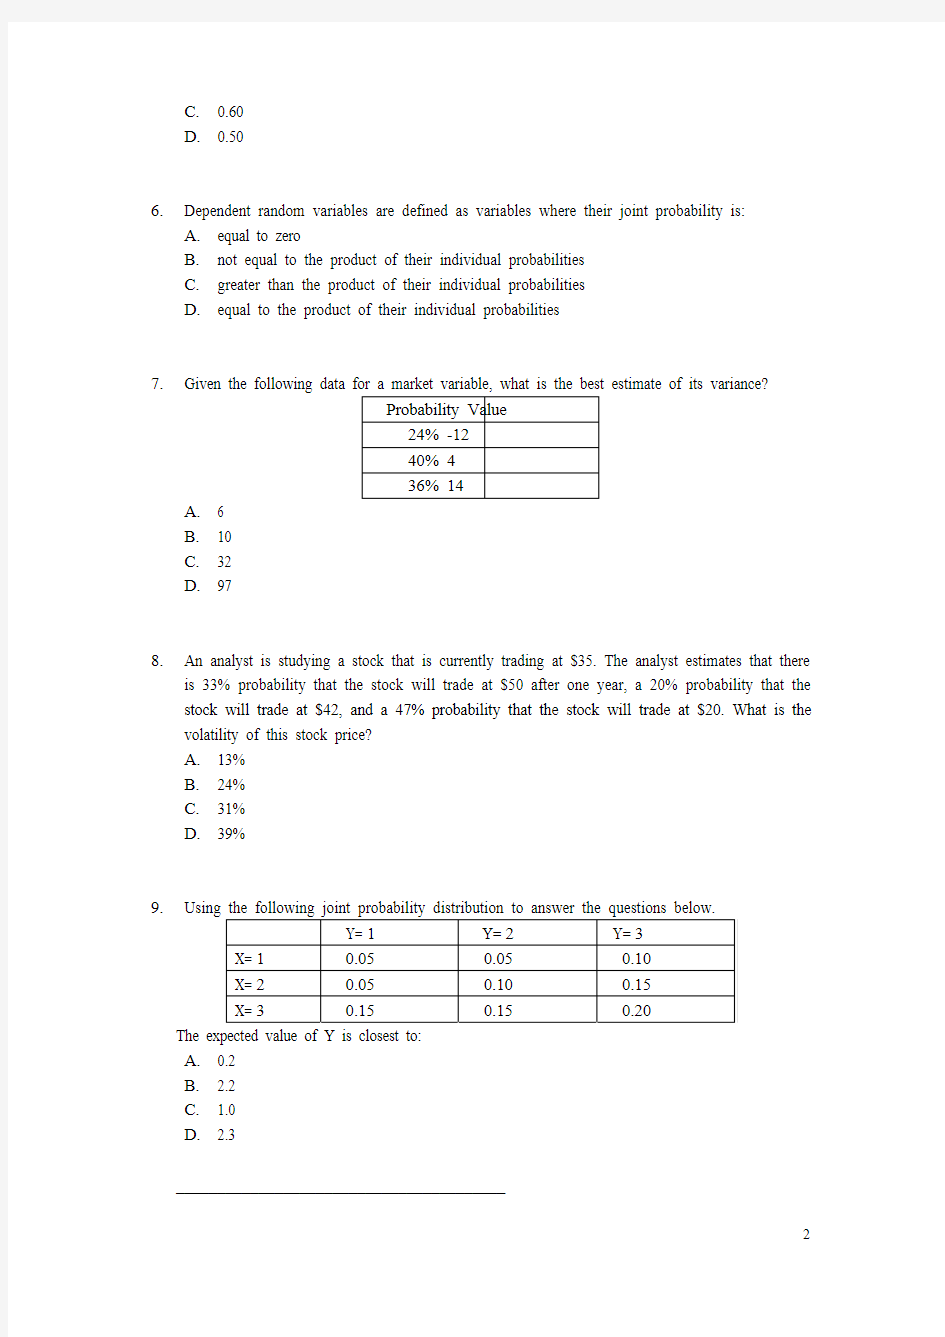
https://www.360docs.net/doc/ec3304610.html,ing the following joint probability distribution to answer the questions below.
Y=1 Y=2 Y=3
X=1 0.05 0.05 0.10
X=2 0.05 0.10 0.15
X=3 0.15 0.15 0.20
The expected value of Y is closest to:
A.0.2
B. 2.2
C. 1.0
D. 2.3
________________________________________
If you know that Y is equal to 2, the probability that X is equal to 1 is closest to:
A.0.05
B.0.25
C.0.20
D.0.17
________________________________________
The variance of X is closest to:
A.0.54
B.0.67
C.0.74
D.0.61
10.Given two random variables X and Y, what is the Variance of X given Variance[Y] = 100,
Variance [4X - 3Y] = 2,700 and the correlation between X and Y is 0.5?
A.56.3
B.113.3
C.159.9
D.225.0
11.You are given that X and Y are random variables, and each of which follows a standard
normal distribution with Covariance (X, Y) = 0.4. What is the variance of (5X + 2Y)?
A.11.0
B.29.0
C.29.4
D.33.0
12.Suppose returns are uncorrelated over time. You are given that the volatility over two days is
1.20%. What is the volatility over 20 days?
A.0.38%
B. 1.20%
C. 3.79%
D.12.0%
13.What is the covariance between populations A and B?
A B
17 22
14 26
12 31
13 29
B. 6.50
C.-3.61
D. 3.61
14.The covariance between variable A and variable B is 5. The correlation between A and B is
0.50. If the variance of A is 12, what is the variance of B?
A.10.00
B. 2.89
C.8.33
D.14.40
15.Which one of the following statements about the correlation coefficient is FALSE?
A.It always ranges from –1 to +1
B. A correlation coefficient of zero means that two random variables are independent
C.It is a measure of linear relationship between two random variables
D.It can be calculated by scaling the covariance between two random variables
16. A portfolio contains two perfectly negatively correlated investments with volatilities of 5%
and 7%. The proportion of these two securities that would lead to the lowest risk are:
A.58% and 42%
B.42% and 58%
C.34% and 66%
D.66% and 34%
17.Which statement best describes correlations and variances in times of financial crisis?
A.There are only marginal changes in correlations and variances in times of crisis and
therefore they do not need to be factored into risk management.
B.The diversification benefits decrease as correlations increase and therefore your risk
level increases.
C.The diversification benefits increase as correlations decrease and therefore your risk
level decreases.
D.VaR estimates using the Riskmetrics approach provide for the effects of increased
correlations during periods of crisis and therefore the effects are factored into current
positions.
18.The probability that an observation lies within 3 standard deviations of the mean for any
probability distribution is at least:
A.75%
C.89%
D.54%
19.The probability of an outcome being between 10 and 30 for a random variable that follows a
continuous uniform distribution over the range of 0 to 40 is closest to:
A.0.2
B.0.5
C.0.4
D.0.8
20.Given that a stock price rises on two days out of five and falls on three days out of five, what
is the probability that it will rise on exactly seven out of the next eight days?
A.0.8%
B. 4.5%
C.9.0%
D.12.0%
21.An analyst has determined that the probability that the S&P 500 index will increase on any
given day is 0.60 and the probability that it will decrease is 0.40. The expected value and variance of the number of up days in a 5-day period are closest to:
A. 3.0 and 1.2
B. 3.0 and 1.1
C. 2.0 and 0.5
D. 2.0 and 2.1
22.Which of the following statements are TRUE?
I.The sum of two random normal variables is also a random normal variable.
II.The product of two random normal variables is also a random normal variable.
III.The sum of two random lognormal variables is also a random lognormal variable.
IV.The product of two random lognormal variables is also a random lognormal variable.
A.I and II only
B.II and III only
C.III and IV only
D.I and IV only
23.Which of the following statements best characterizes the relationship between the normal and
lognormal distributions?
A.The lognormal distribution is the logarithm of the normal distribution
B.If the natural log of the random variable X is lognormally distributed, then X is normally
distributed
C.If X is lognormally distributed, then the natural log of X is normally distributed
D.The two distributions have nothing to do with each other
24.If a distribution with the same variance as a normal distribution has kurtosis greater than 3,
which of the following is TRUE?
A.It has fatter tails than normal distribution
B.It has thinner tails than normal distribution
C.It has the same tail fatness as the normal distribution since, variances are the same
D.Cannot be determined from the information provided
25.For a standard normal distribution, what is the approximate area under the cumulative
distribution function between the values -1 and 1?
A.50%
B.66%
C.75%
D.95%
26.Consider a stock with an initial price of $100. Its price one year from now is given by S =
100*exp(r), where the rate of return r is normally distributed with a mean of 0.1 and a standard deviation of 0.2. With 95% confidence, after rounding, S will be between:
A.$67.57 and $147.99
B.$70.80 and $149.20
C.$74.68 and $163.56
D.$102.18 and $119.53
27.Which of the following are characteristics of a normal distribution?
I. Skewness equals to zero
II. Mean less than median
III. Kurtosis greater than zero
IV. Continuous and unbounded
A.I and IV
B.II and III
C.I, II and III
D.I, III and IV
28.Which of the following statements is the most accurate about the relationship between a
normal distribution and a Student's t-distribution that have the same mean and standard
deviation?
A.They have the same skewness and the same kurtosis
B.The Student's t-distribution has larger skewness and larger kurtosis
C.The kurtosis of a Student's t-distribution converges to that of the normal distribution as
the number of degrees of freedom increases
D.The normal distribution is a good approximation for the Student's t-distribution when the
number of degrees of freedom is small
29. A call center receives an average of two phone calls per hour. The probability that they will
receive 20 calls in an 8-hour day is closest to:
A. 5.59%
B.16.56%
C. 3.66%
D. 6.40%
30.It is often said that distributions of returns from financial instruments are leptokurtotic. For
such distributions, which of the following comparisons with a normal distribution of the same mean and variance MUST hold?
A.The skewness of the leptokurtotic distribution is greater
B.The kurtosis of the leptokurtotic distribution is greater
C.The skewness of the leptokurtotic distribution is smaller
D.The kurtosis of the leptokurtotic distribution is smaller
31. A bank would like to estimate the number of operational risk events due to problems with
tellers (large mistakes, fraud, and so on). The bank decides to model teller operational risk events as a Poisson process with rate λ(number of events per year). With this model, teller operational risk events are assumed to occur independently of one another and the number of teller operational risk events in a year is Poisson distributed with mean λ. Other properties of a Poisson distribution with mean λ include:
Variance: λ
λ?
Skewness: 0.5
Excess Kurtosis: 1/λ
Based on historical data regarding the number of teller operational risk events that occurred in previous years, the bank determines that the average number of events has been 5 per year and decides to set λto 5. Which of the following is true regarding that model?
A.The corresponding exponential distribution that describes the time between two teller
operational risk events has a mean value of 0.25 years.
B.The variance of the number of teller operational events in a year is 25.
C.The number of teller operational risk events in a year cannot exceed 25.
D.The model is not appropriate if a teller is more likely to have an operational risk event
because his friend who is also a teller has been caught stealing.
32.Assume the true distribution of returns is leptokurtotic. If we assume normality when we
calculate the VaR, then which of the following statements is true:
A.The 95% VaR is overstated.
B.The 95% VaR is understated.
C.The 95% VaR is appropriate.
D.We cannot state the relationship between the true VaR and the calculated VaR.
33.The last three year-end returns for a stock are 5%, –2%, and 1%. Using an arithmetic mean,
the sample standard deviation is closest to:
A. 3.51%
B. 2.87%
C. 1.33%
D. 3.11%
34.The mean equity risk premium over a 40-year period is equal to 8.0%. The standard deviation
of the sample is 12%. The standard error of the sample mean is closest to:
A.0.30%
B. 1.90%
C. 1.26%
D.8.00%
35.The mean age of the 80 employees in a company is 35 and the standard deviation is 15.
Assuming that the ages are normally distributed and using 95% confidence level, we can say that the employees within the firm fall between:
A.20.0 and 50.0 years
B.31.7 and 38.3 years
C.33.8 and 36.2 years
D.34.6 and 35.4 years
36.Which of the following statements are NOT true?
I. Type I error occurs when the null hypothesis is not rejected when it is actually false.
II. Type II error occurs when the null hypothesis is rejected when it is actually true.
III. Type I error occurs when the alternate hypothesis is wrongly accepted.
IV. Minimizing the probability of Type II error maximizes the power of the test.
A.I and II
B.I and III
C.II and IV
D.I, II and IV
37.According to the Basel backtesting framework guidelines, penalties start to apply if there are
five or more exceptions during the previous year. The Type I error rate of this test is 11%. If the true coverage is 97% of exceptions instead of the required 99%, the power of the test is 87%. This implies that there is a (an):
A.89% probability regulators will reject the correct model
B.11% probability regulators will reject the incorrect model
C.87% probability regulators will not reject the correct model
D.13% probability regulators will not reject the incorrect model
38.An analyst wants to test whether the standard deviation of return from pharmaceutical stocks
is lower than 0.2. For this purpose, he obtains the following data from a sample of 30 pharmaceutical stocks. Mean return from pharmaceutical stocks = 8%. Standard deviation of return from pharmaceutical stocks = 12%. Mean return from the market = 12%. Standard deviation of return from the market = 16%. What is the appropriate test statistic for this test?
A.t-statistic
B.z-statistic
C.F-statistic
D.Chi-squared statistic
39.If the sample size is greater than 30 and population variance is unknown, the appropriate test
for the sample mean is the:
A.t-test
B.z-test
C.p-test or F-test
D.t-test or z-test
https://www.360docs.net/doc/ec3304610.html,ing a sample size of 61 observations, an analyst determines that the standard deviation of
the returns from a stock is 21%. Using a 0.05 significance level, the analyst:
A.can conclude that the standard deviation of returns is higher than 14%
B.cannot conclude that the standard deviation of returns is higher than 14%
C.can conclude that the standard deviation of returns is not higher than 14%
D.none of the above
41.An analyst is given the task of determining whether a group of 16 active portfolio managers
have achieved a significantly higher performance (using a significance level of 0.05) than the average for all portfolio managers over a certain period. Over the period of the study, the active portfolio managers achieved a mean return of 15%. Over the same period the mean return for all portfolio managers was 12% and their standard deviation was 8%. The correct conclusion from this study is that:
A.the performance of active portfolio managers is significantly higher than the average for
all portfolio managers
B.the performance of active portfolio managers is not significantly higher than the average
for all portfolio managers
C.the performance of active portfolio managers is significantly lower than the average for
all portfolio managers
D.the performance of active portfolio managers is the same as the average for all portfolio
managers
42.Suppose the standard deviation of a normal population is known to be 10 and the mean is
hypothesized to be 8. Suppose a sample size of 100 is considered. What is the range of sample means that allows the hypothesis to be accepted at a level of significance of 0.05?
A.Between -11.60 and 27.60
B.Between 6.04 and 9.96
C.Between 6.355 and 9.645
D.Between -8.45 and 24.45
43.Under what circumstances could the explanatory power of regression analysis be overstated?
A.The explanatory variables are not correlated with one another.
B.The variance of the error term decreases as the value of the dependent variable
increases.
C.The error term is normally distributed.
D.An important explanatory variable is omitted that influences the explanatory variables
included, and the dependent variable.
44.Many statistical problems arise when estimating relationships using regression analysis. Some of
these problems are due to the assumptions behind the regression model. Which one of the following is NOT one of these problems?
A.Stratification
B.Multicollinearity
C.Heteroscedasticity
D.Autocorrelation
45. An analyst is seeking to generate a simple linear regression equation that will allow him to
estimate the returns of a beverage company’s stock against the returns of the S&P 500. The analyst has compiled the following information:
S&P 500σ= 16.4%;beverage company σ= 22.0% ; ρ = 0.82
mean annual return S&P 500 = 8.2%; risk-free interest rate = 4.0%
What is the slope coefficient of the regression equation?
A. 1.85
B. 1.10
C. 2.34
D. 0.80
46. A simple linear regression of a stock’s returns on an industry index provides the following
results:
Coefficient Standard Error
Intercept 4.2 2.66
Industry Index 2.4 0.65
Sum of Squared Regression 998.56
Sum of Squared Errors 180.37
Sum of Squared Total 1,178.93
Assume that the sample has 8 years of quarterly observations.
Which of the following statements regarding the interpretation of the regression is (are) CORRECT?
I. The coefficient of determination is 84.7%.
II. The industry index coefficient is significant at the 99% confidence level.
III. The correlation coefficient between the stock’s returns and the return on the industry
index is 0.42.
IV . The correlation coefficient between the stock’s returns and the return on the industry
index is statistically different from zero at the 99% confidence level.
A. II and IV only
B. I and II only
C. I, II, and IV only
D. I only
47. You need to update a daily volatility forecast using the RiskMetrics TM exponential method
with a decay factor of 0.97. Yesterday's forecast of standard deviation was 1%. Given that you just observed a return of 2%, what will be the new forecast of standard deviation?
A. 1.030%
B. 1.044%
C. 1.970%
D. 1.977%
48. Which of the following GARCH models will take the shortest time to revert to its mean?
A. t h = 0.05 + 0.0321t r
?+ 0.961t h ? B. t h = 0.03 + 0.0221t r
?+ 0.951t h ? C. t h = 0.02 + 0.0121t r
?+ 0.971t h ? D. t h = 0.01 + 0.0121t r
?+ 0.981t h ?
49. A risk manager estimates daily variance(t h )using a GARCH model on daily
returns(t r ):112
t=01t t r h ααγβ??++Assume the model parameter values are
0α=0.005, 1α=0.04, β=0.94. The long-run annualized volatility is approximately
A.
13.54% B.
7.94% C.
72.72% D. 25.00%
50. Consider the following GARCH model estimated using daily return data:
11296.003.005.0??++=t t t h r h
Which of the following statements are correct?
i. The persistence factor of the model is 0.99.
ii. The long-run average daily variance is 5.
iii. The model does not have a long-run average variance.
iv. Given ht, is 6, the forecast of conditional variance for day t+1 is 5.99.
A. Only I and II
B. Only l and Ill
C. I and lV
D. I, II and IV
51. You have implemented the simulation process using a time interval Δt = 0.001, and you are
analyzing the following stock price path generated by your implementation.
Given this sample, which of the following simulation steps most likely contains an error?
A.Calculation to update the stock price
B.Generation of random sample value for ε
C.Calculation of the change in stock price during each period
D.None of the above
52.Which of the following statements about Extreme Value Theory (EVT) and its application to
value at risk are true?
I.EVT extends the Central Limit Theorem to the distribution of the tails of independent,
identically distributed random variables drawn from an unknown distribution.
II.For empirical stock market data, the shape parameter in EVT is negative implying tails that disappear more rapidly than a normal distribution.
III.EVT can help avoid a shortcoming of the historical simulation method which may have difficulty calculating VaR reliably due to a lack of data in the tails.
IV.For empirical stock market data, standard value at risk estimates at the 95% confidence level are exceeded more often than 5% of the time and would therefore benefit from the
use of extreme value theory.
A.I and III
B.II and IV
C.I, III and IV
D.III and IV
53.Which of the following statement is FALSE regarding the implementation of MC simulation
for V AR?
I MC simulation involves the creation of a distribution of pricing paths created
via a random generation procedure
II After samples are made, a pricing model is used to determine financial values
III MC simulation uses actual market movements of past price data.
A.I only
B.II only
C.I and III
D. I, II and III
54. A risk manager has been requested to provide some indication of accuracy of a Monte Carlo
simulation. Using 1,000 replications of a normally distributed variable S, the relative error in the one-day 99% VaR is 5%. Under these conditions,
A. Using 1,000 replications of a long option position on S should create a larger relative
error.
B. Using 10,000 replications should create a larger relative error.
C. Using another set of 1,000 replications will create an exact measure of 5.0% for relative
error.
D. Using 1,000 replications of a short option position on S should create a larger relative
error.
55. In pricing a derivative using the Monte Carlo method, we need to stimulate a reasonable
number of paths for the price of the underlying asset. Suppose we use a simple model for the return of the underlying asset:
()()t y t drift vol e t =?Δ+,and e (t) is distributed ~ N (0,1)
Where drift and vol are known parameters and ?t is a step size. The generation of each path
requires a number of steps. Which of the following describes the correct procedure?
A. Generate a random number from a normal distribution N (0,1), use the cumulative
normal function to get e (t), which will be fed into the model to get y(t). Repeat the same procedure until you get the full desired path.
B. Generate a random number from a normal distribution N (0,1), use the inverse normal
function to get e (t), which will be fed into the model to get y (t). Repeat the same procedure until you get the full desired path.
C. Generate a random number from a uniform distribution defined in [0,1], use the
cumulative normal function to get e (t), which will be fed into the model to get y(t). Repeat the same procedure until you get the full desired path.
D. Generate a random number from a uniform distribution defined in [0,1], use the inverse
cumulative normal function to get e (t), which will be fed into the model to get y(t). Repeat the same procedure until you get the full desired path.
数量分析方法模拟试题三 (1)
商务统计方法模拟试题三 一、判断题 1、定义数据结构是在数据视窗中进行的。() 2、在进行二项分布检验时,要求检验变量必须是二值变量。() 3、Kendall相关系数适用于度量定类变量间的线性相关关系。() 4、非参数检验要求样本来自的总体服从或近似服从正态分布。() 5、配对样本中个案个数一定是相同的。() 6、在SPSS数据文件中,一行代表一个个案(case)。() 7、单样本t检验也可用于对总体比率进行检验。() 8、在进行方差分析时,若总方差主要是由组内方差引起的,则会拒绝原假设。() 9、二值变量序列中,游程数最小为1.() 10、变量值越大,对应的秩就会越小。() 二、单项选择题 1、SPSS数据文件默认的扩展名() A、.sps B、.spo C、.sav D、.rtf 2、在SPSS的运行方式中,最常见,对初学者最适用的方式是() A、程序运行方式 B、完全窗口菜单方式 C、混合运行方式 D、联机帮助方式 3、面对100份调查问卷,在进行SPSS数据输入时,应采用() A、原始数据的组织方式 B、计数数据的组织形式 4、下列关于变量名的取名规则的说法,不正确的是() A、变量名的字符数不能超过8个 B、变量名不区分大小写字母 C、“3G”是一个合法的变量名 D、变量名可以以汉字开头 5、在定义数据结构时,Label是指定义() A、变量名 B、变量名标签 C、变量值标签 D、变量类型 6、“年龄”这个变量属于() A、定类型变量 B、定序型变量 C、定距型变量 7、欲插入一个个案,应选择的一级菜单是() A、File B、Edit C、View D、Data 8、在横向合并时,[Excluded V ariables]框中的变量是() A、两个待合并的数据文件中的所有变量 B、合并后新的数据文件中包括的变量 C、合并后新的数据文件中不包括的变量 D、第二个待合并的数据文件中的变量 9、如果只想对收入大于5000或者职称不小于4级的职工进行计算,应输入的条件表达式是() A、收入>5000or 职称>4 B、收入>5000and 职称>4 C、收入>5000 or not(职称>4) D、收入>5000 or not(职称<4) 10、希望从全部231个个案中随机选出32个个案,应采用的选取方式是() A、指定条件选取 B、近似选取 C、精确选取 D、过滤变量选取 11、分类汇总中,默认计算的是各分类组的()
层次分析法作业答案(借鉴分享)
你已经去过几家主要的摩托车商店,基本确定将从三种车型中选购一种。你选择的标准主要有:价格,耗油量大小,舒适程度和外表美观情况。经反复思考比较,构造了它们的成对比较矩阵为 ??? ?? ? ??????13155187313151815 17131 三种车型(记为a,b,c)关于价格,耗油量,舒适程度及你对他们外观喜欢程度的成对比较矩阵为 (价格)??????????121321213121 (耗油量)???? ? ?????127151712151 (舒适程度)??????????141531415131 (外观)?? ?? ??????17153171315 1 (1)根据上述矩阵可以看出这四项标准在你的心目中的比重是不同的,请按由大到小的顺序排出。 (2)哪辆车最便宜,哪辆车最省油,哪辆车最舒适,你认为哪辆车最漂亮? 用层次分析法确定你对这三种车型的喜欢程度(用百分比表示)。比
建模过程如下: 先构建成对比较矩阵 1378111552311133751114 853x x x x ?????? ???? ?????? 1???? A = 列向量归一化,得到矩阵 B=0.6245 0.68180.52500.47060.20820.22730.37500.29410.08920.04550.07500.17650.0781 0.04550.02500.0588?? ??? ? ?? ? ??? ??? ? ??,然后按行求和得到矩阵C = 2.30191.10460.38620.2074?? ???????????????? ,再对矩阵C = 2.30191.10460.38620.2074??????????????????归一化得到w =0.57530.27610.09650.0518???????? ??????????, 2.49401.20970.38940.2111*?A w ???? ? ??????? =1/4 2.4940/0.5753 1.2097/0.27610.3894/0.09650.2111/0.0518 1.2068 μ=?+++=()同理,可求得下面四个比较矩阵权向量和最大特征根。 (价格B1) (耗油量B2)
层次分析法例题(1)
层次分析法在最优生鲜农产品流通中的应用 班级 (一)、建立递阶层次结构 目标层:最优生鲜农产品流通模式。 准则层:方案的影响因素有:1c 自然属性、2c 经济价值、3c 基础设施、5c 政府政策。 方案层:设三个方案分别为:1A 农产品产地一产地批发市场一销地批发市场一消费者、2A 农产品产地一产地批发市场一销地批发市场一农贸市场一消费者、3A 农业合作社一第三方物流企业一超市一消费者(本文假设农产品的生产地和销地不在同一个地区)。 。 目标层: 准则层: 方案层:
图3—1 递阶层次结构 (二)、构造判断(成对比较)矩阵 所谓判断矩阵昰以矩阵的形式来表述每一层次中各要素相对其上层要素的相对重要程度。为了使各因素之间进行两两比较得到量化的判断矩阵,引入1~9的标度,见表 为了构造判断矩阵,作者对6个专家进行了咨询,根据专家和作者的经验,四个准则下的两两比较矩阵分别为:
(三)、层次单排序及其一致性检验 层次单排序就是把本层所有要素针对上一层某一要素,排出评比的次序,这种次序以相对的数值大小来表示。 对应于判断矩阵最大特征根λmax 的特征向量,经归一化(使向量中各元素之和等于1)后记为W 。 W 的元素为同一层次因素对于上一层次因素某因素相对重要性的排序权值,这一过程称为层次单排序。 能否确认层次单排序,需要进行一致性检验,所谓一致性检验是指对A 确定不一致的允许范围。 由于λ 连续的依赖于ij a ,则λ 比n 大的越多,A 的不一致性越严重。用最大特征值对应的特征向量作为被比较因素对上层某因素影响程度的权向量,其不一致程度越大,引起的判断误差越大。因而可以用 λ―n 数值的大小来衡量 A 的不一致程度。 用一致性指标进行检验:max 1 n CI n λ-= -。其中max λ是比较矩阵的最大特征值,n 是比较矩 阵的阶数。CI 的值越小,判断矩阵越接近于完全一致。反之,判断矩阵偏离完全一致的程度越大。 (四)、层次总排序及其一致性检验 )0(273.0104.0056.0567.0092.1418.0224.0266.2222.0316.0353.0201 .0074.0105.0118.0121 .0037.0053.0059.0075 .0667.0526.0470.0603 .0136131121121113581 W A =??? ?? ?? ??????????→??? ? ? ?? ? ???????????→?????????????? ???????→?????????????? ?=归一化按行求和列向量归一化
管理数量方法与分析简答题
《管理数量方法与分析》简答题 第一章数量分析基础 1,对数据进行分析的前提是什么? 数据分析的前提是数据的搜集与加工整理。 2,什么是变量数列? 变量数列是,在对变量的取值进行分组的基础上,将各组不同的变量值与其变量值出现的次数排列成的数列。 3*,变量数列的两个组成要素及其作用。 变量数列由两个要素组成:一个是由不同变量值划分的组,称为组别;另一个是各组变量值出现的次数,称为频数;各组频数与总次数之比,称为频率。 组别表示变量的变动幅度;频数、频率表示对应的变量值对其平均水平的作用程度。频数、频率越大的组所对应的变量值对其平均水平的作用也越大。 4,什么是洛伦茨曲线?它的主要用途是? 洛伦茨曲线就是累计频数(或频率)分布曲线,主要用途是研究社会财富、土地和工资收入的分配是否公平。 5*,简述分布中心的概念和意义。 分布中心,是指距离一个变量的所有取值最近的位置。变量的分布中心有重要的意义,①可以反映变量取值的一般水平。②可以揭示其取值的次数分布在直角坐标系中的集中位置,可以用来反映变量分布密度曲线的中心位置。 6,应用算数平均数应该注意哪些问题?怎么避免?略。 7,算数平均数有哪些性质?略。 8*,在数据分析中引入离散程度测度有什么意义? 变量各取值之间的离散程度是变量次数分布的一个重要特征,测定它对实际研究有重要意义: ①可以反映各变量取值之间的差异大小,也就是反映分布中心指标对各个变量值代表性的高低。差异越大,代表性越低。 ②可以大致反映变量次数分布密度曲线的形状。 9*,测度离散程度的指标有哪些?分别的特点是什么? ①极差。(也称全距,指最大值与最小值的差值。) 特点:计算简单,意义明了,是离散程度测度指标中最粗略、最简单的一种。 ②四分位全距。 特点:不像极差那么容易受极端变量值的影响,但是依然存在没有充分利用所有数据信息的缺点。 ③平均差。(变量各取值与平均数偏差的绝对值的算数平均数)
(完整版)泛函分析复习与总结,推荐文档
《泛函分析》复习与总结 (2014年6月26日星期四 10:20--- 11:50) 第一部分 空间及其性质 泛函分析的主要内容分为空间和算子两大部分. 空间包括泛函 分析所学过的各种抽象空间, 函数空间, 向量空间等, 也包括空间的 性质, 例如完备性, 紧性, 线性性质, 空间中集合的各种性质等等。 以下几点是对第一部分内容的归纳和总结。 一.空间 (1)距离空间 (集合+距离)!验证距离的三个条件:称为是距离空间,如果对于 (,)X ρ,,x y z X ∈(i) 【非负性】,并且当且仅当 (,)0x y ρ≥(,)0x y ρ=【正定性】; x y =(ii) 【对称性】; (,)(,)x y y x ρρ=(iii) 【三角不等式】。 (,)(,)(,)x y x y y z ρρρ≤+距离空间的典型代表:空间、空间、所有的赋范线性空间、 s S 所有的内积空间。 (2)赋范线性空间 (线性空间 + 范数) !验证范数的三个条件:称为是赋范线性空间,如果 (,||||)X ?是数域(或)上的线性空间,对于和 X K =?K =£a K ∈,成立 ,x y X ∈(i) 【非负性】,并且当且仅当【正定性】 ||||0x ≥||||0x =0x =; (ii) 【齐次性】; ||||||||||ax a x =?
(iii) 【三角不等式】。 ||||||||||||x y x y +≤+赋范线性空间的典型代表:空间()、空间(n ?1,2,3,n =L n £) 、空间()、空间(1,2,3,n =L p l 1p ≤≤∞([,])p L a b )、空间、空间、Banach 空间、所有的1p ≤≤∞[,]C a b [,]k C a b 内积空间(范数是由内积导出的范数)。 (3)内积空间 (线性空间 + 内积) !验证内积的四个条件:称为是内积空间,如果 (,(,))X ??是数域(或)上的线性空间,对于和 X K =?K =£a K ∈,成立 ,,x y z X ∈(i) 【非负性】,并且当且仅当【正 (,)0x x ≥(,)0x x =0x =定性】; (ii) 【第一变元可加性】; (,)(,)(,)x y z x z x z +=+(iii) 【第一变元齐次性】; (,)(,)ax z a x z =(iv) 【共轭对称性】。 (,)(,)x z z x =内积空间的典型代表:空间()、空间(n ?1,2,3,n =L n £) 、空间、空间。1,2,3,n =L 2l 2([,])L a b 注. 1) 从概念的外延来理解, 有如下的关系: {内积空间}{赋范线性空间}{距离空间}. ??2) 内积可导出范数, 范数可导出距离, 反之未必. 例如在赋范 线性空间中, 如果范数满足平行四边形公式, 则由范数可以定义内 积. 3) 在距离空间中,,当 0k x x ρ??→?0(,)0k x x ρ→; k →∞赋范线性空间中,,当;|||| 0k x x ???→?0||||0k x x -→k →∞
层次分析法练习参考答案
层次分析法练习 练习一、市政工程项目建设决策 问题提出 市政部门管理人员需要对修建一项市政工程项目进行决策,可选择的方案是修建通往旅游 区的高速路(简称建高速路)或修建城区地铁(简称建地铁)。除了考虑经济效益外,还要考虑社会效益、环境效益等因素,即是多准则决策问题,试运用层次分析法建模解决。 1、建立递阶层次结构 在市政工程项目决策问题中,市政管理人员希望通过选择不同的市政工程项目,使综合 效益最高,即决策目标是“合理建设市政工程,使综合效益最高”。 为了实现这一目标,需要考虑的主要准则有三个,即经济效益、社会效益和环境效益。但 问题绝不这么简单。通过深入思考,决策人员认为还必须考虑直接经济效益、间接经济效益、 方便日常出行、方便假日出行、减少环境污染、改善城市面貌等因素(准则),从相互关系上分析,这些因素隶属于主要准则,因此放在下一层次考虑,并且分属于不同准则。 假设本问题只考虑这些准则,接下来需要明确为了实现决策目标、在上述准则下可以有 哪些方案。根据题中所述,本问题有两个解决方案,即建高速路或建地铁,这两个因素作为措 施层元素放在递阶层次结构的最下层。很明显,这两个方案于所有准则都相关。 将各个层次的因素按其上下关系摆放好位臵,并将它们之间的关系用连线连接起来。同 时,为了方便后面的定量表示,一般从上到下用A、B、 C、D。。。代表不同层次,同一层次从左到右用 1、2、 3、 4。。。代表不同因素。这样构成的递阶层次结构如下图。 目标层 A 合理建设市政工程,使综合效益最高(A) 准则层 B 经济效益 (B1)社会效益 (B2)环境效益 (B3) 准则层 C直接经间接带方便日方便假减少环改善城 济效益动效益常出行日出行境污染市面貌 (C1)(C2)(C3)(C4)(C5)(C6) 措施层 D 建高速路 (D1)建地铁(D2) 图 1递阶层次结构示意图 2、构造判断矩阵并请专家填写 征求专家意见,填写后的判断矩阵如下:
关于层次分析法的例题与解.
旅游业发展水平评价问题 摘要 为了研究比较两个旅游城市Q、Y的旅游业发展水平,建立层次分析法]3[数学模型,对两个旅游城市Q、Y的旅游业发展水平进行了评价. 首先,通过对题目中的图1、表1进行了分析与讨论,根据层次分析法,建立了目标层A、准则层B和子准则层C、方案层D四个层次,通过同一层目标之 间的重要性的两两比较,得出判断矩阵,利用]1[ MATLAB编程对每个判断矩阵进行求解. 其次,用MATLAB软件算出决策组合向量,再比较决策组合向量的大小,由“决策组合向量最大”为目标,得出城市Y的决策组合向量为0.4325,城市Q组合向量为0.5675. 最后,通过城市Q旅游业发展水平与旅游城市Y旅游业发展水平的决策组合向量比较,得出城市Q的旅游业发展水平较高. 关键词层次分析法MATLAB旅游业发展水平决策组合向量
1.问题重述 本文要求分析Q Y,两个旅游城市旅游业发展水平,并且给出了两个城市各方面因素的对比,如城市规模与密度,经济条件,交通条件,生态环境条件,宣传与监督,旅游规格,空气质量,城市规模,人口密度,人均GDP,人均住房面积,第三产业增加值占GDP比重,税收GDP,外贸依存度,市内外交通,人均拥有绿地面积,污水集中处理率,环境噪音,国内外旅游人数,理赔金额,立案数量,A级景点数量,旅行社数量,星级饭店数量.建立数学模型进行求解. 2.问题分析 本文要求分析Q Y,两个城市的分析Y,两个旅游城市旅游业发展水平,在对Q 中,发现需要考虑因素较多,第一、城市规模与密度,包括城市规模与人口密度.第二、经济条件,包括外贸依存度,人均GDP,人均住房面积,第三产业增加值占GDP比重,税收GDP.第三、交通条件,包括市内外交通.第四,生态环境条件包括空气质量,人均绿地面积,污水处理能力,环境噪音.第五、宣传与监督,包括国内外旅游人数,游客投诉立案件数.第六、旅游规格,包括A级景点个数,旅行社个数,星级饭店个数,这就涉及到层次分析法来估算各个指标的权重,评出最优方案.具体内容如下: (1)本文选择了对Q Y,两个旅游城市旅游业发展水平有影响的19个指标作为评价要素,指标规定如下: 城市规模:城市的人口数量. 人口密度:单位面积土地上居住的人口数.是反映某一地区范围内人口疏密程度的指标.人口影响城市规模.人口密度越大城市规模也就越大. 人均GDP:即人均国内生产总值. 人均城建资金:即用于城市建设的资金总投入. 第三产业增加值:增加值率指在一定时期内单位产值的增加值.即第三产业增加值越高越能带动城市经济的发展. 税收GDP:税收是国家为实现其职能,凭借政治权力,按照法律规定,通过税收工具强制地、无偿地征收参与国民收入和社会产品的分配和再分配取得财政收入的一种形式. 外贸依存度:即城市对于外贸交易的依赖程度. 市内交通:即城市市区交通情况. 市外交通:即城市郊区交通情况.市内交通与市外交通对于城市交通条件具有同等的重要性. 空气质量:即城市总体空气质量情况.空气质量越好对于城市生态环境就越好. 人均绿地面积:即反应城市绿化面积以及人口密度的比值关系. 污水处理能力:城市污水处理水平. 环境噪音:城市环境噪音情况. 国内外旅客人数:国内外来旅客一年总人数.人数越多说明宣传与监督就越好.
大数据的统计分析方法
统计分析方法有哪几种?下面天互数据将详细阐述,并介绍一些常用的统计分析软件。 一、指标对比分析法指标对比分析法 统计分析的八种方法一、指标对比分析法指标对比分析法,又称比较分析法,是统计分析中最常用的方法。是通过有关的指标对比来反映事物数量上差异和变化的方法,有比较才能鉴别。 指标分析对比分析方法可分为静态比较和动态比较分析。静态比较是同一时间条件下不同总体指标比较,如不同部门、不同地区、不同国家的比较,也叫横向比较;动态比较是同一总体条件不同时期指标数值的比较,也叫纵向比较。 二、分组分析法指标对比分析法 分组分析法指标对比分析法对比,但组成统计总体的各单位具有多种特征,这就使得在同一总体范围内的各单位之间产生了许多差别,统计分析不仅要对总体数量特征和数量关系进行分析,还要深入总体的内部进行分组分析。分组分析法就是根据统计分析的目的要求,把所研究的总体按照一个或者几个标志划分为若干个部分,加以整理,进行观察、分析,以揭示其内在的联系和规律性。 统计分组法的关键问题在于正确选择分组标值和划分各组界限。 三、时间数列及动态分析法 时间数列。是将同一指标在时间上变化和发展的一系列数值,按时间先后顺序排列,就形成时间数列,又称动态数列。它能反映社会经济现象的发展变动情况,通过时间数列的编制和分析,可以找出动态变化规律,为预测未来的发展趋势提供依据。时间数列可分为绝对数时间数列、相对数时间数列、平均数时间数列。 时间数列速度指标。根据绝对数时间数列可以计算的速度指标:有发展速度、增长速度、平均发展速度、平均增长速度。
动态分析法。在统计分析中,如果只有孤立的一个时期指标值,是很难作出判断的。如果编制了时间数列,就可以进行动态分析,反映其发展水平和速度的变化规律。 四、指数分析法 指数是指反映社会经济现象变动情况的相对数。有广义和狭义之分。根据指数所研究的范围不同可以有个体指数、类指数与总指数之分。 指数的作用:一是可以综合反映复杂的社会经济现象的总体数量变动的方向和程度;二是可以分析某种社会经济现象的总变动受各因素变动影响的程度,这是一种因素分析法。操作方法是:通过指数体系中的数量关系,假定其他因素不变,来观察某一因素的变动对总变动的影响。 用指数进行因素分析。因素分析就是将研究对象分解为各个因素,把研究对象的总体看成是各因素变动共同的结果,通过对各个因素的分析,对研究对象总变动中各项因素的影响程度进行测定。因素分析按其所研究的对象的统计指标不同可分为对总量指标的变动的因素分析,对平均指标变动的因素分析。 五、平衡分析法 平衡分析是研究社会经济现象数量变化对等关系的一种方法。它把对立统一的双方按其构成要素一一排列起来,给人以整体的概念,以便于全局来观察它们之间的平衡关系。平衡关系广泛存在于经济生活中,大至全国宏观经济运行,小至个人经济收支。平衡分析的作用:一是从数量对等关系上反映社会经济现象的平衡状况,分析各种比例关系相适应状况;二是揭示不平衡的因素和发展潜力;三是利用平衡关系可以从各项已知指标中推算未知的个别指标。 六、综合评价分析 社会经济分析现象往往是错综复杂的,社会经济运行状况是多种因素综合作用的结果,而且各个因素的变动方向和变动程度是不同的。如对宏观经济运行的评价,涉及生活、分配、流通、消费各个方面;对企业经济效益的评价,涉及人、财、物合理利用和市场销售状况。如果只用单一指标,就难以作出恰当的评价。 进行综合评价包括四个步骤:
《应用泛函分析》前四章重点复习大纲
1 第1章预备知识 1.1集合的一般知识 1.1.1概念、集合的运算 上限集、上极限 下限集、下极限 1.1.2映射与逆映射 1.1.3可列集 可列集 集合的对等关系~(定义1.1)1.2实数集的基本结构 1.2.1建立实数的原则及实数的序关系 阿基米德有序域(定义1.4)1.2.2确界与确界原理 上确界sup E(定义1.5) 下确界inf E 确界原理(定理1.7) 1.2.3实数集的度量结构 数列极限与函数极限 单调有界原理 区间套定理 Bolzano-Weierstrass定理 Heine-Bore定理 Cauchy收敛准则 1.3函数列及函数项技术的收敛性1.3.1函数的连续性与一致连续 函数的一致连续性(定义1.10)1.3.2函数列和函数项级数的一致收敛 逐点收敛(定义1.11) 一致收敛(定义1.12) Weierstrass M-判别法(定理1.15)1.3.3一致收敛的性质 极限与积分可交换次序 1.4 Lebesgue积分 1.4.1一维点集的测度 开集、闭集 有界开集、闭集的测度m G m F 外测度内测度 可测集(定义1.16) 1.4.2可测函数 简单函数(定义1.18) 零测度集 按测度收敛 1.4.3 Lebesgue积分 有界可测集上的Lebesgue积分 Levi引理 Lebesgue控制收敛定理(性质1.9) R可积、L可积 1.4.4 Rn空间上的Lebesgue定理 1.5 空间 Lp空间(定义1.28) Holder不等式 Minkowski不等式(性质1.16)
2 第2章度量空间与赋范线性空间 2.1度量空间的基本概念 2.1.1距离空间 度量函数 度量空间(X,ρ) 2.1.2距离空间中点列的收敛性 点列一致收敛 按度量收敛 2.2度量空间中的开、闭集与连续映射 2.2.1度量空间中的开集、闭集 开球、闭球 内点、外点、边界点、聚点 开集、闭集 2.2.2度量空间上的连续映射 度量空间中的连续映射(定义2.7) 同胚映射 2.3度量空间中的可分性、完备性与列紧性 2.3.1度量空间的可分性 稠密子集(定义2.9) 可分性 2.3.2度量空间的完备性 度量空间中Cauchy列(定义2.11) 完备性 完备子空间 距离空间中的闭球套定理(定理2.9) 闭球套半径趋于零,则闭球的交为2.3.3度量空间的列紧性 列紧集、紧集(定义2.13) 全有界集 2.4 Banach压缩映射原理 压缩映像 不动点 Banach压缩映射原理(定理2.16)2.4.1应用 隐函数存在性定理(例2.31) 2.5 线性空间 2.5.1线性空间的定义 线性空间(定义2.17) 维数与基、直和 2.5.2线性算子与线性泛函 线性算子 线性泛函(定义2.18) 零空间ker(T)与值域空间R(T) 2.6 赋范线性空间 2.6.1赋范线性空间的定义及例子 赋范线性空间 Banach空间(定义2.20) 2.6.2赋范线性空间的性质 收敛性——一致收敛 绝对收敛 连续性与有界性 2.6.3有限维赋范线性空间 N维实赋范线性空间
层次分析法实例
层次分析法应用实例 问题描述:通讯交流在当今社会显得尤其重要,手机便是一个例子,现在每个人手里都有至少一部手机。但如今生产手机的厂家越来越多,品种五花八门,如何选购一款适合自己的手机这个问题困扰了许多人。 目标:选购一款合适的手机 准则:选择手机的标准大体可以分成四个:实用性,功能性,外观,价格。 方案:由于手机厂家有几十家,我们不妨可以将其归类:○1欧美(iphone);○2亚洲(索爱);○3国产(华为). 解决步骤: 1.建立递阶层次结构模型 图1 选购手机层次结构图 2.设置标度 人们定性区分事物的能力习惯用5个属性来表示,即同样重要、稍微重要、较强重要、强烈重要、绝对重要,当需要较高精度时,可以取两个相邻属性之间的值,这样就得到9个数值,即9个标度。
为了便于将比较判断定量化,引入1~9比率标度方法,规定用1、3、5、7、9分别表示根据经验判断,要素i与要素j相比:同样重要、稍微重要、较强重要、强烈重要、绝对重要,而2、4、6、8表示上述两判断级之间的折衷值。 注:aij表示要素i与要素j相对重要度之比,且有下述关系: aij=1/aji ;aii=1;i,j=1,2,…,n 显然,比值越大,则要素i的重要度就越高。 3.构造判断矩阵 A B1 B2 B3 B4 B1 1 3 5 1 B2 1/3 1 3 1/3 B3 1/5 1/3 1 1/5 B4 1 3 5 1 表1 判断矩阵A—B B1 C1 C2 C3 C1 1 1/3 1/5 C2 3 1 1/3 C3 5 3 1 表2 判断矩阵B1—C
B2 C1 C2 C3 C1 1 3 3 C2 1/3 1 1 C3 1/3 1 1 表3 判断矩阵B2—C B3 C1 C2 C3 C1 1 3 6 C2 1/3 1 4 C3 1/6 1/4 1 表4 判断矩阵B3—C B4 C1 C2 C3 C1 1 1/4 1/6 C2 4 1 1/3 C3 6 3 1 表5 判断矩阵B4—C 4.计算各判断矩阵的特征值,特征向量和一致性检验 用求和发计算特征值: ○1将判断矩阵A 按列归一化(即列元素之和为1):bij= aij /Σaij ; ○2将归一化的矩阵按行求和:ci=Σbij (i=1,2,3….n ); ○3将ci 归一化:得到特征向量W=(w1,w2,…wn )T ,wi=ci /Σci , W 即为A 的特征向量的近似值; ○4求特征向量W 对应的最大特征值: 1).1 5 3 1 51131513131311531 = A ,按列归一化后为 38 1514 522 938 1538314122138338514322338539151452293815 2).按行求和并归一化后得()T 389 .0069 .0153 .0389.0=W
泛函分析学习心得
泛函分析学习心得 学习《实变函数论与泛函分析》这门课程已有将近一年的时间,在接触这门课程之前就已经听闻这门课程是所有数学专业课中最难学的一门,所以一开始是带着一种“害怕学不好”的心理来学.刚开始接触的时候是觉得很难学,知识点很难懂,刚开始上课时也听不懂,只顾着做笔记了.后来慢慢学下来,在课前预习、课后复习研究、上课认真听课后发现没有想象中的那么难,上课也能听懂了.因此得出了一个结论:只要用心努力去学,所有课程都不会很难,关键是自己学习的态度和努力的程度. 在学习《泛函分析》的前一个学期先学习了《实变函数论》,《实变函数论》这部分主要学习了集合及其运算、集合的势、n 维空间中的点集、外测度与可测集、Lebesgue 可测集的结构、可测函数、P L 空间等内容,这为这学期学习《泛函分析》打下了扎实的基础.我们在这个学期的期中之前学习的《泛函分析》的主要内容包括线性距离空间、距离空间的完备性、内积空间、距离空间中的点集、不动点定理、有界线性算子及其范数等.下面我谈谈对第一章的距离空间中部分内容的理解与学习: 第一章第一节学习了线性距离空间,课本首先给出了线性空间的定义及其相关内容,这与高等代数中线性空间是基本一样的,所以学起来比较容易.接着是距离空间的学习,如果将n 维欧氏空间n R 中的距离“抽象”出来,仅采用性质,就可得到一般空间中的距离概念: 1.距离空间(或度量空间)的定义: 设X 为一集合,ρ是X X ?到n R 的映射,使得使得X z y x ∈?,,,均满足以下三个条件: (1))(0,≥y x ρ,且)(0,=y x ρ当且仅当y x =(非负性) (2))()(x y y x ,,ρρ=(对称性) (3))()()(z y y x z x ,,,ρρρ+≤(三角不等式), 则称X 为距离空间(或度量空间),记作)(ρ,X ,)(y x ,ρ为y x ,两点间的距离. 学习了距离空间定义后,我们可以验证:欧式空间n R ,离散度量空间,连
层次分析法练习
1.对下列短语作层次分析,如果有歧义,要作不同的分析。 (1)要求我们班明天去主楼开会 (2)访问台湾归来的科学家 (3)咬死了猎人的狗 (4)他的哥哥和妹妹的朋友 (5)三个报社的记者和编辑 (6)看打乒乓球的中小学生 (7)校办工厂幼儿园 (8)看望陈老师的学生 (9)打死老虎 (10)爸爸和妈妈的同事 (11)我们三个一组 2.用层次分析法分析下列词组 (1)恢复和发扬母校的优良传统 (2)母亲那布满皱纹的慈祥的脸 (3)牺牲在这块土地上的烈士 (4)处理好工作、学习二者的关系 (5)用中国乐器演奏的西洋乐曲 (6)积极地培育和正确地使用人才 (7)一位优秀的小学低年级语文教师 (8)那些充满幻想的诗句 (9)交给连长一份秘密文件 (10)发明能打出乐谱的打字机的人 (11)周密的调查能解决问题 (12)在人才集中的研究机关工作 (13)把这个问题讲得又深又透 (14)教室里有两个人在交谈 (15)为国家和人类作出重大贡献的科学工作者 (16)派他到镇上看一下市场情况 (17)矿山建设者的豪迈誓言 (18)不能磨灭的深刻印象 (19)写出更多更好的作品 (20)分析研究以下材料 (21)严格控制基本建设的规模 (22)选他当人民代表 (23)请他到北京参加科学讨论会 (24)谁是最可爱的人 (25)夏天和冬天温差都很大 (26)世界珍惜动物熊猫的故乡中国 (27)浓浓的长长的眉毛和一双不大不小的眼睛 (28)在我们读书的教室里 (29)那个特别红的让他拿走了 (30)沿走廊走过去往右拐就到了
(31)去图书馆借讲法律的书 (32)命令部队迅速占领制高点阻击敌人 (33)老师叫你去办公室交语法作业 (35)扮成一个看山林的人 (36)请你陪小李上街买东西 (37)刚刚打扫完教室的王芳 (38)气氛紧张的会议室里 (39)对国内外旅游者有着极大的吸引力 (40)选你当组长最合适 如有侵权请联系告知删除,感谢你们的配合!
层次分析法例题94055
。数 学 建 模 作 业 班级:高分子材料与工程 姓名:林志许、朱金波、任宇龙
。 学号:1211020115、1211020126、1211020134 层次分析法 某物流企业需要采购一台设备,在采购设备时需要从功能、价格与可维护性三个角度进行评价,考虑应用层次分析法对3个不同品牌的设备进行综合分析评价和排序,从中选出能实现物流规划总目标的最优设备,其层次结构如下图所示。以A 表示系统的总目标,判断层中1B 表示功能,2B 表示价格,3B 表示可维护性。1C ,2C ,3C 表示备选的3种品牌的设备。 解题步骤: 1、标度及描述 人们定性区分事物的能力习惯用5个属性来表示,即同样重要、稍微重要、较强重要、强烈重要、绝对重要,当需要较高精度时,可以取两个相邻属性之间的值,这样就得到9个数值,即9个标度。 为了便于将比较判断定量化,引入1~9比率标度方法,规定用1、3、5、7、9分别表示根据经验判断,要素i 与要素j 相比:同样重要、稍微重要、较强重要、强烈重要、绝对重要,而2、4、6、8表示上述两判断级之间的折衷值。 目标层 判断层 方案层 图 设备采购层次结构图
注:a ij 表示要素i与要素j相对重要度之比,且有下述关系: a ij =1/a ji ; a ii =1; i,j=1,2,…,n 显然,比值越大,则要素i的重要度就越高。 2、构建判断矩阵A 判断矩阵是层次分析法的基本信息,也是进行权重计算的重要依据。根据结构模型,将图中各因素两两进行判断与比较,构造判断矩阵: ●判断矩阵B A-(即相对于物流系统总目标,判断层各因素相对重要性比较)如表1所示; ●判断矩阵C B- 1(相对功能,各方案的相对重要性比较)如表2所示; ●判断矩阵C B- 2(相对价格,各方案的相对重要性比较)如表3所示; ●判断矩阵C B- 3(相对可维护性,各方案的相对重要性比较)如表4所示。 B A- C B- 1 C B- 3 3、计算各判断矩阵的特征值、特征向量及一致性检验指标 一般来讲,在AHP法中计算判断矩阵的最大特征值与特征向量,必不需
管理数量方法与分析
管理数量方法与分析 第一章数据分析的基础计算题20分必考 数据分组:就是对某一变量的不同取值,按照其自身变动特点和研究需要划分成不同的组别,以便更好地研究该变量分布特征及变动规律。变量:离散变量和连续变量分组:单项分组和组距分组。 变量数列的概念:在对变量取值进行分组的基础上,将各组不同的变量值与其变量值出现的次数排列成的数列,成为变量数列 两因素组成:一个是由不同变量值所划分的组,称为组别。各组变量出现的次数,称为频数。各组次数与总次数之比,成为频率。 编制组距:1.确定组数2.确定组距3.确定组限4.计算各组的次数(频数)5.编制变量数列向上累计频数具体做法是:由变量值低的组向变量值高的组依次累计频数。向下:相反 分布中心的测度 分布中心:是指距离一个变量的所有取值最近的位置。揭示变量的分布中心有着十分重要的意义。首先,变量的分布中心是变量取值的一个代表,可以用来反映其取值的一般水平。一个变量往往有许多个不同的取值,假若要用一个数值作为他们的代表,反映其一般水平,分布中心值无疑是一个最合适的数值。其次,变量的分布中心可以揭示其取值的次数分布在直角坐标系上的集中位置,可以用来反映变量分布密度曲线的中心位置,即对称中心或尖峰位置。 分布中心指标:1算数平均数,2中位数,3众数 算数平均数需注意问题:1.算数平均数容易受到极端变量值的影响 2.权数对平均数大小起着权衡轻重的作用3.根据组距数列求加权算术平均时,需用组中值作为各组变量值的代表
算数平均中位数众数概念:1.算数平均又称均值,它是一组变量值的总和与其变量值的个数总和的比值。 2.是指将某一变量的变量值按照从小到大的顺序排成一列。位于这列数中心位置上的那个变量值。3.是指某一变量的全部取值中出现次数最多的那个变量值。 离散程度的测定 离散程度:还需要进一步考察其各个取值的离散程度即差异程度的大小。首先,通过对变量取值之间离散程度的测定可以反映各个变量值之间的差异大小。其次,通过对变量取值之间离散程度的测定可以反映变量次数分布密度曲线的形状。 离散程度测定指标:1极差,2四分位全距,3平均差,4标准差,5极差,6变异系数 概念:1.极差又称全距,是指一组变量值中最大变量值与最小变量值之差。2.是指将一组由小到大排列的变量数列分成四等分,QI-Q3所得差的绝对值。3.是变量各个取值偏差绝对值的算数平均数。4是变量的各个取值偏差平方的平均数的平方根。5标准差的平方。6.变异系数主要用于不同变量的各自取值之间差异程度的比较。 相关系数:是两变量的协方差与他们标准差之积的比率。它是专门用来测定两个变量线性相关方向和程度的一个指标。1.取值-1和1之间 2.<0 x与y负相关 3.>0正相关 4.=0 不存在线性相关关系 5.-1 完全负相关 6.1完全正相关 7.≈0 相关关系越弱 8.≈-1或1 相关关系越强 协方差:是两个变量的所有取值与其算数平均数离差乘积的算数平均数,可以用来测定两变量之间相关关系的方向和密切程度
泛函分析重要内容
们同意前人的提法,认为线性泛函与无穷维空间上引进坐标的思想有关,而对偶理论则有如无穷维线性空间上的解析几何学。 Chp.1 距离线性空间 SS1. 选择公理,良序定理,佐恩引理 有序集的定义: (1)若a在b之先,则b便不在a之先。 (2)若a在b之先,b在c之先,则a在c之先。 这种先后关系记作 良序集:A的任何非空子集C都必有一个属于C的最先元素。 良序集的超限归纳法: (1)为真,这里是A中最先的元素。 2)对一切,为真,则亦真 那么对一切皆真。 选择公理 设N={N}是一个非空集合构成的族,则必存在定义在N上的函数f,使得对一切N都有 部分有序 称元素族X是部分有序的,如果在其中某些元素对(a,b)上有二元关系,它据有性质: 例如X中包换关系 在部分有序集下,有上界、极大元和完全有序 其中完全有序的C:。 例如在复数域中,按大小关系定义两个复数的关系,则复平面是部分有序的,实轴、虚轴是完全有序的。 佐恩引理 设X非空的部分有序集,如果X的任何完全有序子集都有一个上界在X中,则X必含有极大元。 从现代观点来看,泛函分析研究的主要是研究实数域或者复数域上的完备赋线性空间。 SS2. 线性空间,哈迈尔(Hamel)基 线性空间的定义:加法交换、加法结合、有零元,有负元、有单位元等。 线性流形:线性空间中的非空子集,如果它加法封闭、数乘封闭。 线性流形的和M+N:所有形如m+n的元素的集合,其中m∈M, n∈N。 线性流形的直和:如果M∩N={θ},则以代替M+N 如果,则称M与N是代数互补的线性流形。 于是有下述定理:
定理2.1 设M,N是线性空间X的线性流形,则当且仅当对每个x∈X都有唯一的表达式 x=m+n, m∈M,n∈N. 定理2.2 若,则dimX=dimM+dimN Hamel基的定义: 设X是具有非零元的线性空间,X的子集H称为X的Hamel基,如果 (1)H是线性无关的。 (2)H成的线性流形是整个空间。 则有Hamel基和线性无关子集的关系: 定理2.3 设X是线性空间,S是X中任意的线性无关子集,则存在X的一个Hamel基使得 推论任何非零线性空间必有Hamel基 由定理2.3,可有 定理2.4 设M是线性空间X的线性流形,则必有线性流形使得,即N是M的代数补。 SS3 距离空间(度量空间),距离线性空间 定义了距离(满足正定性、对称性和三角不等式的映射)d(x,y)的空间即为距离空间,记为
层次分析法作业答案(20210228092221)
层次分析法作业答案 您已经去过几家主要的摩托车商店,基本确定将从三种车型中选购一 种。您选择的标准主要有:价格,耗油量大小,舒适程度与外表美观情 况。经反复思考比较,构造了它们的成对比较矩阵为 1 3 7 i i 5 7 i 1 8 5 3 三种车型(记为a,b,c 关于价格,耗油 量,舒适程度及您对她们外观喜欢 程度的成对比较矩阵为 1 2 3 1 1 1 1 5 2 1 2 1 2 5 1 7 (价格)丄 3 1 2 1 (耗油量) 2 丄 7 1 1 3 5 1 1 5 3 1 3 1 4 5 1 7 (舒适程度) 1 1 A (外观) 1 1 d 5 4 1 3 7 1 (1) 根据上述矩阵可以瞧出这四项标准在您的心目中的比重就是不 同的,请按由大到小的顺序排出。 (2) 哪辆车最便宜,哪辆车最省油,哪辆车最舒适,您认为哪辆车最漂 亮? 用层次分析法确定您对这三种车型的喜欢程度 (用百分比表示)。比 建模过程如下: 8 5 3 1
2.4940 1.2097 0.3894 0.2111 口 1/ 4 (2.4940/0.5753 1.2097/0.2761 0.3894/0.0965 0.2111/ 0.0518) 1.2068 同理,可求得下面四个比较矩阵权向量与最大特征根。 (价格B1) ( 耗油量B2) a b c a b c 1 1 1 2 3 1 a A a 5 2 b — 1 2 b 1 2 c / c 1 1 1 2 1 1 7 3 2 (舒适程度B3) ( 外表B4) 先构建成对比较矩阵 1 3 7 8 x 1 1 1 5 5 2 列向量归一化,得到矩阵 3 x 1 1 7 5 1 3 x 3 1 1 1 8 5 3 x 4 0.6245 0.6818 0.5250 0.4706 0.2082 0.2273 0.3750 0.2941 B= ,然后按行求与得到矩阵 0.0892 0.0455 0.0750 0.1765 0.0781 0.0455 0.0250 0.0588 2.3019 0.5753 1.1046 0.2761 对矩阵C 归一化得到w , 0.3862 0.0965 C 0.2074 0.0518 2.3019 1.1046 ,再 0.3862 0.2074 A* w =
数量分析方法模拟试题一
商务统计方法模拟试题一 一、判断题 1.一般的统计分析人员和SPSS初学者适合采用程序运行方式。() 2.在定义数据结构时,每个变量都要定义变量值标签。() 3.在定义SPSS变量名时,变量名可以以数字开头。() 4.利用SPSS进行数据分析的首要任务是明确数据分析目标。() 5.在SPSS中,只有取值是数字的才是变量。() 6、峰度系数等于3,说明数据分布与标准正态分布相同。() 7、比率分析只适用于定距型变量。() 8、进行单样本参数检验时,要求样本来自的总体服从或近似服从正态分布。() 9、若两变量间的相关系数为0,则说明这两个变量不存在相关关系。() 10、多对变量两两之间的相关关系可以用重叠散点图展现。() 二、单项选择题 1. SPSS数据文件默认的扩展名() A、.sps B、.spo C、.sav D、.rtf 2. 面对100份调查问卷,在进行SPSS数据输入时,应采用() A、原始数据的组织方式 B、计数数据的组织形式 3. 下列内容中,不属于SPSS数据结构的是() A、变量名 B、对齐方式 C、字体大小 D、缺失值 4. 在定义数据结构时,默认的数据类型是() A、标准数值型 B、用户自定义型 C、字符型 D、日期型 5. “民族”这个变量属于() A、定类型变量 B、定序型变量 C、定距型变量 6. 欲将“性别”变量的变量值规定为“1为男,2为女”,应在哪进行设置() A、Name B、Label C、Values D、Missing 7. 欲插入一个个案,应选择的一级菜单是() A、File B、Edit C、View D、Data 8. 在横向合并时,[Excluded Variables]框中的变量是() A、两个待合并的数据文件中的所有变量 B、合并后新的数据文件中包括的变量 C、合并后新的数据文件中不包括的变量 D、第二个待合并的数据文件中的变量 9. 进行数据排序,应选择的菜单是() A、[Data]-[Go to case] B、[ Edit ]-[Go to case] C、[Data]-[ Sort Cases ] D、[ Edit ]-[Sort Cases ] 10. Sd(高数,英语,哲学)的功能是() A、计算三门课程成绩的平均分 B、计算三门课程成绩的标准差 C、计算三门课程成绩的方差 D、计算三门课程成绩的总分 11. 希望从全部231个个案中随机选出32个个案,应采用的选取方式是() A、指定条件选取 B、近似选取 C、精确选取 D、过滤变量选取