1 Feature Subset Selection by Using Sorted Feature Relevance
Feature Subset Selection by Using Sorted Feature
Relevance
Olcay Boz
AT&T Labs
200Laurel Ave.
Middletown,NJ,USA.
E-mail:olcay@https://www.360docs.net/doc/ee3311596.html,
Abstract—
Real world classi?cation applications usually have many features.This increases the complexity of the classi?cation task.Choosing a subset of the features may increase accuracy and reduce complexity of the acquired knowledge.We present a new feature subset selection method by using sorted feature relevance.We tested the new method on real world and arti-?cial datasets and compared its results with existing methods.We showed that the new method chooses good subsets by searching fewer states than the existing methods.In the new method,we?rst sort the features accord-ing to their relevance and test the subsets formed by the most relevant fea-tures to?nd a starting subset for searching the subset space.We show that this technique speeds up the search considerably for most of the problem domains.
I.Introduction
Real world classi?cation applications usually have many fea-tures.This increases the complexity of the classi?cation task. Some of these features may be irrelevant.They may also be adding noise to training and they force the learning algorithm to separate useful information from the noise.Choosing only the most relevant and noise free features will improve the classi?-cation accuracy,shorten learning time and make the?nal rep-resentation of the problem https://www.360docs.net/doc/ee3311596.html,ing a subset of the avail-able features will increase classi?cation ratio and shorten clas-si?cation https://www.360docs.net/doc/ee3311596.html,ing a subset of the features will also increase the understandability of the acquired knowledge In some real world applications(like medical applications)?nding the values of some of the features may be expensive(eg.expensive lab tests)or may be dangerous.If those features are removed from the set,at the testing phase they do not have to be found.If there are missing feature values in the dataset Feature Subset Selec-tion(FSS)may help by removing features with missing values. FSS will also help data visualization by reducing the number of dimensions.FSS may also reduce the dataset size by reducing the number of unique instances.
We have developed a new heuristic Feature Subset Selection method“Feature Subset Selection by Feature Relevance”.New method?rst sorts the features according to their relevance for the classi?cation algorithm being used and then tests only the combinations of the sorted features to?nd a better starting point for the second search phase of the algorithm.We showed that the new algorithm is very effective in choosing small subsets and in decreasing classi?cation algorithm complexity.We used C4.5as the classi?cation algorithm.
For the representation of feature subsets,we chose binary string representation.In this representation,each subset is rep-resented by n bits(n:number of features in the full set.)Each bit represents presence(1)or absence(0)of that feature in the subset.For example,if n=4,string1001will represent subset {f0,f3}.
II.Feature Subset Selection Review
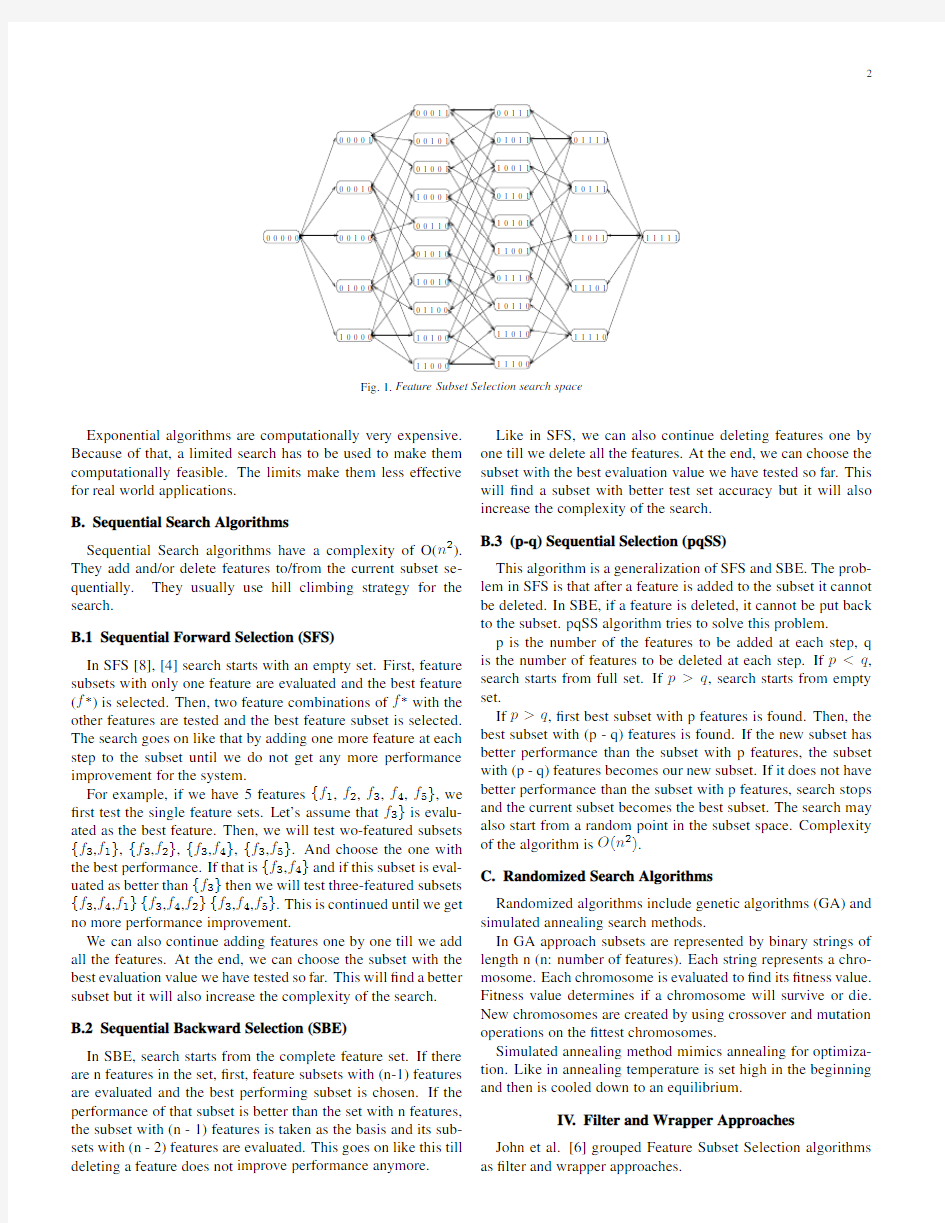
FSS is a search and optimization problem for?nding the smallest subset with the best classi?cation accuracy.Each state in the subspace is a subset of the features.An example of the subset space for5features is shown in Figure1.
Three factors determine how good a FSS algorithm is:Clas-si?cation accuracy,size of the subset,computational ef?ciency. An FSS algorithm can be divided into three parts:Search-ing subsets,evaluating subsets and checking performance of the ?nal subset.
Finding the optimal feature subset is NP hard.There are2n states in the search space(n:number of features).For large n values,evaluating all the states is computationally unfeasible. Therefore,we have to use a heuristic search.
Doak[5]divides search algorithms into three groups:
1.Exponential algorithms
2.Sequential Algorithms
3.Randomized Algorithms
Evaluation function is used to compare the feature subsets.It creates a numeric output for each state.FSS algorithm’s goal is to optimize this function.John et al.[6]classi?ed evaluation function in two groups:Filter approach in which means other than classi?cation algorithms are used as the evaluation func-tion,wrapper approach in which classi?cation algorithm itself is used for evaluation function.
III.Search Algorithms
A.Exponential Search Algorithms
Some of the exponential search algorithms are Exhaustive Search,Branch and Bound Search and Beam https://www.360docs.net/doc/ee3311596.html,plex-ity of the exponential search algorithms is O(2n)(n:number of features).
Exhaustive search evaluates every state in the search space. In Beam Search[5]the best N states are saved in a beam and the best state in the beam is tested for further expansion.Newly tested states are put in proper places in the beam according to their evaluation value.
Branch and Bound[9]requires feature selection algorithm to be monotonic.Adding new features to a subset does not de-crease the value of the evaluation for that subset.
0 0 0 0 0
1 1 1 1 1
0 0 1 0 10 1 0 0 1
1 0 0 0 10 0 1 1 0
0 1 0 1 01 1 0 0 0
1 0 1 0 01 0 0 1 00 1 1 0 0
0 0 0 1 1
0 0 0 1 0
0 0 1 0 0
1 0 0 0 0
0 1 0 0 00 0 0 0 1
0 1 1 1 1
1 0 1 1 11 1 0 1 1
1 1 1 1 0
1 1 1 0 1
0 0 1 1 10 1 0 1 11 0 0 1 10 1 1 0 11 0 1 0 1
1 1 0 0 10 1 1 1 01 0 1 1 01 1 0 1 01 1 1 0 0
Fig.1.Feature Subset Selection search space
Exponential algorithms are computationally very expensive.Because of that,a limited search has to be used to make them computationally feasible.The limits make them less effective for real world applications.B.Sequential Search Algorithms
Sequential Search algorithms have a complexity of O(n 2).They add and/or delete features to/from the current subset se-quentially.They usually use hill climbing strategy for the search.
B.1Sequential Forward Selection (SFS)
In SFS [8],[4]search starts with an empty set.First,feature subsets with only one feature are evaluated and the best feature (f ?)is selected.Then,two feature combinations of f ?with the other features are tested and the best feature subset is selected.The search goes on like that by adding one more feature at each step to the subset until we do not get any more performance improvement for the system.
For example,if we have 5features {f 1,f 2,f 3,f 4,f 5},we ?rst test the single feature sets.Let’s assume that f 3}is evalu-ated as the best feature.Then,we will test wo-featured subsets {f 3,f 1},{f 3,f 2},{f 3,f 4},{f 3,f 5}.And choose the one with the best performance.If that is {f 3,f 4}and if this subset is eval-uated as better than {f 3}then we will test three-featured subsets {f 3,f 4,f 1}{f 3,f 4,f 2}{f 3,f 4,f 5}.This is continued until we get no more performance improvement.
We can also continue adding features one by one till we add all the features.At the end,we can choose the subset with the best evaluation value we have tested so far.This will ?nd a better subset but it will also increase the complexity of the search.B.2Sequential Backward Selection (SBE)
In SBE,search starts from the complete feature set.If there are n features in the set,?rst,feature subsets with (n-1)features are evaluated and the best performing subset is chosen.If the performance of that subset is better than the set with n features,the subset with (n -1)features is taken as the basis and its sub-sets with (n -2)features are evaluated.This goes on like this till deleting a feature does not improve performance anymore.
Like in SFS,we can also continue deleting features one by one till we delete all the features.At the end,we can choose the subset with the best evaluation value we have tested so far.This will ?nd a subset with better test set accuracy but it will also increase the complexity of the search.B.3(p-q)Sequential Selection (pqSS)
This algorithm is a generalization of SFS and SBE.The prob-lem in SFS is that after a feature is added to the subset it cannot be deleted.In SBE,if a feature is deleted,it cannot be put back to the subset.pqSS algorithm tries to solve this problem.
p is the number of the features to be added at each step,q is the number of features to be deleted at each step.If p q ,search starts from empty set.
If p >q ,?rst best subset with p features is found.Then,the best subset with (p -q)features is found.If the new subset has better performance than the subset with p features,the subset with (p -q)features becomes our new subset.If it does not have better performance than the subset with p features,search stops and the current subset becomes the best subset.The search may also start from a random point in the subset https://www.360docs.net/doc/ee3311596.html,plexity of the algorithm is O (n 2).
C.Randomized Search Algorithms
Randomized algorithms include genetic algorithms (GA)and simulated annealing search methods.
In GA approach subsets are represented by binary strings of length n (n:number of features).Each string represents a chro-mosome.Each chromosome is evaluated to ?nd its ?tness value.Fitness value determines if a chromosome will survive or die.New chromosomes are created by using crossover and mutation operations on the ?ttest chromosomes.
Simulated annealing method mimics annealing for optimiza-tion.Like in annealing temperature is set high in the beginning and then is cooled down to an equilibrium.
IV .Filter and Wrapper Approaches
John et al.[6]grouped Feature Subset Selection algorithms as ?lter and wrapper approaches.
3
A.Filter Approach
In?lter approach,classi?cation algorithm is not used in fea-ture subset selection.Subsets are evaluated by other means. Focus algorithm[1]uses exhaustive breadth?rst search.Fo-cus tries to?nd the subset with minimum number of features which classi?es the training set instances suf?ciently.
Relief[7]is another method which uses?lter approach.It assigns relevance weight to each feature.Relief uses random instances to?nd the relevance of features.Relevance values found by using the difference between the selected instance and the two nearest instances of the same and opposite class(near-hit,near-miss).It tries to?nd all relevant features.If most of the features are relevant Relief will select most of them.But a smaller feature set may give a better classi?cation.
Cardie[2]used decision tree to select subset for a nearest-neighbor algorithm.Features used in the tree are used for the nearest neighbor algorithm.The problem is that,features which are good for decision trees may not be good for the nearest neighbor algorithm.Another problem with the decision trees is that features closer to the leaves are selected by using fewer instances than features up in the tree.Therefore,they may be less relevant.
B.Wrapper Approach
In wrapper approach,classi?cation algorithm is used as the evaluation function.The feature selection algorithm is wrapped around the classi?cation algorithm.For each subset a classi?er is constructed and this classi?er is used for evaluating that sub-set.The advantage of this approach is that it improves reliability of the evaluation function.If evaluation algorithm and classi?-cation algorithms are different,different biases they have makes the results less reliable.The disadvantage is that it increases the cost of the evaluation function.
Caruana and Freitag[3]used Tree Caching in their Greedy Attribute Selection.Caching can be used with deterministic de-cision trees(e.g.ID3,C4.5etc.).Decision trees usually do not use all of the available features.If a decision tree uses n of the available N features,all the feature subsets which have all of these n features as their members will create the same tree with the same accuracy.
If trees are cached then we will not have to create deci-sion tree for some of the feature subsets.If our features are {f1,f2,f3,f4}and if the tree uses only{f1,f3}then subsets {f1,f2,f3}and{f2,f3,f4}will create the same tree.This is because the subset used by the tree from the full set is a subset of the subsets{f1,f2,f3}and{f2,f3,f4}.
V.Feature Subset Selection by Feature Relevance
Our method is a heuristic method and we used wrapper ap-proach.It has three phases.In the?rst phase(Sorted Search Phase)we try to?nd a better starting point for the second phase (Neighbor Search Phase)by sorting the features according to their relevance to the classi?cation algorithm.In the second phase we use the subset we?nd in the?rst phase as our starting point and try to?nd a better subset in the immediate neighbor-hood.The?nal subset(Third Phase)is found by using cross validation which is integrated to the algorithm.
For the evaluation function and for classi?cation we used C4.5.To be able to compare the subsets better we forced C4.5 not to prune the trees.
We divide our algorithm into three phases:Sorted Search, Neighbor Search,Finding Final Subset by Using Cross Valida-tion.
A.Sorted Search
We?rst sort the features according to their relevance for the classi?cation algorithm we use.In our tests,since we used C4.5 as our classi?cation algorithm,we used Quinlan’s gain ratio [10],[12]for sorting the features according to their relevance. Gain ratio uses entropy to?nd out how well a feature separates instances.Goodness is measured by the probability of a class dominating each data subset.
If another classi?cation algorithm is used,features may be sorted according to their relevance by using other methods rele-vant to the classi?cation algorithm.
Features are sorted from the most relevant one(with the high-est gain ratio)to the least relevant one(with the lowest gain ratio).Then,a decision tree is created by using the best fea-ture(the most relevant one).The classi?cation ratio of the tree created on the test dataset is saved for that subset.Next,the best two features are tested,followed by the best three and it goes like that till the best N features(N number of features)are tested.If the sorted feature list is like{f1,f2,...,f N},we test subsets{f1},{f1,f2},{f1,f2,f3}...{f1,f2,...,f N}.We ?nd the subset with the best test set accuracy and this subset will be our starting subset for the second search phase.
Sorted search phase can also be used by itself.It will be com-putationally more ef?cient because it tests at most number of states equal to the number of features.The danger is that if there are highly relevant random features or if none of the features are relevant this phase by itself may fail to?nd a good subset.If it is known that problem has nonrandom relevant features this phase alone will give reasonably good results by testing very few states.
B.Neighbor Search
In Neighbor Search Phase the best subset from the previous phase is assigned to the best state and to the current state.We test all the immediate neighbor states of the current state.If our current state is100110,then its neighbors are000110,110110, 101110,100010,100100,100111.Each neighboring state has only1bit different from the current state.We test all the neigh-bor states.If a neighbor state is better than the best state(good-ness measure is explained below),it is assigned to the best state. After testing all the neighbor states,if none of them is better than the best state,algorithm stops.Other stopping criteria are explained below in the rules list.If the best state has changed, then best state is assigned to current state and its neighbors are tested.This goes on till stopping criteria is met or there are no untested states around the current state.Algorithm keeps track of the previously tested states and does not test them again. User can choose one of the three goodness measures for com-paring two states:
1.Choose the subset with better classi?cation ratio or if the classi?cation ratios are equal,choose the one with fewer fea-
4
tures.If both classi?cation ratios and the number of features are equal then choose the more relevant subset.Relevancy of a subset is calculated by using the ranking of each feature.Fea-tures are ranked at the beginning of the program.For example if we have4features and the features are ranked like f3,f0,f2,f1 (from most relevant to least),relevance values for each bit will be2013.Then,the relevance of the state1010will be3(2*1 +1*1)and the relevance of state1001will be5(2*1+3*1). Therefore,1001will be more relevant than1010.
2.Choose the smaller subset if its accuracy is bet-ter than the other’s classi?cation ratio minusβ(if[acc1≥[acc2?β]]AND[size1 3.If we want the smallest subset we take the full feature set accuracy(acc full as our base and?nd the smallest subset within a certain range of that accuracy acc next≥acc full?β.For example,if the accuracy of the full set is95%and best current subset with3features has accuracy of97%and next subset with 2features has the accuracy of92%andβ=5%then we choose the subset with2features(because92%≥95%?5%)and it becomes the best subset. Here are some rules the algorithm uses in Neighbor Search Phase: ?If the starting subset has only one feature,?rst test its two feature neighbors.If none of the two feature subsets is better than the current best subset,test other one feature subsets.We need to do this because the feature in the starting point may be highly correlated to the class but may have random values(like in the corral dataset). ?If accuracy of the best subset at any point is100%,there is no need to test subsets with higher number of features than the current subset. ?If more than one of the neighboring subsets are better than the best subset and if they have equal number of features,choose the more relevant subset.If that does not give any improvement (after testing its neighbors)go back to the previous state and test the next relevant subset. ?If there is only one feature in the best subset and if the accu-racy is100%stop the search. C.Finding Final Subset by Using Cross Validation k-fold cross validation is part of the algorithm and it is used for?nding the?nal best feature subset.k is user de?https://www.360docs.net/doc/ee3311596.html,er is also able to choose how many partitions of the dataset will be used for the test set and cross validation set. In our tests we mostly used10(8-1-1)fold cross validation. We used8of them for training(training set),1for testing the subsets(test set)and1for testing the?nal subsets(cross vali-dation set).For more dif?cult problems we used10(6-2-2)and 20(12-4-4)cross validation. Here is how we?nd the?nal best feature subset: ?In each fold,we?nd the best subset. ?For each feature,we?nd in how many folds that feature is a member of the best subset. ?Then,we?nd the average-times-in-best-subset value(total of times-in-best-subset values of all the features divided by the number of features).?For the?nal subset,we choose the features which appeared in subsets more than or equal the average-times-in-best-subset value. To test the?nal subset,we use the cross validation test sets in each fold.Then,we?nd the average of these test results.We also test the full feature set on the cross validation set and?nd the average. For comparing the results we also tested best feature subset at each fold on the cross validation test set of that fold.We report the average of these tests and compare the results with the tests of overall best subset we choose by using the method we explained above. VI.Datasets Corral:Corral dataset[6]has6binary features.1is highly correlated(f5)and one is irrelevant(f4).f5predicts the correct class78%of the time.Class values are determined by using: (f0∧f1)∨(f2∧f3) Parity5+5:The target concept is the parity of5bits.There are 10features in the dataset.5of the features are irrelevant. Vote:Dataset contains votes from U.S.House of Representa-tives during the98th congress[13].There are16features(each representing an issue).Each feature may take values yes,no and unknown.There are2classes(democrat and republican) and435instances. Labor:The dataset contains instances of labor contracts(ac-ceptable or unacceptable).There are16features.Total number of instances is57. Soybean:This dataset concerns the recognition of19differ-ent diseases of soy-beans.The dataset consists of35discrete features and19classes.There are683instances in the dataset. Glass:This dataset is used for glass identi?cation by crimino-logical investigation.There are9real-valued classes,7classes and214total instances. Pima:The Pima Indians Diabetes dataset consists of768cases of Native American women from the Pima tribe some of whom are diabetic,most of whom are not who were living near Phoenix,Arizona.There are8features and2classes for dia-betes per instance. Heart-C:Heart-C dataset contains instances for Cleveland Clinic Foundation’s heart disease data.There are13features (6continuous and7discrete)and5classes with303instances. The original dataset has75features but in this dataset only13 of them are used. VII.Tests We used C4.5[11]decision tree construction algorithm as our induction algorithm.We want to compare the results of sub-set selection without any effect of tree pruning.Therefore,we forced C4.5not to do any pruning by using-m1-c100parame-ters.We ran each cross validation test10times and report the averages for each test. We used three sets of data: Training data:Used for training machine learning algorithm for each subset. Test data:Used for testing the subsets. Cross validation data:Used for testing the?nal subset. D ATASETS USED IN FSS TESTS. Features Dataset#Total#Disc#Cont#Class#inst Coral66-2256 Parity5+51010-21124 V ote1616-2435 Labor1688257 Soybean3535-19683 Glass9-97214 Pima8-82768 Heart-C13765303 We report the results from our tests with the datasets we listed above in a table for each dataset.In the?rst row we give the ac-curacy and tree size for ID3and the number of features in the dataset.Then,we report the test results for sorted search phase and neighbor search phase of our algorithm.We also report tests for Sequential Forward Selection(SFS)and Sequential Back-ward Elimination(SBE).In SFS and SBE we report the results for stopping the search when the next states of the current state do not improve the accuracy(SE-Stop Early)and testing all the possible states till we reach the other end of the search space and choosing the state with the best accuracy(TA-Test All). FS and IS stand for Full Set and Individual Sets.In Full Set we choose the?nal subset by using our cross validation method we explained before.In each fold we?nd the best subset.Then, for each feature we?nd in how many folds that feature was in the best subset.For the?nal subset we choose the features which were in the?nal subset more than or equal to average times.We test this subset on cross validation test set of each fold.In IS, we test the subset we?nd in a fold on the cross validation test set of that fold and report the average for all the folds. All other researchers report their results by testing the best subsets in each fold on the test set of that fold.In the results we show that our method gives more accurate subsets most of the time.Although our method is more expensive,for most of the real world problems more accuracy will worth the computa-tional cost.Our method may very easily be parallelized.Each fold may be run in parallel.Each fold may even be further par-allelized in itself.Each subset can be evaluated in parallel in the ?rst phase.In the second phase,each neighboring state can be evaluated in parallel. We?rst tested corral dataset.In corral dataset f5is highly correlated and f4is irrelevant.As expected?rst phase of our method failed to?nd the optimal subset.But its accuracy results are not as bad as SFS-ES.Phase one of our method chose [111101]as the subset.SFS-ES chose[011001].The others chose the optimal set[111100].The best results were given by SBE.But SBE is computationally very expensive.It starts the search from full feature set and goes towards the empty set by deleting a feature from the set at each step.Building classi?ers by using few features is less expensive than using more features. SBE also tests many more states to?nd the best subset.The test results for corral dataset are listed in Table II. The results for parity5+5dataset is similar to the results of FSS TEST RESULTS FOR CORRAL DATASET10(6-2-2)CROSS VALIDATION RUN10TIMES. Accuracy Tree#States#Features Size Tested in subset ID399.6224.70 SS-FS99.6224.70 5.10 5.00 SS-IS99.5224.66 5.10 4.99 NS-FS100.0013.0013.06 4.00 NS-IS99.7513.1613.06 4.00 SFS-ES-FS85.6612.6214.03 3.40 SFS-ES-IS77.74 5.6214.03 1.81 SFS-TA-FS100.0013.0024.18 4.00 SFS-TA-IS99.8217.6224.18 4.73 SBE-ES-FS100.0013.0015.00 4.00 SBE-ES-IS100.0013.0015.00 4.00 SBE-TA-FS100.0013.0024.23 4.00 SBE-TA-IS100.0013.0024.23 4.00 corral dataset.Sort Search phase gave reasonably good results in terms of accuracy by testing very few states.But it failed to?nd the optimal subset.Neighbor search phase found the optimal subset by testing fewer states than SBE.SFS was not able to?nd the optimal subset.The test results for parity5+5 dataset are listed in Table III. TABLE III FSS TEST RESULTS FOR PARITY5+5DATASET10(8-1-1)CROSS VALIDATION RUN10TIMES. Accuracy Tree#States#Features Size Tested in subset ID370.64817.74 SS-FS99.95136.809.68 6.30 SS-IS83.21646.609.689.30 NS-FS100.0063.0046.85 5.00 NS-IS100.0063.0046.85 5.00 SFS-ES-FS43.1315.4623.35 3.60 SFS-ES-IS43.69 3.9023.35 1.51 SFS-TA-FS100.00126.9261.35 6.30 SFS-TA-IS90.24417.5461.358.20 SBE-ES-FS100.0063.0051.28 5.00 SBE-ES-IS100.0063.0051.28 5.00 SBE-TA-FS100.0063.0061.28 5.00 SBE-TA-IS100.0063.0061.28 5.00 In vote dataset,FSF and SBE gave slightly better accuracy than our method.Although the average number of features cho-sen in each fold is smaller than the number of features in the ?nal set we chose by using cross validation method,average accuracy is1%better for the subset chosen by using cross val-idation method(except for the?rst phase of our method).The test results for vote dataset are listed in Table IV. In labor dataset,cross validation method for?nding the?nal dataset gave much better accuracy for all the methods(except the sorted search phase.)But the number of features chosen for FSS TEST RESULTS FOR VOTE DATASET10(8-1-1)CROSS VALIDATION RUN 10TIMES. Accuracy Tree#States#Features Size Tested in subset ID393.6662.68 SS-FS94.1936.1913.387.60 SS-IS95.7317.4613.38 4.14 NS-FS95.3324.5564.03 4.70 NS-IS94.6610.4264.03 2.15 SFS-ES-FS95.6618.2834.87 3.90 SFS-ES-IS94.50 5.1434.87 1.28 SFS-TA-FS95.2027.97149.93 6.30 SFS-TA-IS94.4018.16149.93 3.98 SBE-ES-FS95.8829.20136.86 5.80 SBE-ES-IS94.9714.71136.86 2.90 SBE-TA-FS96.0228.93141.16 5.70 SBE-TA-IS94.9714.53141.16 2.87 the?nal subset in cross validation method is much higher than the average number of features in each subsets found in each fold.The test results for labor dataset are listed in Table V. TABLE V FSS TEST RESULTS FOR LABOR DATASET10(8-1-1)CROSS VALIDATION RUN10TIMES. Accuracy Tree#States#Features Size Tested in subset ID380.6021.90 SS-FS80.8019.707.527.25 SS-IS86.5010.597.52 4.32 NS-FS83.9017.0930.47 5.75 NS-IS78.30 5.9130.47 1.55 SFS-ES-FS81.1019.4933.05 6.40 SFS-ES-IS75.80 4.4033.05 1.14 SFS-TA-FS80.5019.38150.40 6.60 SFS-TA-IS75.70 4.52150.40 1.17 SBE-ES-FS81.7017.29118.94 5.05 SBE-ES-IS80.107.82118.94 1.80 SBE-TA-FS81.0018.49139.30 6.05 SBE-TA-IS75.00 6.94139.30 1.53 Soybean dataset is a relatively dif?cult dataset for Feature Subset Selection because of the size of the feature set(35fea-tures).Our method performed good in both phases and elimi-nated almost half of the features.SFS and SBE also eliminated almost half of the features but with worse accuracy than our method.Results for the Soybean dataset is given in Table VI. Glass dataset has10continuous features.All the methods chose approximately4of those features.Our method gave slightly better accuracy and slightly smaller subset compared to SFS and SBE.Choosing the?nal subset by using cross valida-tion method we explained before improves the accuracy for all the methods.Results for the Glass dataset is given in Table VII. Pima dataset has8continuous features.Our method chose FSS TEST RESULTS FOR S OYBEAN DATASET10(8-1-1)CROSS VALIDATION RUN10TIMES. Accuracy Tree#States#Features Size Tested in subset ID390.20247.57 SS-FS90.11152.3235.0023.10 SS-IS90.67178.5035.0028.60 NS-FS90.97194.95570.3317.30 NS-IS87.84184.92570.3313.66 SFS-ES-FS89.03179.27309.6814.50 SFS-ES-IS82.43150.70309.689.03 SFS-TA-FS89.48255.66644.2716.90 SFS-TA-IS88.19227.67644.2716.16 SBE-ES-FS88.43284.01516.2118.10 SBE-ES-IS87.48279.70516.2115.46 SBE-TA-FS88.70280.46637.7817.70 SBE-TA-IS87.03278.62637.7814.89 around3features at both phases.SFS and SBE chose slightly larger sets with worse accuracy than our method.Final subset selection by using cross validation improves accuracy around1 percent but increases the size of the subset slightly.Results for the Pima dataset is given in Table VIII. TABLE VII FSS TEST RESULTS FOR G LASS DATASET10(8-1-1)CROSS VALIDATION RUN10TIMES. Accuracy Tree#States#Features Size Tested in subset ID368.1365.88 SS-FS70.0561.489.00 4.50 SS-IS67.9860.489.00 4.92 NS-FS69.1861.4828.33 4.10 NS-IS66.9862.9428.33 4.16 SFS-ES-FS68.7063.1428.81 4.30 SFS-ES-IS60.1657.6228.81 2.66 SFS-TA-FS68.7962.4649.26 4.50 SFS-TA-IS65.7665.4849.26 4.14 SBE-ES-FS68.2260.8835.17 4.30 SBE-ES-IS68.0365.1635.17 5.00 SBE-TA-FS68.1461.6248.92 4.30 SBE-TA-IS67.0964.0648.92 4.47 Our method in both phases outperformed both SFS and SBE in Cleveland Heart Diesease database.Its accuracy is at least2% more than the accuracy of SFS or SBE and the subsets it found are smaller than the subsets SFS or SBE found(except for SFS -ES-IS which had a very small subset but very low accuracy). Results for the Heart-C dataset is given in Table IX. Our tests show that the new Feature Subset Selection by sort-ing features by their relevancy algorithm chooses smaller sub-sets with better accuracy than the original feature set.The new algorithm usually tests fewer states than either SFS or SBE al-gorithms.The method we used for choosing the?nal feature 7 TABLE VIII FSS TEST RESULTS FOR P IMA DIABETES DATASET10(8-1-1)CROSS VALIDATION RUN10TIMES. Accuracy Tree#States#Features Size Tested in subset ID373.1662.86 SS-FS73.8521.088.00 3.00 SS-IS73.2820.268.00 2.94 NS-FS73.9422.9620.74 3.00 NS-IS72.6119.4220.74 2.82 SFS-ES-FS73.7528.1221.73 3.40 SFS-ES-IS71.6111.4221.73 2.08 SFS-TA-FS73.7433.4239.92 4.10 SFS-TA-IS72.3525.2839.92 3.60 SBE-ES-FS73.7527.1030.65 3.40 SBE-ES-IS72.4133.6030.65 4.02 SBE-TA-FS73.7229.7840.22 3.70 SBE-TA-IS72.3227.1840.22 3.45 TABLE IX FSS TEST RESULTS FOR H EART-C DATASET10(8-1-1)CROSS VALIDATION RUN10TIMES. Accuracy Tree#States#Features Size Tested in subset ID374.22108.50 SS-FS80.6034.2713.00 4.10 SS-IS79.3936.4413.00 4.08 NS-FS80.3649.2940.52 4.50 NS-IS78.7637.8140.52 4.00 SFS-ES-FS78.2254.7631.77 4.80 SFS-ES-IS72.517.6131.77 1.64 SFS-TA-FS74.7868.51100.04 6.10 SFS-TA-IS73.3844.33100.04 4.81 SBE-ES-FS77.5386.3971.22 6.30 SBE-ES-IS74.8491.0371.227.14 SBE-TA-FS77.4677.6798.00 6.50 SBE-TA-IS74.6464.2198.00 5.49 subset improves accuracy(for the new method and also for SFS and SBE)over choosing the subset at each individual fold of cross validation. VIII.Conclusion In real world applications usually there are many features some of which may not be relevant to the problem domain. They may even be adding noise to the https://www.360docs.net/doc/ee3311596.html,ually a subset of the features will speed learning process and will im-prove accuracy.Some of the features may also be expen-sive to acquire(like in medical applications).FSS is a search and optimization problem.The search space is very big even for small set of features.The number of possible states is 2n(n:number of features).So an exhaustive search is not possible if n is not very small.Researchers developed other heuristic methods which are not computationally as expensive as exhaustive search.But still they require many tests of the states in the search space.Our method?nds a starting point by sort-ing the features in the beginning and therefore visits fewer states than other methods.In most of the tests we have done,accuracy was improved when compared to the original feature set.The method we used for choosing the?nal feature subset improves accuracy(for the new method and also for SFS and SBE)and we believe it chooses more reliable subsets since it is using k-fold cross validation for choosing the subset.We showed that the new algorithm tests fewer states than SFS and SBE.This shows that starting the search from a state chosen by using feature rel-evancy decreases the number of states to be tested. Our method is very easy to parallelize.In the sorted search part,each subset can be tested in parallel.In the neighbor search part,again each subset can be tested in parallel to?nd the next best subset.Since we use k-fold cross validation each fold can be evaluated in parallel too. We are planning to make the new method use any available domain knowledge about the problem.To be able to apply a feature selection algorithm to a problem more successfully any knowledge about the problem may improve the results greatly. If we know which features are strongly relevant to the classes we may eliminate the irrelevant ones without any computation. Then,we can use FSS to?nd a better subset.If we know that a feature is strongly correlated to a class and its values are random, then removing that feature will improve the subset greatly(like in corral dataset). References [1]H.Almuallim and T.G.Dietterich.Learning with many irrelevant features. In Proceedings of the Ninth National Conference on Arti?cial Intelligence (AAAI-91),volume2,pages547–552,Anaheim,California,July1991. AAAI Press. [2] https://www.360docs.net/doc/ee3311596.html,ing decision trees to improve case–based learning.In Proceedings of the Tenth International Conference on Machine Learning, pages25–32.Morgan Kaufmann Publishers,Inc.,1993. [3]R.Caruana and D.Freitag.Greedy attribute selection.In Proceedings of the Eleventh Inter national Conference on Machine Learning,pages180–189.Morgan Kaufmann,1994. [4]P.A.Devijver and J.Kittler.Pattern Recognition:A Statistical Approach. Prentice-Hall International,1982. [5]J.Doak.Intrusion Detection:The Application of Feature Selection,A Comparison of Algorithms,and the Application of a Wide Area Network Analyzer.Master’s thesis,University of California,Davis,Dept.of Com-puter Science,1992. [6]G.John,R.Kohavi,and K.P?eger.Irrelevant features and the subset selection problem.In Machine Learning:Proceedings of the Eleventh International Conference,pages121–129.Morgan Kaufmann,1994. [7]K.Kira and L.A.Rendell.The feature selection problem:Traditional methods and a new algorithm.In W.Swartout,editor,Proceedings of the 10th National Conference on Arti?cial Intelligence,pages129–134,San Jose,CA,July1992.MIT Press. [8] https://www.360docs.net/doc/ee3311596.html,ler.Subset Selection in Regression.Chapman and Hall,1990. [9]P.Narendra and K.Fukunaga.A branch and bound algorithm for fea- ture subset se lection.IEEE Transactions on Computing,77(26):917–922, 1977. [10]J.R.Quinlan.Induction of decision trees.Machine Learning,1(1):81– 106,1986.QUINLAN86. [11]J.R.Quinlan.C4.5:Programs for Machine Learning.Morgan Kaufmann, 1992. [12]J.R.Quinlan.Learning decision tree classi?ers.ACM Computing Surveys, 28(1):71–72,Mar.1996. [13]J.C.Schlimmer and D.H.Fisher.A case study of incremental concept in- duction.In T.Kehler and S.Rosenschein,editors,Proceedings of the Fifth National Conference on Arti?cial Intelligence,Philadelphia,volume1, pages496–501,San Mateo,CA,1986.