Detection of Hazelnut Oil Adulteration Using FT-IR
ARTICLES
Detection of Hazelnut Oil Adulteration Using FT-IR
Spectroscopy
B ANU F.O ZEN AND L ISA J.M AUER*
Food Science Department,Purdue University,1160Food Science Building,
West Lafayette,Indiana47907
Fourier transform infrared spectroscopy(FT-IR)was used to detect the adulteration of hazelnut oil with different types of oils and to detect the adulteration of extra-virgin olive oil with hazelnut oil. Spectra of hazelnut oil,seven other types of oils,extra-virgin olive oil,and the adulterated oils were collected with a FT-IR equipped with a ZnSe-ATR accessory and a MCTA detector.Discriminant analysis and partial least-squares analysis were used to analyze the data.Classification of hazelnut oil,olive oil,and the other types of oils was achieved successfully with FT-IR.The detection level for sunflower oil adulteration of hazelnut oil was2%,and the correlation coefficient for the PLS model was0.99.Adulteration of virgin olive oil with hazelnut oil could be detected only at levels of25%and higher.
KEYWORDS:Fourier transform infrared spectroscopy;hazelnut oil;adulteration
INTRODUCTION
Adulteration of food products,involving the replacement of high-cost ingredients with cheaper substitutes,is a type of economic fraud that can pose a major health threat to consumers. Oil adulteration received much attention in the1980s after consumption of adulterated rapeseed and grapeseed oils caused more than400deaths and20,000illnesses from toxic-oil syndrome(1,2).Adulteration of oils currently is a concern in the food industry,especially for high-priced oils such as olive oil,and there is a need for rapid and simple detection methods for oil adulteration.It was reported that adulteration of olive oil with hazelnut oil causes an economic loss of approximately 4million euros per year for countries in the European Union, and development of official methods for the detection of adulteration at the concentrations of interest(2-20%)is an important issue for regulatory agencies,oil suppliers,and consumers(3).
As the potential for profit increases,methods of food adulteration become more sophisticated,and traditional methods used in detection of adulterants become more time-consuming and expensive.Detection of the latest olive oil fraud,involving the substitution of5-20%hazelnut oil for olive oil,presents a major challenge for food scientists because the fatty acid and sterol composition and the oxidative stability of hazelnut oil are very similar to those of olive oil(4,5).Hazelnut oil also is gaining recognition as a high-quality food product as it is a good source of vitamin E and monounsaturated fatty acids,which are known to lower total and LDL cholesterol levels without affecting the HDL level(6).Therefore,adulteration of hazelnut oil,itself,with cheaper oils also has become a concern. Analysis of flavoring components of hazelnut oil by GC, RPLC-GC,and isotopic assays(7-10),and assessment of sterols and triacylglycerols in hazelnut oil with NMR and GC (11-13)are the recent proposed methods for the detection of olive oil adulteration with hazelnut oil.However,some of these analyses are time-consuming and labor intensive.Over the past few years,Fourier transform infrared(FT-IR)spectroscopy has emerged as a rapid food analysis tool with minimum sample preparation necessary,and FT-IR methods have been used successfully to detect adulteration of extra-virgin olive oil with refined olive oils and different types of vegetable and nut oils (14-17).Depending on the adulterant oil,detection limits for olive adulteration were as low as2%,and analysis could be completed in less than5min.Similar rapid FT-IR methods could be developed for the detection of hazelnut-oil-related adultera-tion.
The objectives of this study were the following:(1)to differentiate between hazelnut and other oils;(2)to detect the adulteration of hazelnut oil with different types of oils;and(3) to detect the adulteration of extra-virgin olive oil with hazelnut oil using FT-IR spectroscopy and multivariate statistical pro-cedures.
MATERIALS AND METHODS
Samples.Eleven hazelnut oils,twenty-five olive oils,and seven other types of oil(canola,soybean,corn,sunflower,sesame,walnut,and peanut)were purchased from local grocery stores and Internet suppliers.
*To whom correspondence should be addressed.Tel:765-494-9111.
Fax:765-494-7953.E-mail:mauer@https://www.360docs.net/doc/fa15338101.html,.
3898J.Agric.Food Chem.2002,50,3898?3901
10.1021/jf0201834CCC:$22.00?2002American Chemical Society
Published on Web06/07/2002
For the adulteration studies,10olive oil and 10hazelnut oil brands were randomly chosen from the samples purchased,and blends of olive oil and hazelnut oil were prepared by mixing these oils.The hazelnut oil blend was adulterated with sunflower oil at 2-10%(vol/vol),and the blend of extra-virgin olive oils was adulterated with the hazelnut oil blend at 5-50%(vol/vol).Infrared spectra of pure oil samples (25virgin olive oils,11hazelnut oils,and canola,soybean,corn,sunflower,sesame,walnut,and peanut oils)and adulterated samples then were obtained.
GC analysis determined that the oil samples used for these adulteration studies had the following fatty acid compositions.Hazelnut oil contained 5.17%palmitic,0.16%palmitoleic,2.43%stearic,81.54%oleic,10.37%linoleic,and 0.13%R -linolenic acids.Olive oil contained 11.52%palmitic,0.83%palmitoleic,2.83%stearic,72.67%oleic,8.12%linoleic,and 0.68%R -linolenic acids.Sunflower oil contained 5.95%palmitic,4.60%stearic,17.66%oleic,70.60%linoleic,and 0.21%R -linolenic acids.
Instrumentation.All infrared spectra were acquired using a ThermoNicolet Nexus 670FT-IR spectrometer (ThermoNicolet Ana-lytical Instruments,Madison,WI)equipped with a mercury cadmium telluride A (MCTA)detector and KBr optics.Measurements were obtained by using 128scans at 4cm -1resolution with a ZnSe single bounce attenuated total reflectance (ATR)accessory.
Statistical Analysis.Analysis of the data was performed by classical multivariate procedures including discriminant analysis (DA)and partial least-squares (PLS)analysis with TQ software (ThermoNicolet,Madi-son,WI).DA was used for the classification of the samples.When this classification was successful,PLS was applied to adulterated samples to obtain a calibration based on the level of adulteration.Spectral regions where variations were observed were chosen for developing DA and PLS models.For PLS analysis,fourteen samples were used for calibration and four samples were used for validation.Validity of the models was checked by running several diagnostics including eigen analysis,cross-validation,and predicted residual error sum of squares (PRESS).RESULTS AND DISCUSSION
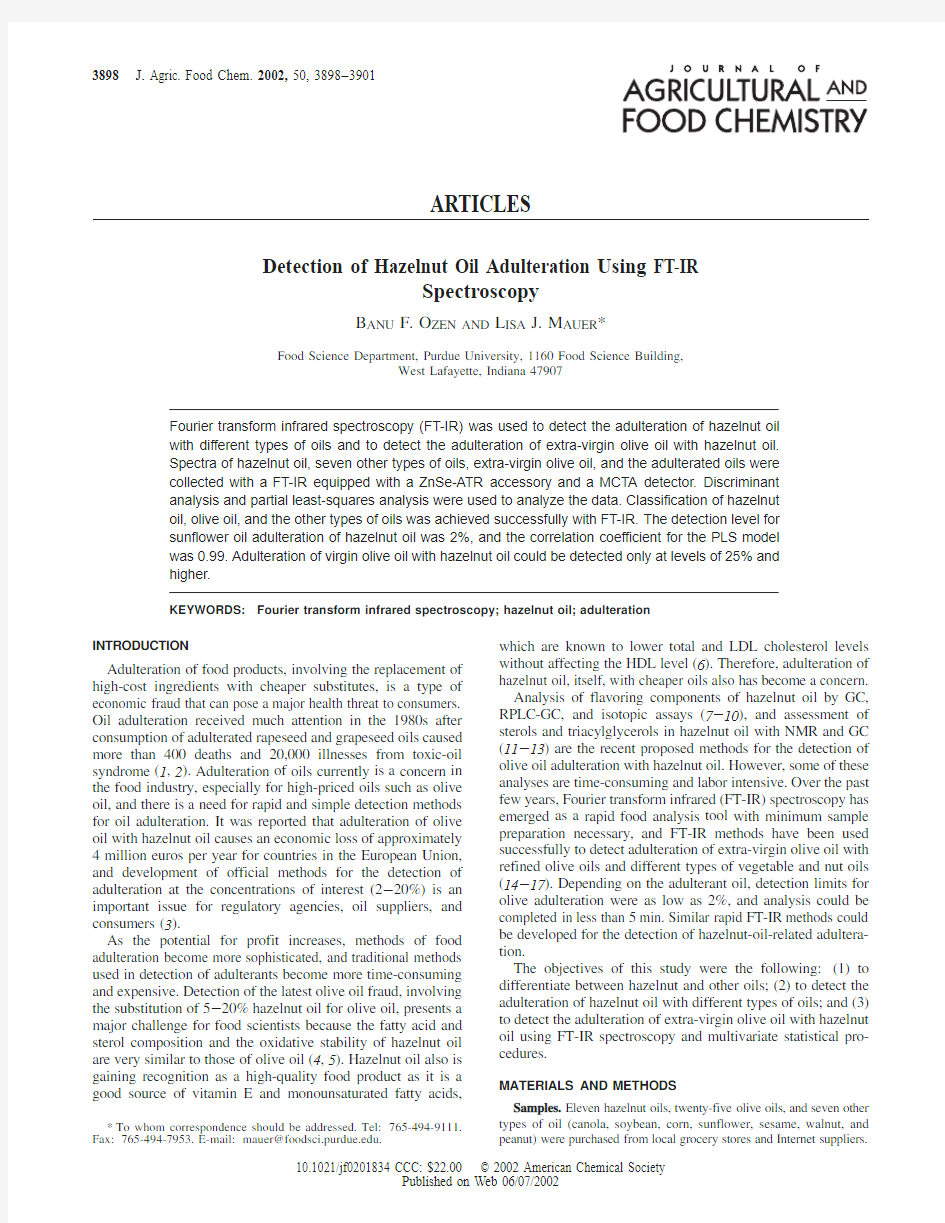
The first part of this study involved structurally differentiating between hazelnut oil and other oils and then detecting adulterat-ing oils in hazelnut oil.For this purpose,the spectra of pure hazelnut oil were compared with the spectra of seven other oil types (canola,corn,peanut,sesame,soybean,sunflower,and walnut oils).Spectra of hazelnut and other types of oils in the 1400-900cm -1region are shown in Figure 1to illustrate some
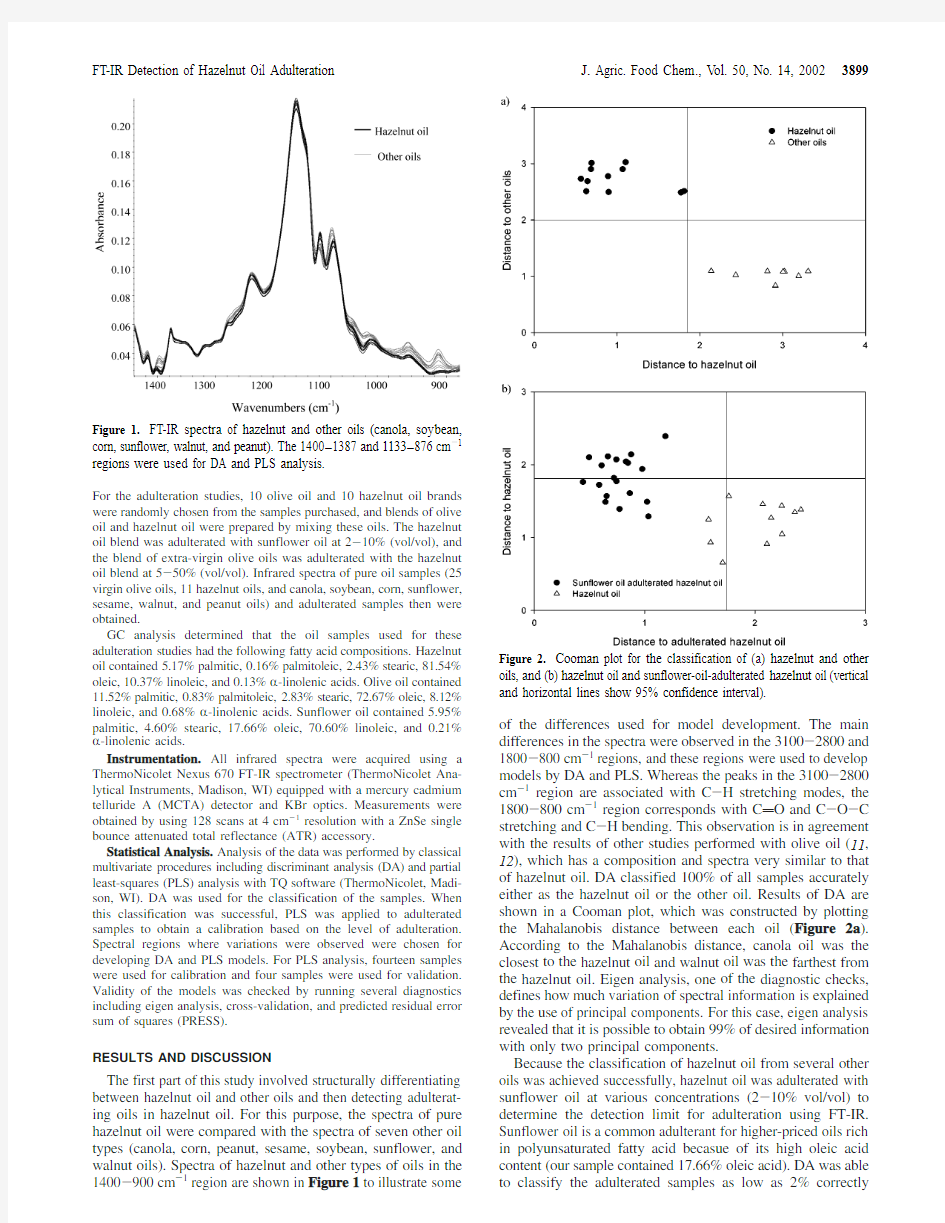
of the differences used for model development.The main differences in the spectra were observed in the 3100-2800and 1800-800cm -1regions,and these regions were used to develop models by DA and PLS.Whereas the peaks in the 3100-2800cm -1region are associated with C -H stretching modes,the 1800-800cm -1region corresponds with C d O and C -O -C stretching and C -H bending.This observation is in agreement with the results of other studies performed with olive oil (11,12),which has a composition and spectra very similar to that of hazelnut oil.DA classified 100%of all samples accurately either as the hazelnut oil or the other oil.Results of DA are shown in a Cooman plot,which was constructed by plotting the Mahalanobis distance between each oil (Figure 2a ).According to the Mahalanobis distance,canola oil was the closest to the hazelnut oil and walnut oil was the farthest from the hazelnut oil.Eigen analysis,one of the diagnostic checks,defines how much variation of spectral information is explained by the use of principal components.For this case,eigen analysis revealed that it is possible to obtain 99%of desired information with only two principal components.
Because the classification of hazelnut oil from several other oils was achieved successfully,hazelnut oil was adulterated with sunflower oil at various concentrations (2-10%vol/vol)to determine the detection limit for adulteration using FT-IR.Sunflower oil is a common adulterant for higher-priced oils rich in polyunsaturated fatty acid becasue of its high oleic acid content (our sample contained 17.66%oleic acid).DA was able to classify the adulterated samples as low as 2%
correctly
Figure 1.FT-IR spectra of hazelnut and other oils (canola,soybean,
corn,sunflower,walnut,and peanut).The 1400?1387and 1133?876cm -1regions were used for DA and PLS
analysis.
Figure 2.Cooman plot for the classification of (a)hazelnut and other
oils,and (b)hazelnut oil and sunflower-oil-adulterated hazelnut oil (vertical and horizontal lines show 95%confidence interval).
FT-IR Detection of Hazelnut Oil Adulteration J.Agric.Food Chem.,Vol.50,No.14,20023899
(Figure 2b ),and 99%of the desired information could be obtained with nine principal components.Following the success of classification,data also were analyzed by PLS to construct a calibration curve.Figure 3a shows the concentration values obtained from the PLS model versus the actual concentration of sunflower oil in hazelnut oil.Cross-validation was one of several diagnostics run to validate the PLS model.Cross-validation was performed by removing one standard at a time,and a reasonable R 2value of 0.84was obtained (Figure 3b ).Also,PRESS values were calculated for different principal component factors.PRESS values and the eigen analysis suggested that six principal components were enough to extract 99%of the desired information used for detecting hazelnut oil adulteration.
Detection of olive oil adulteration with hazelnut oil was then studied using FT-IR.The averages from 11hazelnut oil and 25olive oil spectra for the region of interest are shown in Figure 4.The only difference between these spectra was the intensity of the bands in the 1300-1000cm -1region.This area is in the fingerprint region of the infrared spectra,and the peaks in this region are associated with C -O stretching and OH deformation for alcohols.DA using the 1300-1000cm -1region successfully classified the pure hazelnut and extra-virgin olive oils (Figure 5a ).The lowest concentration at which 100%of the samples were classified correctly was 25%for hazelnut-oil-adulterated olive oil.Even at this concentration,adulterated and pure sample
classes were very close to each other,as shown in the Cooman plot (Figure 5b ).Both olive and hazelnut oil compositions show variations depending on the source of the oil.Olive oil contains 56-83%oleic,7.5-20%palmitic,3.5-20%linoleic,0.5-
5%
Figure 3.(a)Calibration curve for sunflower-oil-adulterated hazelnut oil,
and (b)cross-validation of the PLS
model.
Figure 4.FT-IR spectra of hazelnut and extra-virgin olive
oils.
Figure 5.Cooman plot for the classification of (a)extra-virgin olive oil
and hazelnut oil,and (b)extra-virgin olive oil and hazelnut-oil-adulterated olive oil (vertical and horizontal lines show 95%confidence interval).
3900J.Agric.Food Chem.,Vol.50,No.14,2002Ozen and Mauer
stearic,and1%palmitoleic acids(17).The composition of hazelnut oil is very similar to that of olive oil,and76-84.6% oleic,5-7.2%palmitic,8.4-21.9%linoleic,1.2-2.5%stearic, and0.3%palmitoleic acids are present in hazelnut oil(4,19-21).GC analysis confirmed that the fatty acid composition of our samples was in these ranges.Although FT-IR was successful in classifying the pure hazelnut and olive oils,the compositional similarities of hazelnut and olive oil limit the ability to use FT-IR for the detection of adulteration of olive oils with hazelnut oil.This limitation also is seen in the other adulteration detection methods that depend on compositional analysis.
In summary,FT-IR is a useful tool to rapidly differentiate between pure hazelnut oil and other oils as well as to detect hazelnut oil adulteration by sunflower oil.Adulteration as low as2%could be detected accurately and rapidly using FT-IR in combination with multivariate statistics for hazelnut oil adulter-ated by sunflower oil.However,FT-IR is unable to detect olive oil adulteration with5-20%hazelnut oil. ACKNOWLEDGMENT
Many thanks to Jay Gore,Sivakumar Santhanakrishnan,and Bruce Watkins.
LITERATURE CITED
(1)Jimeno,S.A.The Spanish toxic symptoms.Trends Anal.Chem.
1982,1,4-6.
(2)Posada,M.;Castro,M.;Kilbourne, E.;Diaz-de-Rojas,R.;
Abaitua,I.;Tabuenca,J.;Vioque,A.Toxic-oil syndrome:case reports associated with the ITH oil refinery in Sevilla.Food Chem.Toxicol.1987,25,87-90.
(3)European Union Research Committee.Development and assess-
ment of methods for the detection of adulteration of olive oil with hazelnut oil.Press Release.Brussels,Belgium,October10, 2001.
(4)Parcerisa,J.;Richardson,D.G.;Rafecas,M.;Codony,R.;
Boatella,J.Fatty acid,tocopherol and sterol content of some hazelnut varieties(Corylus a V ellana L.)harvested in Oregon (USA).J.Chromatogr.1998,805,259-268.
(5)Contini,M.;Cardarelli,M.T.;Santis,D.;Frangipane,M.T.;
Anelli,G.Proposal for the edible use of cold pressed hazelnut oil.I.Evaluation of oxidative stability.Ri V.Ital.Sostanze Grasse 1997,74,97-104.
(6)Ozdemir,M.;Devers,O.Turkish hazelnuts:properties and effect
of microbiological and chemical changes on quality.Food Re V.
Int.1999,15,309-333.
(7)Blanch,G.P.;Caja,M.M.;Leon,M.;Herraiz,M.Determination
of(E)-5-methylhept-2-en-4-one in deodorized hazelnut oil.
Application to the detection of adulterated olive oils.J.Sci.Food Agric.2000,80,140-144.
(8)Caja,M.M.;Ruiz del Castillo,M.L.;Herraiz,M.;Blanch,G.
P.Study of the enantiomeric composition of chiral constituents
in edible oils by simultaneous distillation-extraction.Detection of adulterated oils.J.Am.Oil Chem.S oc.1999,76,1027-1030.
(9)Pfnuer,P.;Matsui,T.;Grosch,W.;Guth,H.;Hofmann,
Schieberle,P.Development of a stable isotope dilution assay for the quantification of5-methyl-(E)-2-hepten-4-one:applica-tion to hazelnut oils and hazelnuts.J.Agric.Food Chem.1999, 47,2044-2047.
(10)Ruiz del Castillo,M.L.;Caja,M.M.;Herraiz,M.;Blanch,G.
P.Rapid recognition of olive oil adulterated with hazelnut oil by direct analysis of the enantiomeric composition of filbertone.
J.Agric.Food Chem.1998,46,5128-5131.
(11)Vichi,S.;Pizzale,L.;Toffano,E.;Bortolomeazzi,R.;Conte,L.
Detection of hazelnut oil in virgin olive oil by assessment of free sterols and triacylglycerols.JAOAC Int.2001,84,1534-1541.
(12)Gordon,M.H.;Covell,C.;Kirsch,N.Detection of pressed
hazelnut oil in admixtures with virgin olive oil by analysis of polar components.J.Am.Oil Chem.Soc.2001,78,621-624.
(13)Mannina,L.;Patumi,M.;Fiordiponti,P.;Emanuele,M.C.;
Segre,A.L.Olive and hazelnut oils:a study by high-field1H NMR and gas chromatography.Ital.J.Food Sci.1999,11,139-149.
(14)Tay,A.;Singh,R.K.;Krishnan,S.S.;Gore,J.P.Authentication
of olive oil adulterated with vegetable oils using Fourier transform infrared spectroscopy.Lebens.-Wiss.Technol.2002, 35,99-103.
(15)Kupper,L.;Heise,H.M.;Lampen,P.;Davies,A.N.;McIntyre,
P.Authentication and quantification of extra-virgin olive oils by attenuated total reflectance infrared spectroscopy using silver halide fiber probes and partial least-squares calibration.Appl.
Spectrosc.2001,55,563-570.
(16)Marigheto,N.A.;Kemsley,E.K.;Defernez,M.;Wilson,R.H.
A comparison of mid-infrared and Raman spectroscopies for the
authentication of edible oils.J.Am.Oil Chem.Soc.1998,75, 987-992.
(17)Lai,Y.W.;Kemsley,E.K.;Wilson,R.H.Quantitative analysis
of potential adulterants of extra-virgin olive oil using infrared spectroscopy.Food Chem.1995,53,95-98.
(18)Kiritakis,A.;Markakis,P.Olive oil:a review.Ad V.Food Res.
1987,31,453-482.
(19)Garcia-Olmedo,R.;Vallis-Palles,C.;Diaz-Marquina.Constitu-
ents of Spanish nut oils.An.Bromatol.1979,31,137-158. (20)Hyung,H.;Hyo,S.Lipid components of hazelnut oil.Korean
J.Food Sci.Tech.1978,10,361-365.
(21)Eckey,E.W.Vegetable Fats and Oils.Reinhold Publishing:
New York,1954.
Received for review February11,2002.Revised manuscript received May6,2002.Accepted May6,2002.This research was supported in part by Indiana21st Century Research&Technology Fund grant 1220001695.This is journal article16717of the Purdue University Agricultural Research Programs.
JF0201834
FT-IR Detection of Hazelnut Oil Adulteration J.Agric.Food Chem.,Vol.50,No.14,20023901