Workload-adaptive cruise control – A new generation of advanced driver assistance systems
Workload-adaptive cruise control –A new generation
of advanced driver assistance
systems
W.Hajek a ,?,I.Gaponova a ,K.H.Fleischer a ,J.Krems b
a
BMW Group Research and Technology,Munich,Germany b Department of Cognitive and Work Psychology,Chemnitz University of Technology,Chemnitz,Germany
a r t i c l e i n f o Article history:Received 4September 2012Received in revised form 5May 2013Accepted 2June 2013Keywords:Adaptation Advanced driving assistant system Physiological measurement ACC Vital data Safety Workload
a b s t r a c t
A foreseeable development of advanced driver assistance systems (ADAS)is the adaptation
of ADAS’s control parameters to the actual workload of the human operator,enabling a
level of assistance appropriately gauged to a driver’s current resources.Before such a fea-
ture can be introduced,however,three questions must be answered:(1)Is it technically
possible to detect high workload levels using low-interference techniques?(2)Can such
a system increase safety?(3)How can acceptance of such a system be optimized and con-
fusion minimized?To answer these questions a simulator study was conducted using two
systems:?rst,regular active cruise control (ACC)and second,workload-adaptive cruise
control (WACC)systems.Participants were connected to a physiological signal measure-
ment device that recorded heart rate,galvanic skin response and respiration.Participants
also ?lled out subjective questionnaires to establish acceptance and system awareness.
In cases for which usable physiological data were available,high workload conditions were
identi?ed in 83.7%of the classi?cation sample by an algorithm based on physiological mea-
surements.These data show that it is technologically possible to adapt driver assistance
systems that employ physiological data for the detection of driver workload.Subjective
measurements showed a preference for the WACC system.Moreover,objective data mea-
surements revealed a safety advantage of the WACC over the ACC system:using WACC,no
signi?cant difference in brake reaction time,but a signi?cant lower rate of deceleration,
was found.Furthermore,85.1%of participants were unaware of the adaptive behavior of
the WACC,which was simulated by a change from a 1-s to a 2-s headway.These results
suggest that a nondetectable change in regulation parameters led to higher safety in critical
situations.Therefore,WACC systems should be considered as a next step in the develop-
ment of ADAS.
ó2013Elsevier Ltd.All rights reserved.1.Introduction
Advanced driver assistance systems (ADAS)aim to prevent vehicular accidents by,for example,providing proximity warnings and maintaining safe distances to other vehicles or road objects using time-to-collision measurements.Currently,parameters that inform these types of warnings are based on chosen preferences of drivers or static preferences of car man-ufacturers.Thus,these parameters are not automatically adapted to changes in a driver’s state.This is a critical issue,because 1369-8478/$-see front matter ó2013Elsevier Ltd.All rights reserved.https://www.360docs.net/doc/fe18697518.html,/10.1016/j.trf.2013.06.001
?Corresponding author.Address:BMW Group Research and Technology,Hanauerstra?e 46,80992Munich,Germany.Tel.:+4917610150212.
E-mail addresses:Wilfried.Hajek@bmw.de ,willihajek@gmx.at (W.Hajek),Irina.Gaponova@bmw.de (I.Gaponova),Karl-Heinz.Fleischer@bmw.de (K.H.Fleischer).
W.Hajek et al./Transportation Research Part F20(2013)108–120109 a driver’s reaction-and control-related abilities are dependent on actual workload(Jamson&Merat,2005;Lamble, Kauranen,Laakso,&Summala,1999).
Mental workload,also called mental effort,is the sum of the costs of cognitive processing and is re?ected in physiological measurements,such as heart rate(HR),HR variability,respiration and galvanic skin response(GSR)(Brookhuis&de Waard, 2010;de Waard,1996;Mayser,Piechulla,Weiss,&K?nig,2003;Veltman&Gaillard,1998).According to Rouse,Edwards,and Hammer(1993),the term‘‘experienced load’’includes task-speci?c,as well as person-speci?c capabilities that differ from human to human and,therefore,leads to a better understanding of inter-individual differences in the experience of work-load.The limited capacity processing theory(Kahneman,1973)postulates an overall capacity from which resources are ex-tracted to accomplish demands,which lead to high workload.The amount of energy needed to accomplish these demands is de?ned as effort,and is twofold:state-related effort,which is de?ned as the amount of energy necessary to maintain an opti-mal state for performance;and task-related effort,de?ned as the energy necessary for controlled information processing. Our research focuses on task-related effort,which is manipulated through changes in a secondary task.
Physiological indicators of arousal can be measured by HR,respiration and GSR,which are indicators for changes in men-tal workload induced by secondary tasks(Brookhuis,de Vries,&de Waard,1991;Liu&Lee2006;Mehler,Reimer,&Cough-lin,2012;Mehler,Reimer,Coughlin,&Dusek,2009;Mehler,Reimer&Coughlin,2011).The connection between arousal and performance has been investigated for decades(Duffy,1957;Freeman,1940).A relationship between these two variables was introduced as the Yerkes Dodson–law(Yerkes&Dodson,1908)in the early20th century,showing a reverse U-shaped relationship between arousal and performance.That is,subjects show optimal performance with a medium level of arousal, whereas too low or too high arousal leads to a decrease in performance.The Yerkes–Dodson law was adapted for the task of driving by Coughlin,Reimer,and Mehler(2011);for a detailed graphic depiction,see referenced paper.According to this the-ory,overload is characterized by a high level of stress,which should be decreased by calming interventions to return to opti-mal performance.Underload is characterized by fatigue,boredom or a state of over-relaxedness.Under these conditions,a driver has to be alerted to reach optimal performance.While underload and overload may not pose a danger in noncritical driving situations,they may indeed become dangerous if a critical situation does arise.Clearly,workload-adaptive systems should support optimal performance levels of drivers,as dangerous situations may occur at any time while driving.
Today,the task of driving modern vehicles is characterized by the use of several automatic and semi-automatic driver assistance systems,which operate independent from a driver’s workload level(e.g.,ACC,Lane departure control).Fixed timed warning parameters can be manually adjusted or generally set according to human-independent measures of the car and its environment.Tests with automatic and semi-automatic systems show in particular that human drivers cannot easily and continually supervise systems and then regain control when a situation demands it.This is better known as the out-of-the-loop problem(Endsley&Kiris,1995;Kaber&Endsley,1997)and is more problematic when,during the driv-ing task,critical situations occur with low frequency,which is common in real-life settings on the road.
Future highly automatic ADAS should be developed in light of driver workload such that drivers’workload level is opti-mized and out-of-the-loop events are prevented.In a novel proposal by MIT,the so-called AwareCar(Coughlin,Reimer,& Mehler,2009),detects,displays and refreshes(i.e.,alerting or calming)the driver to ensure that he is capable of optimal per-formance,representing one method of addressing this issue.
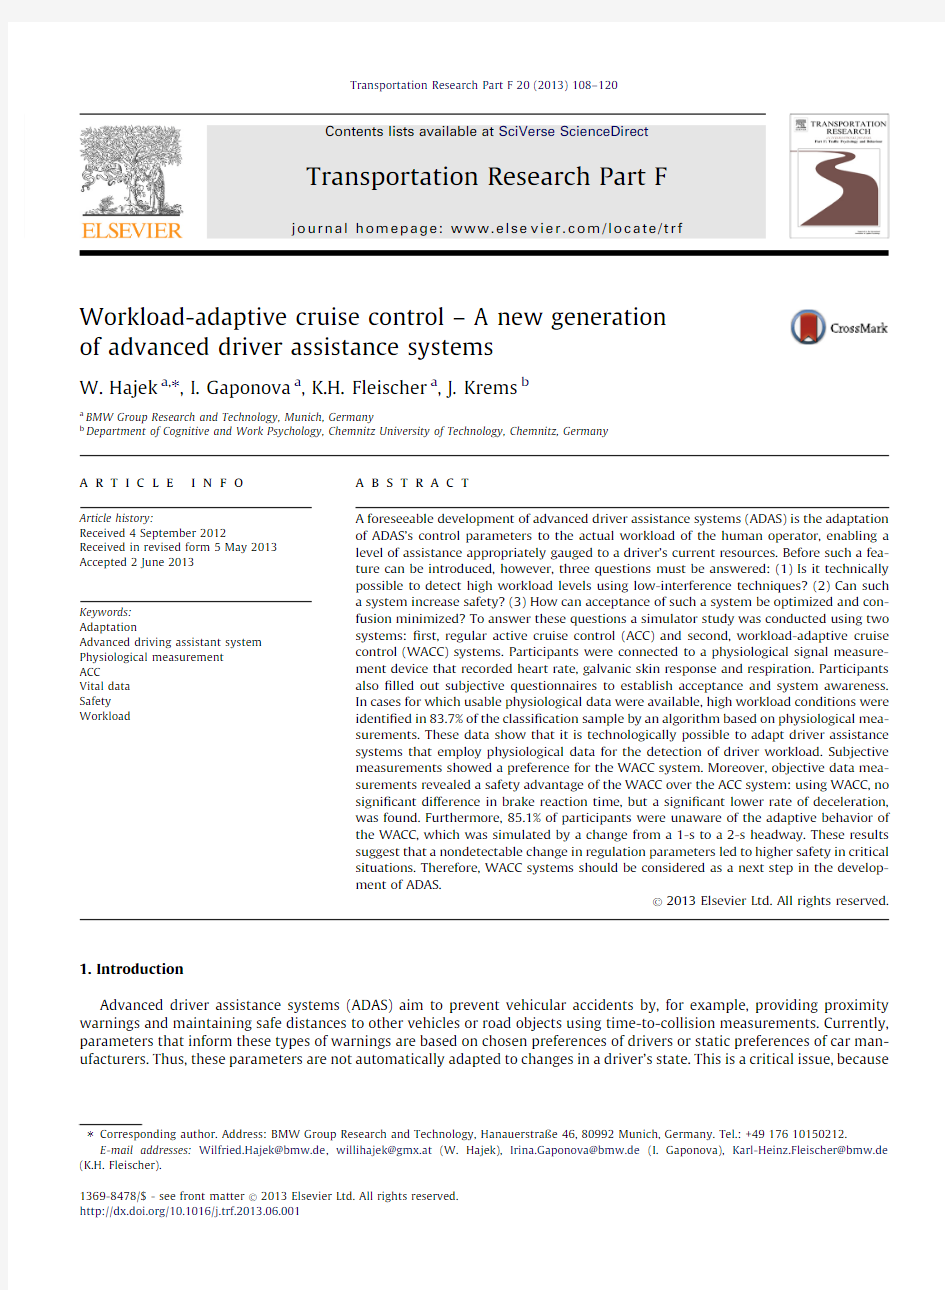
Based on these theoretical approaches,this paper describes the experimental results of a driving simulator study with a WACC and non-adaptive ACC system in low workload conditions.Right:WACC system in the high workload
variable)systems were evaluated in several moderate,noncritical braking situations as well as in an emergency braking sit-uation on the highway.
The theoretical foundation of WACC design is based on three general areas of research:The ?rst area investigates in-creased driver headway as compensatory behavior.A number of studies have surveyed headway increases under high work-load conditions (Horey &Simons,2007;Horrey,Simons,Buschmann,&Zinter,2006).As such,WACC system design increases driver headway in high workload situations to simulate this natural compensatory behavior in humans.The second area of research addresses speed-keeping behavior as a natural compensatory measure.Under high workload,participants reduce speed to compensate for high workload conditions (Brookhuis et al.,1991;Engstr?m,Johansson,&?stlund,2005;Reimer,Mehler,Wang,&Coughlin,2012a ).Based on these results,under high workload conditions WACC reduces vehicle speed,which in turn automatically leads to an increase in headway to the leading car.The third area of research investigates in-creased brake reaction time under high workload conditions.(Jamson &Merat,2005;Lamble et al.,1999;Watson &Strayer,2010).That is,in WACC,under high workload conditions,the driver maintains an increased headway to a leading car.This is equivalent to a higher safety gap,which ensures that the driver has more time to make an appropriate reaction should a critical situation occur (e.g.emergency braking of the leading car).
2.Material
2.1.Participants
A total of 65subjects took part in the experiment.All participants were BMW employees,who took part in the experiment without receiving any compensation.Eighteen subjects were excluded due to technical problems with the vital data mea-surement device and simulator hardware.Therefore,data of 47subjects were analyzed,with an age distribution between 19and 55years,a mean (m)age of 28.5years,and a standard deviation (sd)of 8.7years.Thirty-four subjects (72.3%)were male and 13(27.7%)were female.All participants possessed a valid driving license and 50%of participants had experience in a driving simulator.Twenty-nine (61.7%)participants had no real-life experience with ACC.
2.2.Driving simulator
A ?xed-based custom-built driving simulator with a 50-in.plasma screen,steering wheel with control functions,and an original car seat comprised the experimental setting.A circular highway track surrounded with familiar objects,such as trees and houses,was designed to simulate the feeling of a real driving environment (cf.Fig.1).Furthermore,subjects drove in alternate directions to minimize recollection of the track.Moderate traf?c density in the middle and left lanes was imple-mented.Speed of encountered cars varied,but in general was slightly faster (around 140km/h)than the participants’car.In each driving segment,a secondary task was integrated at a certain time point to induce workload (cf.Table 1).
2.3.Measurements
2.3.1.Vital sign measurement device
A https://www.360docs.net/doc/fe18697518.html,Bamp biosignal amplifying device from g.tec in Vienna was used to monitor electrocardiogram (ECG),GSR,and res-piration signals.The GSR ampli?er provided a skin conductance signal (as opposed to skin resistance or skin potential).The standard GSR electrodes from g.tec were replaced with thin gold electrodes (NeuroDyne Medical;now Zynex NeuroDiagnos-tics)to minimize interference arising from the hand due to grip-related movements on the steering wheel.The sampling rate of the physiological measurement device was 256Hz and data were streamed to a Matlab Simulink Model.After preprocess-ing the raw signals to calculated measurements by an encrypted Simulink Block,data was stored on the notebook for later analysis.G.tec’s integrated ?lter variable ?tted to their Simulink Block established the quality of the processed ECG signal.As a result,the frequency and occurrence of double beats,skipped beats and other ectopic beat variations were recorded,and then eliminated.Then,to temporally synchronize both vital and simulator data,the sampling rate in the model was de-creased to 32Hz,which matched the sampling rate of the simulator.Furthermore,triggers were integrated according to the experimental design for extracting all data belonging to a speci?c segment.The following calculated measurements were used in the analysis:GSR change rate calculated from raw GSR signal derived from the GSR electrodes.Although GSR change rate is not a common measurement in this area of research subjective analysis of GSR measurement plots showed that GSR change rate was useful for indicating differences in workload.GSR change rate is de?ned as changes in GSR signal with re-spect to the baseline segment at the beginning of the measure,
GSR Change Rate ?
Y ààY àBase Y àBase 100Y àis a sliding window of 2s lengths and Y àbase is a ?xed window of 20s immediately record with the start of the measurement.Further measurements used in our analysis included HR and,as HR variability measurement,root mean square of successive differences (RMSSD)derived from ECG sensors,and respiration rate as respirations measurement derived from the respira-tion belt.
110W.Hajek et al./Transportation Research Part F 20(2013)108–120
W.Hajek et al./Transportation Research Part F20(2013)108–120111
Table1
Description of the experimental procedure.
2.3.2.Subjective measurements
In the?rst part of the experiment,subjects drove both systems.The?rst system that drivers encountered was counter-balanced between participants.After experiencing each system,subjects?lled out the AttrakDiff(cf.Hassenzahl,Burmester, &Koller,2003),which interrogated the pragmatic quality of the system.After subjects were briefed on how to operate both systems,they were asked to judge usefulness,helpfulness,comfortableness,subjective stress,and distance to the leading car on a self-constructed10-point semantic differential.
2.3.3.The secondary task:n-back task
The n-back task,which was used as secondary task in this experiment,was originally introduced in a visual presentation, manual response format by Kirchner(1958).Background on the development of the auditory presentation(i.e.,verbal re-sponse form of the task,along with an established protocol)can be downloaded from the white paper section of the MIT Agelab(Mehler,Reimer,&Dusek,2011).In the2-back level of the task,participants listened to single digit numbers(0–9
112W.Hajek et al./Transportation Research Part F20(2013)108–120
randomly presented at a rate of one every2.25s).Participants are required to retain the most recently presented numbers in short-term memory and verbally repeat the number presented two items back in the presented sequence,each time a new number is presented.That is,when the initial two numbers are acoustically presented,participants simply have to remem-ber the numbers in order.With the presentation of a third number,they are asked to state the?rst number in the sequence while keeping the second and third numbers in short-term memory.With the presentation of each new number,participants are required to state the number that was presented two numbers before.Four30-s segments with10numbers each were presented.Hence,one secondary task session consisted of2min of continual workload induction and every2.25s a new number was presented.
The2-back task was chosen because it represented the maximum workload according employed in comparable studies (Mehler,Reimer,&Coughlin,2012b;Mehler,Reimer,Coughlin,&Dusek,2009;Mehler,Reimer,&Wang,2011;Mehler, Reimer,&Dusek,2011;Mehler et al.,2012a;Reimer,2009;Reimer,Mehler,Wang,&Coughlin,2012b;Reimer et al., 2012a).Furthermore,we selected auditory stimuli and a verbal response behavior to induce workload,which would be cog-nitively similar to a driver experiencing a demanding phone call.This task combination has been used in several studies employing physiological data recording,which validate the effect of a task on cognitive loading,expressed in changes of physiological data occurring in simulator(Mehler et al.,2009)and roadway contexts(Mehler,Reimer,&Wang,2011;Mehler et al.,2012a;Mehler et al.,2012b;Reimer,Mehler,Coughlin,Godfrey,&Tan,2009).The original numbers were translated into German and recorded as audio?les to ensure the same conditions for all participants.The audio?les were played over the simulator’s loudspeakers at a volume that could be heard above road sounds to ensure a clear understanding of the numbers.
2.3.4.WACC system
As described earlier,a WACC system was designed such that distance to a leading car increased automatically from a1-to a2-s headway if a participant experienced high workload conditions(cf.Fig.1).The change in distance was accom-plished by implementing a modest speed reduction until the2-s headway was reached.As the speed of the leading vehicle remained the same,the change in headway led to a higher safety distance to the leading car.In contrast to the WACC system,the nonadaptive ACC system maintained the same safety distance for the duration of the task,independent of workload level.
3.Method
3.1.Procedure
Participants were informed that they would be driving with an ACC system capable of maintaining speed and distance relative to a leading car,but unable to detect stationary objects.When encountering a stationary object,participants were instructed to use the brakes.Participants were not given any prior information regarding the actual focus of the experiment, nor that they would be driving with different systems for purposes of eliminating effects of previous knowledge.
First,participants were given an overview of the experimental procedure and answered a questionnaire concerning demographic data and previous driving experience.Participants also learned about the possible occurrence of simulator sick-ness and were told that they could stop the experiment at any time if they experienced such problems.Then,participants were connected to the vital sign measurement device.First they learned how to correctly place the EKG sensors and then proceeded to place them as instructed.Further,they were informed how to place the respiration belt around their stomach and how to place GSR electrodes on the middle and index?nger of their left hand.After participants were seated in the sim-ulator,signals generated by the physiological sensors were checked to ensure that the values fell in the correct range.More-over,drivers’freedom of movement(hands and feet)was ensured.
After establishing participant well-being,training of the2-back task was started.For a better understanding of the sec-ondary task,the0-back task,the1-back task and the2-back task were trained until every participant answered>80%of an-swers in all tasks correctly.This was followed by an introductory session in which participants had an opportunity to become accustomed to the simulator,to experience engaging in the2-back task while driving,and to the usage of ACC(which was also introduced in brie?ngs before driving took place).Further,participants were shown how a critical event would likely appear:as a large truck located diagonally on the same lane with its hazard lights activated.As a result,the truck blocked the driver’s lane and,because the participant was instructed not to change lanes,he had to brake.This introductory session was done with ACC at a low speed(60km/h)to ensure that there would not be any accidents before the experiment started. The experiment itself was driven at a speed of130km/h,which was set by the participants and controlled by the experi-menter.Headway settings were changed automatically at the start and end of the secondary task in the WACC condition and remained?xed throughout the ACC condition.
The experiment was planned as a mixed design study.Part1was a within-subject design,where every participant expe-rienced both systems.The order of the system presented was randomized.Participants were only informed that they had been driving different systems,after experiencing both systems.Therefore,participants indeed experienced WACC and ACC systems without receiving prior information about the difference between each system.Accordingly,we investigated system awareness,the in?uence of system information,and the impact of system on acceptance.Since participants in Part
W.Hajek et al./Transportation Research Part F20(2013)108–120113 2experienced a critical situation under high workload conditions,whereby driver action was needed to prevent an accident, a between-subject design was used to examine system mode.This ensured that there would be no effects of learning.That is, participants would not react the same way after experiencing a critical event a second time.Half of the participants expe-rienced the critical situation with ACC and the other half with WACC.The order of periods and a detailed overview of the experimental procedure are outlined in Table1.
In Part1,participants experienced four noncritical braking events(i.e.,two events for each of ACC and WACC),during which the system prevented an accident from taking place without interference of the driver.A primary goal was to establish whether participants developed an awareness of differences between WACC and ACC systems.Sequencing of the systems was counterbalanced over participants.A noncritical situation was generated as follows:a controlled braking maneuver of the leading car decelerated at a rate ofà3m/s2from130km/h to50km/h,and then accelerated again to130km/h at
a rate of1.5m/s2.Participants experienced this braking maneuver in the introductory session and,therefore,were familiar
2.Absolute physiological data of the ACC condition for all participants;Top,left to right:Respiration rate,RMSSD(averaged over60s).Bottom,left right:HR(averaged over60s),GSR change rate.
4.Results
4.1.Technical detection of high workload situations
Respiration rate,RMSSD,HR and GSR data collapsed across all participants and presented in absolute units are shown in Fig.2.Note in particular the marked increase in HR and GSR during the 2-back task (workload)period relative to the pre-ceding Reference period,suggesting that the cognitive task did impact the state of the participants.For statistical analyses,the different physiological measures were converted to standardized values using the formula:
X i àX àreference
X àreference 100
where X i represents each data point and X àreference represents the mean of the reference period before the workload period.For
each participant,a mean reference value was then calculated for the ACC reference period prior to the workload period (for the reference period,see Fig.2;left from gray area)from Part 1and compared against the mean workload value of the ACC workload period (Fig.2,gray area)of Part 1.A repeated measurements ANOVA showed that overall physiological data are signi?cantly affected by workload F (1,46)=73.61,p <.001.Bonferroni adjusted post hoc t -tests show signi?cant results in HR,respiration,and GSR (HR:t (46)=à9.042,p <.001,r =.80,GSR:t (46)=à4.99,p <.001,r =0.59,respiration:t (46)=à3.67,p <.01,r =.34t (46)=1.48,ns,r =.21.)and no signi?cant results in RMSSD (t (46)=1.48,ns,r =.84).
In order to detect high workload periods for each participant,our results indicate HR and GSR as predictors.RMSSD does not show signi?cant results and therefore is not considered for algorithm development.Furthermore,respiration showed signi?cant differences,but the verbal response component of the secondary task had a confounding effect on respiration.Therefore,we excluded it from further analysis as the possibility of generalization for the developed algorithm would be very limited.
4.1.1.Introduction
Previous studies showed signi?cant differences in physiological data between workload and reference periods induced by the n -back task (Mehler,Reimer,D’Ambrosio,Pina &Coughlin,2010;Reimer et al.,2009).These ?ndings were validated in this study as described in Section 4.1.As a further step in evaluating the potential of physiological data as stable individual data for subsequent application,we aimed to develop a detection algorithm.Here,we demonstrate the possibility of devel-oping an algorithm for detecting high workload periods in real time using individual intra-personal data,laying the founda-tion for the development of a workload-based system beyond purely experimental settings.
We use data from Part 1to develop our algorithm in order to recognize patterns characterizing workload,or absence of workload,and not critical situations.To this end,we applied a standard approach (Bishop,2006;MacKay,2003)from the machine learning community to ?nd speci?c patterns in the physiological measurements,exhibiting workload or nonwork-load conditions.First,collected data were preprocessed.Then data were labelled as workload or reference as stated in the experimental design (cf.Table 1).Workload data comprised two 2-min intervals,where subjects drove and responded to the 2-back task (cf.Table 1‘‘Driving +2-back task’’period).Nonworkload data included two 2-min intervals occurring imme-diately before the workload situation (cf.Table 1‘‘Reference/Separation’’periods).This label refers to 2min of nonworkload followed by a 30-s separation interval.This separation period was integrated to ensure a clear cut off period between these two contradicting periods without one period affecting physiology data of the other.Thus,only the ?rst 2min of data,from the 2.5-min interval labelled as reference,were used for algorithm development.Second,features that re?ected changes in workload level were calculated.In the machine learning community,‘‘features’’stand for derived features of measured sig-nals.Third,the labelled data were divided into test and training data.The algorithm was trained based on the training data and afterwards its performance was evaluated on the test data.
As discussed in Section 2.3.1an integrated ?lter variable classi?ed and processed the data.This ?lter variable was not working well and was not able to classify all of RR peaks correct.As a result for non-detected RR peaks,the last peak was used for calculation of ECG measures.This problem had been detected in the post-processing of the data.Even as it is now solved for future experiments,it was decided to only use the data of these participants for development of the detection algorithm,where the ?lter was assessing it as correct over the whole period and no peaks were replaced with old values as this would confound the classi?cation results.Therefore the data set was reduced to those 18participants without any data artefacts ensuring high accuracy in the raw data for further algorithm development.
4.1.2.Data preprocessing
The data are stored as time series.A time series X =x 1,x n is an ordered set of n real-valued variables.We normalized all measured signals to the baseline,That is,physiological data samples from each test participant were normalized to the mean reference value X Ref of the according subjects (cf.Wang,1998).The normalized time X norm series is calculated as follows:
X norm ?X
X Ref à?100
114W.Hajek et al./Transportation Research Part F 20(2013)108–120
Fig.3.Sliding window concept.
X is either time series or a calculated value from the analyzed signal.This was done to compensate for intra-personal differ-ences in data.
Data were split into overlapping windows as shown in the Fig.3.Each window contains30s of measurement data.The offset between two consecutive windows is10s.This concept is also known as sliding window.The advantage of this meth-od comparing to the use of non-overlapping windows is that we get a new result every10s instead of every30s.Considering multiple consecutive intervals allows for increased con?dence rate as shown below in this section.Since our intervals are
short,considering several intervals it is a still acceptable timeframe for real-time application.
4.1.3.Feature extraction
following features from the ECG and from the GSR signals.
Electrocardiogram(ECG).Temporal domain features of the ECG?gure prominently in the literature
Picard R.W.,2000;Mandryk&Atkins,2007;Mehler,Reimer,D’Ambrosio,Pina&Coughlin,
Sagawa,&Inooka,1998).As can be seen in Fig.4(top),the ECG is a periodic signal.Thus,
both temporal and frequency domains.On the ECG signal,we?rst applied standard
the QRS complex of the raw ECG are used for identifying the time interval between adjacent
as RR intervals or the inter-beat interval,IBI.Thus,we applied heart rate variability
some calculations on the raw ECG signal,known from the signal processing community
These two calculations on the raw ECG signal are:power spectrum and cepstrum.The
workload(blue,dashed)and a reference(gray,solid)phase is clearly depicted(Fig.
Fig.4.On the top:ECG signal.On the bottom from left to right:Power spectrum,Cepstrum.
the workload phase,the power spectrum of the ECG is shifted to the right,such that it achieves its maximum at a higher frequency.The difference between workload and reference phases can also be seen in the ECG cepstrum(see Fig.4,bottom right).The analyzed frequency based features are:(1)Power spectrum(frequency where the maximum power resides);(2) Cepstrum(maximum)and(3)HR variability,RMSSD(calculated as shown in1,where RR is the interval between successive Rs and R is a peak of the QRS complex of the ECG signal).
RMSSD?
??????????????????????????????????????????????
P NNà1
n?1
eRR nàRR nà1T2
q
NNà1
e1T
The considered time domain features are:(1)Mean beat-to-beat HR;(2)First difference in beat-to-beat HR,d x,(calculated as shown in2,where w is the length of the analyzed time series and x w is a w th measurement);(3)Second difference of the beat-to-beat HR,c x,(calculated as shown in3,where w is the length of the analyzed time series and x w is a w th measure-ment);(4)Maximum beat-to-beat HR and(5)Minimum beat-to-beat HR and(6)difference between maximum and mini-mum beat-to-beat HR.Heart rate values such as the mean,min and max can were calculated from the RR series.
d x?1
?
X wà1
n?1
j x nt1àx n je2T
c x ?
1
?
X wà2
n?1
j x nt2àx n je3T
4.1.3.2.Galvanic skin response(GSR).GSR is a non-periodic signal in which the raw GSR signal has multiple?uctuations(see Fig.5).To mitigate this effect,an averaging operation can be used.The impact of different averaging intervals can be seen in Fig.5(left side).Since latency is1–3s(Picard,Vyzas,&Healey,2001),the average should be taken over at least3s,since shorter time?uctuation might result in noise.If the averaging interval is too large,the local maximum is shifted on the time axis to the right,which means a delay in the data evaluation.For all subsequent discussions,the GSR signal is averaged over the last3s.Fig.4(right)depicts the difference between a workload(blue,dashed)and a reference(gray,solid)phase in the Fig.
5.Left:Different average windows for the GSR signal;right:GSR(averaged over3s)for workload and reference.
116W.Hajek et al./Transportation Research Part F20(2013)108–120
4.1.4.Feature selection and classi?cation
First,we evaluated the classi?cation accuracy of single features (cf.Fig.6).These values are calculated as percentages:the number of right-classi?ed examples with a single feature divided by the total number of examples,multiplied by 100.Since it is known that classi?cation can be done more accurately using multiple features,multiple-feature classi?cation was eval-uated.To this end,feature selection was done ?rst,with the aim of achieving an optimal feature set where every single fea-ture contributes to greater accuracy and where features are consistent.A forward feature selection algorithm (Sequential Forward Selection –SFS)was done to ?nd the best reduced feature set of nine features (Healey &Picard,2000).The selected features were:(1)ECG:Cepstrum max;(2)ECG:frequency with max amplitude;(3)RMSSD;(4)Beat-to-beat (BB)HR:Mean;
(5)Beat-to-beat HR:First difference;(6)Beat-to-beat HR:Max;(7)Beat-to-beat HR:Min;(8)GSR:Mean;(9)GSR:First difference.
Furthermore,two machine learning algorithms were applied with the selected features:Decision Tree and Naive Bayes classi?ers.MATLAB implementations of both machine learning methods were used:Naive Bayes and Decision Tree.Naive Bayes assumes that features are independent.But this was not the case in our classi?cation problem,since we extracted mul-tiple features from two initial signals.The validation was done using 100-fold cross-validation where the test set contained 30%of the available data (cf.Crowther &Cox,2005;Forman &Scholz,2010).The accuracy of the Naive Bayes algorithm eval-uated to 78.6%.The ?nal classi?cation with Decision Tree also using multiple features (83.7%accuracy)outperformed each single feature classi?er (cf.Fig.6)with maximum accuracy of 81%and the Naive Bayes approach.
To increase con?dence,multiple consecutive windows can be considered.For example,if we take three consecutive se-quences with the calculated accuracy Acc on each sequence,the accuracy of the majority voting Acc Maj is calculated as:
Acc Maj ?1à11àAcc 100
3Decision Tree classi?cation was then evaluated at 97.3%.This high accuracy was achieved after 50s (i.e.,three consecu-tive sequences of 30s with a 10-s offsets,see Fig.3).
4.2.Security of WACC
To interrogate safety-related aspects of WACC,subjects experienced a critical situation to observe how they adapted to the WACC system.Risk homeostasis theory (Wilde,1982),as applied to driving assistance systems,suggests that people will
(1)adapt to a lower critical situation with increased brake reaction time,or (2)adjust their general braking behavior until the situation is as critical as without the adaptation to generate a lower risk level in the critical situation.Therefore,we decided to investigate whether participants using the WACC system in a critical situation would adapt their behavior according to risk homeostasis theory.In reality,critical situations occur rarely and therefore such a critical situation was simulated in our experiment with low frequency.
Before the emergency braking situation was introduced,participants experienced (W)ACC brakings ?ve times without participant engagement,and were instructed accordingly.That is,participants were instructed to brake only in the event of a situation occurring outside of the limitations of the (W)ACC system (e.g.standing object).Brake reaction time was mea-sured from the time of lane change until the brake pedal angle was >1°.Furthermore,negative velocity occurring after the lane change of the leading car was calculated to estimate the smoothness of the braking maneuver.T -tests were calculated using a between-group design,comparing one group driving with a 1-s headway (ACC)to a second group driving with a 2-s headway (WACC).No signi?cant results were found for brake reaction time:t (42)=1.039,ns,r =.16,(ACC m =2.09s,sd =0.43s;WACC m =2.21s,sd =0.31s),arguing against adaptive human behavior in brake reaction time,during critical situations.Over the entire sample,participants reacted at the same time independent of headway spacing and,therefore,distance to the standing object.Furthermore,deceleration during braking with the WACC system was highly
signi?cant:W.Hajek et al./Transportation Research Part F 20(2013)108–120117
118W.Hajek et al./Transportation Research Part F20(2013)108–120
t(42)=12.85,p<.001,r=.89and smoother(m=à210.42mm/s2,sd=11.08mm/s2)than with the ACC system (m=à260.35mm/s2,sd=14.12mm/s2),which effectively minimized the risk of rear-end crashes and suggests that partic-ipants had more situational control using the WACC system.Both of these results support the hypothesis that participants do not adapt to lower risk levels(i.e.,evidenced by a greater distance to a critical situation)as might be expected from homo-eostasis theory.Therefore,WACC might provide a safety advantage in critical driving situations.
4.3.Acceptance of WACC
No signi?cant differences in AttrakDiff questionnaires were for the two systems after participants had experienced both systems.That is,participants did not receive any additional information apart from the ACC instruction guidelines(e.g.,ACC does not brake for standing objects).This was implemented to ensure that participants remained unaware that one of the systems was functionally adapted to assist in high workload conditions.After subjects received an explanation concerning the mode of operation of both systems(ACC and WACC),they were asked to rate usefulness,helpfulness,comfortableness, subjective stress and distance to the leadingcar(cf.Fig.7).
From left to right,Reasonable[U=9.000,z=–5.667,p=0.000,r=–.827],Helpful[U=0.000,z=–5.105,p=0.000, r=à.745],Comfortable[U=64.000,z=–4.078p=0.000r=–.595],Stress Level[U=277,z=2.619,p=0.009,r=.382]and Distance Sensation[U=22.500,z=–3.927,p=0.000,r=–.573].Furthermore,subjects were asked how much money they would spend on each system.Although this kind of measure is not in line with real spending behavior,a clear preference could be established for one system.The difference between the WACC(m=777.84)and ACC(m=533.41)systems was highly signi?cant:t(43)=4.337,p=0.000,r=.552,which suggests that WACC is preferable to ACC.The?nding that no sig-ni?cant differences in pragmatic system quality were found before the explanation and that preference for one of the sys-tems was observed after the explanation,is best explained by system awareness,which was the only changed variable. Subjects were asked if they noticed any changes in either system before they received further information on both systems. Only7subjects(14.9%)from a total of47participants realized any change in distance.Furthermore,6subjects thought that the system would brake earlier or that the drive was generally more comfortable.One subject recognized a change in the ACC status display,one subject thought the ACC icon was blinking,and one subject thought the WACC behaved more aggressively than the ACC system.
5.Conclusion
Mental workload,also called mental effort,is the sum of the costs of cognitive processing and has been found,under various conditions,to be re?ected by several physiological measurements,such as HR,HR variability,respiration,and GSR(De Waard(1996),Veltman&Gaillard,1998;Mayser et al.,2003,Brookhuis&De Waard,2010;Mehler et al., 2012a;Mehler et al.,2012b).Workload can be examined through questionnaires,performing secondary tasks and mea-suring physiological parameters,which are the least invasive.The Rheinisch-Westfaelische Technische Hochschule (RWTH University)Aachen evaluated the effects of integrated capacitive ECG electrodes located in seats(Wartzek et al.,2011).Although the detection rate of this measure was not?awless,it shows that measuring HR and HR variabil-ity–without wearing sensors on the skin–could become a reality in the near future.BMW also is working on mea-suring GSR at the steering wheel(D’Angelo,Parlow,Spiessl,Hoch&Lueth,2011).Alternatively,clothes in which sensors are incorporated are already available on the market.This development shows that non-or low-interference measure-ment of vital data could become possible in the future.Thus,our research focuses on the development of a workload algorithm founded on validated vital measurement equipment.Further,we aimed to establish the effects of workload, as an optional parameter,in the calculation of ACC headway.To this end,three underlying research questions were addressed.
W.Hajek et al./Transportation Research Part F20(2013)108–120119
(a)The?rst question examined the technical possibility of workload detection based on physiological data.Our results
showed highly signi?cant differences in physiological data between low workload,single-task driving segments and objectively higher workload,dual-task segments when participants engaged in a2-back working memory task.
A programmed decision tree algorithm correctly identi?ed these high workload periods in83.7%of all instances for
the18subjects for whom usable physiological data was available.This supports the conclusion that workload detec-tion based on physiological data should be possible if the right physiological sensors deliver data at a suf?cient quality.
However,it should be noted that the high percentage of workload detection found using the algorithm was based on a known reference period in the car.In other words,real-time detection on the street requires that a reference session be identi?ed and that reference data be collected.A further critical point in?uencing the possibility of using physio-logical data is the implementation of in-vehicle sensors or sensors worn on the body.Both methods could be used for collecting physiological data in the future,but currently,these methods are very artifact-sensitive to movements of subjects and surrounding electronic devices.Furthermore,implementing these sensors in vehicles must be made more affordable.Future development in this sector will determine if this kind of continuous detection is technically and ?nancially possible,i.e.,feasible for serial production.
(b)The second research question asked if such an ADAS increases safety.Our results suggest that participants capitalized
on the possibility of maintaining a higher distance to a leading car.They decelerated slowly,reducing the risk of rear-end collisions.Furthermore our study showed no delay in brake reaction time under higher headway conditions.Thus, participants also decreased their risk of front-end collisions.The experiment was designed to simulate real-life con-ditions with an ACC system.Accordingly,?ve noncritical braking maneuvers were designed to enhance trust in the system and a critical braking event occurred once,and therefore was a rare event.Nevertheless,the experimental results demonstrate participants’?rst encounter with such a WACC system and does not reveal participants’adapta-tion to such a system over longer periods of time.It is possible that they are starting to trust the system more because it compensated for their behavior the last times and then start to act according to the risk homeostasis theory.
(c)The third question concerned the acceptance of such a new ADAS.As most participants did not report a change in the
system related to distance to the leading car,no signi?cant differences were found between the two systems before receiving a system explanation.After receiving an unbiased explanation,people preferred the WACC system over the ACC system in each of the questioned items.The most interesting result was that people were not aware of the adap-tation and did not notice that the system increased safety.This is precisely how an ADAS should support drivers.
Subjective data showed very promising results concerning safety and acceptance of the WACC system.Nevertheless,fur-ther research should examine whether participants’vital data measurements in the simulator reveal the same pattern of re-sults in reality.If we detect a high workload situation in the simulator,but fail to adapt and apply these results in real-life settings,then this simulator-speci?c artifact would have no research value.The MIT AgeLab has shown that physiological data changes follow a similar pattern in simulated and real-life vehicular settings(cf.Reimer&Mehler,2011).These results suggest that the developed workload algorithm could also be applied(with minor changes)in on-the-road settings,but this assumption remains to be validated under real traf?c conditions.
Acknowledgments
We thank Ralf Decke and Bernhard Niedermaier at BMW Group Research and Technology GmbH for organizational and thematic input,as well as for help solving both minor and major problems.Furthermore,we are grateful to Bryan Reimer and Bruce Mehler from the MIT AgeLab for sharing valuable insights and for eye-opening discussions.We also thank two anon-ymous reviewers for their valuable comments on previous versions of the manuscript.
This research received funding from the European Community’s Seventh Framework Programme(FP7/2007–2013)under Grant Agreement No.238833/ADAPTATION project.www.adaptation-itn.eu.
References
Bishop,C.M.(2006).Pattern recognition and machine learning.Series:Information science and statistics(1st ed.).(Corr.2nd printing,2006). Brookhuis,K.A.,de Vries,G.,&de Waard,D.(1991).The effects of mobile telephoning on driving performance.Accident Analysis and Prevention,23,309–316. Brookhuis,K.A.,&De Waard,D.(2010).Monitoring drivers mental workload in driving simulators using physiological measures.Accident Analysis and Prevention,42(3),898–903.
Clarion,A.,Ramon,C.,Petit,C.,Dittmar,A.,Bourgeay,J.P.,Guillot,A.,et al(2009).An integrated device to evaluate a driver’s functional state.Behavior Research Methods,41(3),882–888.
Coughlin,J.F.,Reimer,B.,&Mehler,B.(2009).Driver wellness,safety&the development of an AwareCar.AgeLab white paper.
Coughlin,J.F.,Reimer,B.,&Mehler,B.(2011).Monitoring,managing and motivating driver safety and well-being.IEEE Pervasive Computing,10(3),14–21. Crowther,P.S.,&Cox,R.J.(2005).A method for optimal division of data sets for use in neural networks.Knowledge-Based Intelligent Information and Engineering Systems Lecture Notes in Computer Science,3684(2005),906.
D’Angelo,L.,Parlow,J.,Spiessl,W.,Hoch,S.,&Lueth,T.(2011).Unobtrusive in-car vital parameter acquisition and processing.In Birgid Eberhardt&Reiner Wichert(Eds.),Ambient assisted living(pp.257–270).Springer-Verlag.
De Waard,D.(1996).The measurement of drivers’mental workload.PhD thesis,University of Groningen.Haren,The Netherlands:University of Groningen, Traf?c Research Centre.
Duffy,E.(1957).The psychological signi?cance of the concept of‘‘arousal’’or‘‘activation’’.Psychological Review,64(5),265–275.
Endsley,M.R.,&Kiris,E.O.(1995).The out-of-the-loop performance problem and level of control in automation.Human Factors,37(2),381–394.
120W.Hajek et al./Transportation Research Part F20(2013)108–120
Engstr?m,J.,Johansson,E.,&?stlund,J.(2005).Effects of visual and cognitive load in real and simulated motorway driving.Transportation Research Part F: Traf?c Psychology and Behavior,8,97–120.
Forman,G.,&Scholz,M.(2010).Apples to apples in cross-validation studies:Pitfalls in classi?er performance measurement.ACM SIGKDD Explorations, 12(1),49–57.
Freeman,G.L.(1940).The relationship between performance level and bodily activity level.Journal of Experimental Psychology,26(6),602–608. Hassenzahl,M.,Burmester,M.,&Koller,F.(2003).AttrakDiff:Ein Fragebogen zur Messung wahrgenommener hedonischer und pragmatischer Qualit?t.In J.
Ziegler&G.Szwillus(Hrsg.),Mensch&Computer2003.Interaktion in Bewegung(S.187–196).Stuttgart,Leipzig:B.G.Teubner.
Healey,J.,&Picard R.W.(2000).SmartCar:Detecting driver stress.Proceedings of ICPR’00,Barcelona,Spain,May2000.TR525.
Horrey,W.J.,Simons,D.J.,Buschmann,E.G.,&Zinter,K.M.(2006).Assessing interference from mental workload using a naturalistic simulated driving task:
A pilot study.In Proceedings of the human factors and ergonomics society,50th annual meeting(pp.2003–2007).Santa Monica,CA:Human Factors and
Ergonomics Society.
Jamson,A.H.,&Merat,N.(2005).Surrogate in-vehicle information systems and driver behaviour:Effects of visual and cognitive load in simulated rural driving.Transportation Research Part F:Traf?c Psychology and Behavior,8,79–96.
Kaber,D.B.,&Endsley,M.R.(1997).Out-of-the-loop performance problems and the use of intermediate levels of automation for improved control system functioning and safety.Process Safety Progress,16,126–131.
Kahneman,D.(1973).Attention and effort.New Jersey,USA:Prentice Hall.
Kirchner,W.K.(1958).Age differences in short-term retention of rapidly changing information.Journal of Experimental Psychology,55(4),352–358. Lamble,D.,Kauranen,T.,Laakso,M.,&Summala,H.(1999).Cognitive load and detection thresholds in car following situations:Safety implications for using mobile(cellular)telephones while driving.Accident Analysis and Prevention,31,617–623.
Liu,B.,&Lee,Y.(2006).In-vehicle workload assessment:Effects of traf?c situations and cellular telephone use.Journal of Safety Research,37,99–105. MacKay,D.J.C.(2003).Information theory,inference,and learning algorithms.Cambridge University Press.
Mandryk,R.,&Atkins,M.(2007).A fuzzy physiological approach for continuously modeling emotion during interaction with play technologies.International Journal of Human–Computer Studies,65(4),329–347.
Mayser,C.,Piechulla,W.,Weiss,K.-E.,&K?nig,W.(2003).Driver workload monitoring.In H.Strasser,K.Kluth,H.Rausch&H.Bubb(Hrsg.),Quality of work and products in enterprises of the future.Proceedings of the50th-anniversary conference of the GfA and the XVII annual ISOES conference in Munich,May07–09th(pp.41–44).Stuttgart:Ergonomia.
Mehler,B.,Reimer,B.,D’Ambrosio,L.A.,Pina,A.,&Coughlin,J.F.(2010).An evaluation of time of day in?uences on simulated driving performance and physiological arousal.In Proceedings of the transportation research board89th annual meeting.Washington,DC.
Mehler,B.,Reimer,B.,&Wang,Y.(2011).A comparison of heart rate and heart rate variability indices in distinguishing single task driving and driving under secondary cognitive workload,Proceedings of the Sixth International Driving Symposium on Human Factors in Driver Assessment,Training,and Vehicle Design,Lake Tahoe,California,590-597.
Mehler,B.,Reimer,B.,&Dusek,J.A.(2011).MIT AgeLab delayed digit recall task(nback).MIT AgeLab white paper number2011-3A.
Mehler,B.,Reimer,B.,&Coughlin,J.F.(2012a).Physiological reactivity to graded levels of cognitive workload across three age groups:An on-road evaluation.In Proceedings of the54th annual meeting of the human factors and ergonomics society(pp.2062–2066).San Francisco,September27–October 1,2010.
Mehler,B.,Reimer,B.,&Coughlin,J.F.(2012b).Sensitivity of physiological measures for detecting systematic variations in cognitive demand from a working memory task:An on-road study across three age groups.Human Factors,54(3),396–412.
Mehler,B.,Reimer,B.,Coughlin,J.F.,&Dusek,J.A.(2009).The impact of incremental increases in cognitive workload on physiological arousal and performance in young adult drivers.Transportation Research Record:Journal of the Transportation Research Board,2138,6–12.
Picard,R.W.,Vyzas,E.,&Healey,J.(2001).Toward machine emotional intelligence:Analysis of affective physiological state.IEEE Transactions Pattern Analysis and Machine Intelligence,23,1175–1191.
Reimer,B.(2009).Cognitive task complexity and the impact on drivers’visual tunneling.Transportation Research Record:Journal of the Transportation Research Board,2138,13–19.
Reimer,B.,Mehler,B.,Coughlin,J.F.,Godfrey,K.M.,&Tan,C.(2009).An on-road assessment of the impact of cognitive workload on physiological arousal in young adult drivers.In Proceedings of the?rst international conference on automotive user interfaces and interactive vehicular applications(AutomotiveUI 2009)(pp.115–118).Essen,Germany.
Reimer,B.,Mehler,B.,Wang,Y.,&Coughlin,J.F.(2012).The impact of systematic variation of cognitive demand on drivers’visual attention across multiple age groups.In Proceedings of the54th annual meeting of the human factors and ergonomics society(pp.2052–2056).San Francisco,September27–October 1,2010.
Reimer,B.,&Mehler,B.(2011).The impact of cognitive workload on physiological arousal in young adult drivers:A?eld study and simulation validation.
Ergonomics,54(10),932–942.
Reimer,B.,Mehler,B.,Coughlin,J.,&Dusek,J.A.(2011).The impact of a naturalistic hands-free cellular phone task on heart rate and simulated driving performance in two age groups.Transportation Research Part F:Traf?c Psychology and Behavior,14(1),13–25.
Reimer,B.,Mehler,B.,Wang,Y.,&Coughlin,J.F.(2012b).A?eld study on the impact of variations in short term memory demands on drivers’visual attention and driving performance across three age groups.Human Factors,54(3),454–468.
Rouse,W.B.,Edwards,S.L.,&Hammer,J.M.(1993).Modeling the dynamics of mental workload and human performance in complex systems.IEEE Transactions on Systems,Man,and Cybernetics,23(6),1662–1671.
Veltman,J.A.,&Gaillard,A.W.K.(1998).Physiological workload reactions to increasing levels of task dif?culty.Ergonomics,41(5),656–669.
Wang,F.,Sagawa,K.,&Inooka,H.(1998).Time domain heart rate variability index for assessment of dynamic https://www.360docs.net/doc/fe18697518.html,puters in Cardiology,25(4),97–100 (Vol.25Cat No.98CH36292).
Wartzek,T.,Eilebrecht,B.,Lem,J.,Lindner,H.-J.,Leonhardt,S.,&Walter,M.(2011).ECG on the road:Robust and unobtrusive estimation of heart rate.IEEE Transactions on Biomedical Engineering,58(11),3112–3120.
Watson,J.M.,&Strayer,D.L.(2010).Supertaskers:Pro?les in extraordinary multi-tasking ability.Technical report,Department of Psychology,University of Utha.
Wilde,G.J.S.(1982).The theory of risk homeostasis:Implications for safety and health.Risk Analysis,2,209–225.https://www.360docs.net/doc/fe18697518.html,/10.1111/j.1539-6924.1982.tb01384.x.
Yerkes,RM.,&Dodson,JD.(1908).The relation of strength of stimulus to rapidity of habit-formation.Journal of Comparative Neurology and Psychology,18, 459–482.