财务报表分析与运用杰拉尔德课后答案英文版第三章
财务会计课后习题答案(英文原版)第3单元
2A
Simple
3A 4A 5A
Moderate Moderate Moderate
*6A*
Moderate
1B
Simple
2B
Simple
3B 4B 5B
Moderate Moderate Moderate
3-2
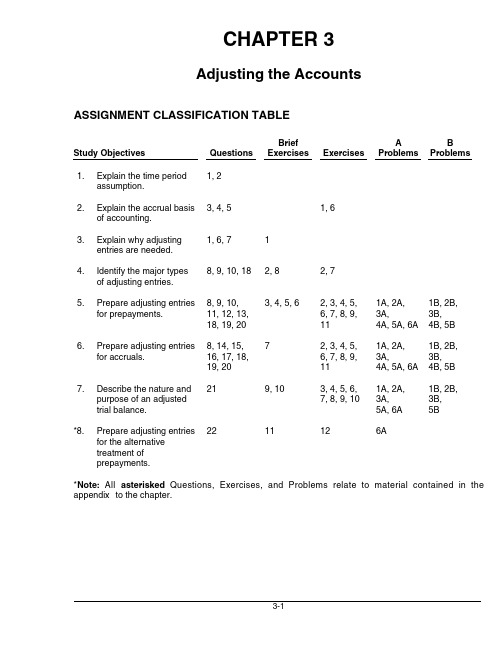
Correlation Chart between Bloom’s Taxonomy, Study Objectives and End-of-Chapter Exercises and Problems
1A, 2A, 3A, 4A, 5A, 6A 1A, 2A, 3A, 4A, 5A, 6A 1A, 2A, 3A, 5A, 6A 6A
1B, 2B, 3B, 4B, 5B 1B, 2B, 3B, 4B, 5B 1B, 2B, 3B, 5B
*6.
Prepare adjusting entries for accruals.
7
*7.
Describe the nature and purpose of an adjusted trial balance. Prepare adjusting entries for the alternative treatment of prepayments.
9, 10
*8.
22
11
12
Study Objective Q3-1 Q3-3 Q3-4 Q3-1 Q3-6 Q3-8 Q3-9 Q3-8 Q3-9 Q3-10 Q3-11 Q3-12 Q3-13 Q3-19 Q3-20 Q3-17 Q3-18 BE3-3 BE3-4 BE3-5 BE3-6 E3-2 E3-3 E3-4 E3-5 E3-6 E3-7 E3-8 E3-9 E3-11 P3-1A P3-2A P3-3A Q3-10 Q3-18 BE3-2 BE3-8 E3-7 E3-2 P3-4A E3-11 P3-5A P3-6A P3-1B P3-2B P3-3B P3-4B P3-5B Q3-7 BE3-1 Q3-5 E3-6 Q3-2 E3-1 Knowledge Comprehension Application Analysis Synthesis Evaluation
智慧树答案财务报表分析(全英文)知到课后答案章节测试2022年
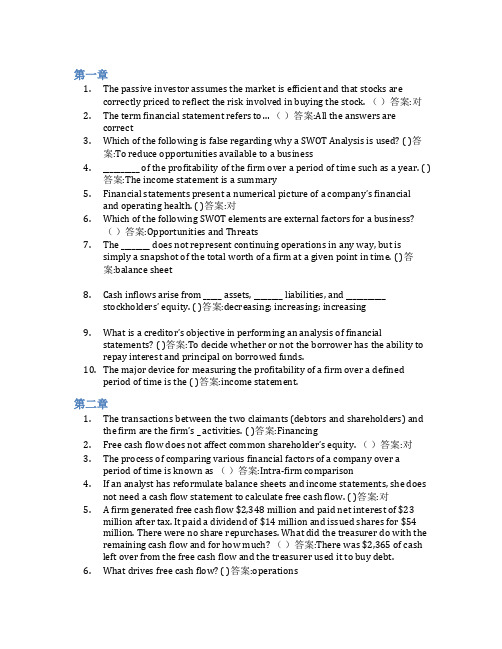
第一章1.The passive investor assumes the market is efficient and that stocks arecorrectly priced to reflect the risk involved in buying the stock. ()答案:对2.The term financial statement refers to… ()答案:All the answers arecorrect3.Which of the following is false regarding why a SWOT Analysis is used? ( )答案:To reduce opportunities available to a business4.__________ of the profitability of the firm over a period of time such as a year. ( )答案:The income statement is a summary5.Financial statements present a numerical picture of a company’s financialand operating health. ( )答案:对6.Which of the following SWOT elements are external factors for a business?()答案:Opportunities and Threats7.The ________ does not represent continuing operations in any way, but issimply a snapshot of the total worth of a firm at a given point in time. ( )答案:balance sheet8.Cash inflows arise from _____ assets, ________ liabilities, and ___________stockholders’ equity. ( )答案:decreasing; increasing; increasing9.What is a creditor’s objective in performing an analysis of financialstatements? ( )答案:To decide whether or not the borrower has the ability to repay interest and principal on borrowed funds.10.The major device for measuring the profitability of a firm over a definedperiod of time is the ( )答案:income statement.第二章1.The transactions between the two claimants (debtors and shareholders) andthe firm are the firm’s _ activities. ( )答案:Financing2.Free cash flow does not affect common shareholder’s equity. ()答案:对3.The process of comparing various financial factors of a company over aperiod of time is known as ()答案:Intra‐firm comparison4.If an analyst has reformulate balance sheets and income statements, she doesnot need a cash flow statement to calculate free cash flow. ( )答案:对5. A firm generated free cash flow $2,348 million and paid net interest of $23million after tax. It paid a dividend of $14 million and issued shares for $54million. There were no share repurchases. What did the treasurer do with the remaining cash flow and for how much? ()答案:There was $2,365 of cashleft over from the free cash flow and the treasurer used it to buy debt.6.What drives free cash flow? ( )答案:operations7.Reformulated balance sheets inform analysts about the firm’s strategy forrunning the business. ( )答案:对8.Which of the following activities is NOT an investing activity? ()答案:borrowing money9.An operating asset is ( )答案:used to produce goods or services to sell tocustomers in operations.parison of financial statements highlights the trend of the _________ of thebusiness. ( )答案:All the answers are correct第三章1.Low profit margins always imply low return on net operating assets. ()答案:错2.Which the following measure drive return on common equity (ROCE)positively? ()答案:Gross margin3.Under what condition would a firm’s return on common equity (ROCE) beequal to its return on net operating assets (RNOA)? ()答案:The SPREAD is zero, that is, return on net operating assets (RNO4. A reduction in the advertising expense ratio increase return on commonequity? ( )答案:对5. A firm should always purchase inventory and supplies on credit rather thanpaying cash. ()答案:错6. A firm has a return of 11.2 percent on net operating assets of $400 million, ashort term borrowing rate of 4.0 percent after tax and a return on operating assets of 8.5 percent. What is the firm’s operating liability leverage? ()答案:0.600 borrowing cost drive return on common equity (ROCE) negatively. ( )答案:对8.Which of the following would explain an observed decrease in return onequity, all else equal? ()答案:Increase in interest rate on debt9.The following information is from reformulated financial statements (inmillion) what is the firm’s ROCE and RNOA? ( )答案:15.0% and 13.0%10.Under what condition would a firm’s return on net operating assets (RNOA)be equal to its return on operating assets (ROOA)? ( )答案:The operatingliability leverage spread (OLSPREAD) is zero, that is, ROOA equals theimplicit borrowing rate for operating liabilities.第四章1.What measures tells you that a firm is a no-growth firm? ( )答案:A firm haszero or negative residual earnings growth2.Which the following item is part of unusual (transitory) income? ( )答案:Gainon the disposal of property3.Firms can grow earnings, but not create (share) value ()答案:对4.The following number were calculated from the financial statements for afirm for 2012 and 2011:How much of the change in ROCE from 2011 to 2012 is due to financing activities? ()答案:3.37%5.Transitory earnings are current earnings that are likely to be maintained inthe future. ( )答案:错6.Which of the following could cause return on net operating assets to increase,all other things equal? ()答案:Increase in inventory turnover7.Below is selected information from TricorpReturn on net operating assets forYear 1 is: ( )答案:15.4%.8.RE represents extra profit available to the company/shareholders this iswhat drives growth in a company’s (share) value. ()答案:对9.Return on operating assets is a measure of which of the following? ()答案:Efficiency10.Below is selected information from Tricorp company Which of the followingis correct concerning changes at Tricrop from Year 1 to Year 2? ( )答案:RNOA Decreased, ROCE Decreased第五章1. A firm can create future income by temporarily increasing its bad debtallowance. ()答案:对2.Which of the following item are managed to increase gross revenue? ()答案:Increase receivables3.Increasing profit margins by underestimating expenses creates net operatingassets. ( )答案:对4.Why do analysts compare cash flow from operations with earnings to assessthe quality of the earnings? ()答案:The difference between earnings andcash flow from operations is explained by the accruals, and the accruals aret he “soft” part of earnings that can be manipulated.5. A decrease in warranty liabilities increases net sales. ( )答案:错6.IBM reported a 3 percent increase in income for its first quarter of 2000,beating analysts’ estimates. But it also reported a decline in revenue. Its stock price dropped in response to the report. Which of the following statement isincorrect for the drop in stock price on an earnings increase? ()答案:Theasset turnover is expected to increase.7.Low depreciation charges forecast losses in future income statements. ( )答案:对8.Which of the following is least likely to be associated with low-qualityearnings? ()答案:Decrease in borrowings.9.Accounting quality analysis is not part of the wider analysis of sustainableearnings. ()答案:错10.Which of the following is not an indicator of accounting Manipulation? ()答案:Loss on sale of discontinued business segments第六章1.If the intrinsic value of a stock is greater than its market value, which of thefollowing is a reasonable conclusion? ( )答案:The market is undervaluing thestock.2.The _______ is defined as the present value of all cash proceeds to the investorin the stock. ( )答案:intrinsic value3.FCF and DDM valuations should be ____________ if the assumptions used areconsistent. ( )答案:similar for all firms4.Because the DDM requires multiple estimates, investors should ( )答案:carefully examine inputs to the model and perform sensitivity analysis onprice estimates.5. A preferred stock will pay a dividend of $2.75 in the upcoming year, andevery year thereafter, i.e., dividends are not expected to grow. You require areturn of 10% on this stock. Use the constant growth DDM to calculate theintrinsic value of this preferred stock. ( )答案:$27.506.At the end of 2012, you forecast that a firm’s free cash flow for 2013 will be$430 million. If you forecast that free cash flow will grow at 5% per yearthereafter, what is the enterprise value? Use a required return of 10 percent.( )答案:8,600millionpany X has negative free cash flow but strong earnings that yield areturn on equity of 27 percent. Which of the following statements is morelikely to be true? ( )答案:the company is investing heavily8.At the end of 2012, you forecast the following cash flows (in millions) for afirm with net debt of $759 million: You forecast that free cash flow will growat a rate of 4% per year after 2015. Use a required return of 10% to calculateboth the fir ms’ enterprise value and the value of the equity at the end of 2012?( )答案:7,900million, 7,141 million9.Value is based on expected dividends, but forecasting dividends is notrelevant to value as a practical matter. ()答案:对10. A firm that has higher free cash flow have a higher value? ()答案:错第七章1.The following are earnings and dividend forecasts made at the end of 2012for a firm with $20.00 book value per common share at that time. The firmhas a required equity return of 10% per year. Forecast return of commonequity and residual earnings for the year of 2015. ()答案:ROCE is 15.71%and RE is 1.492. A firm cannot maintain a ROCE less than required return and stay in businessindefinitely. ()答案:错rmation indicates that a firm will earn a return on common equity aboveits cost of equity capital in all years in all years in the future, but its sharetrade below book value. Those share must be mispriced. ()答案:对4.The following are ROCE forecasts made for a firm at the end of 2010. ROCE isexpected to continue at the same level after 2013. The firm reported bookvalue of common equity of $3.2 billion at the end of 2010, with 500 millionshared outstanding. If the required equity return is 12%, what is the pershare value of these shares? ()答案:$6.405.Residual earnings valuation does not work well for companies like Coca-cola,Cisco System, or Nike, which have substantial assets, like brands, R&D assets, and entrepreneurial know-how off the books. A low book value must giveyou a low valuation. ( )答案:错6. A firm with book value of $15.60 per share and 100 percent dividend payoutis expected to have a return on common equity of 15% per year indefinitelyin the future. Its cost of equity capital is 10%. Calculate the intrinsic price tobook ratio. ()答案:1.57.Which of the following items are the drivers of Residual earnings? ( )答案:Return on common equity and growth in book value8.In September 2008 the shares of Dell, Inc, the computer maker, traded at $20.50 each. In its last annual report, Dell had reported book value of $3, 735million with 2, 060 million shares outstanding. Analysts were forecastingearnings per share of $1.47 for fiscal year 2009 and $1.77 for 2010 Dell paysno dividends. Calculate the per-share value of Dell in 2008 based on theanalysts’ forecasts, with an additional forecast that residual earnings willgrow at the anticipated GDP growth rate of 4 percent per year after 2010.Use a required return of 10 percent. the BPS at the end of fiscal-year 2008will be ( )答案:$1.8139.Calculate the per-share value of Dell in 2008 based on the analysts’ forecasts,with an additional forecast that residual earnings will grow at the anticipated GDP growth rate of 4 percent per year after 2010. Use a required return of 10 percent. ( )答案:24.84第八章1.Abnormal earnings growth is always equal to growth of (change in) residualearnings. ()答案:对2. A firm’s earnings are expected to grow at a rate equal to the required rate ofreturn for its equity,12%.what is the trailing P/E ratio? ()答案:9.333.what is the forward P/E ratio?( )答案:8.334. A P/E ratio for a bond is always less than that for a stock. ()答案:错5.which of the following statement is correct? ()答案:the normal forwardP/E and the normal trailing P/E always differ by 1.06.The following are earnings and dividend forecasts made at the end of 2010.The firm has a required equity return of 10% per year. Forecast abnormalearnings growth for 2012. ( )答案:0.3257.Forecast abnormal earnings growth for 2013. ( )答案:0.1658.Calculate the normal forward P/E for this firm. ( )答案:109.Firm can increase its earnings growth but not affect the value of its equity ()答案:对10.In early fiscal year 2009, analysts were forecasting $3.90 for Nike’s earningsper share for the fiscal year ending May 2009 and $4.45 for 2010, with adividend per share of 92 cents (0.92) expected for 2009. Forecast the cum-dividend earnings growth rate for 2010. ()答案:16.46%第九章1.Which of the following situation diversification dose not reduce risk?( )答案:returns on securities in the portfolio are perfectly correlated2. A statistical measure of the variability of a distribution around its mean isreferred to as __________. ( )答案:the standard deviation3.Normal distribution of returns can characterize the risk of investing in abusiness? ()答案:错4. A set of possible values that a random variable can assume and theirassociated probabilities of occurrence are referred to as __________. ()答案:probability distribution5.Below are the reformulate balance sheet for two firms with similar revenues.Amounts are in millions of dollars. Which firm look more risky forshareholders? Note that cash has been treated as operating cash. ( )答案:Firm Bing the CAPM, ß is a measure of: ( )答案:share price volatility7.Which of the following is not a measure of risk? ( )答案:correlationcoefficient8.Below are the reformulate income statement for two firms in the same line ofbusiness. Amounts are in millions of dollars. Which firm look more risky forshareholders? Reformulate the income statements: ( )答案:Firm A9.which of the following statement is not correct? ( )答案:variation in return onnet operating assets is only driven by profit margins10.Financing risk is driven by_____ ( )答案:All the answers are correct.第十章1.___________ is the extra required return that a lender demands to compensatefor the risk that the borrower will default. ( )答案:Default premium2.Which of the following statement is not the objective in reformulatingfinancial statement for credit analysis?( )答案:groups assets and liabilitiesin such a way as to evaluate the firm’s underlying profitability.3.______ is the error of forecasting that a firm will not default when in fact itdoes. ( )答案:A Type I error4.which of the following is the Off-balance sheet financing? ( )答案:All theanswers are correct5.which of the following statement is not correct? ( )答案:Pro forma analysisforecasts is not useful for credit analysis.6.The following numbers are extracted from the financial statements for a firmfor 2011 and 2012. Amounts are in millions of dollars. At the end of 2011, the firm’s 80 million shares traded at $25 each, but by the end of 2012 theytraded at $15.Calculate Z-score for 2011 ( )答案:2.687.Calculate Z-score for 2011 ( )答案:1.098.After analyzing the default risk for a five-year bond with a maturity value of$1,000 and an 8percent annual coupon, an analyst estimates the requiredreturn for the bond at 7percent per year. The bond has just been issued at aprice of $1,000. What is the value of the bond at a 7 percent required return?( )答案:1040.989.What is the yield-to-maturity with a market price of $1,000? ( )答案:8%10.What is the expected return of buying the bond at a price of $1,000? ( )答案:8%。
财务报表分析与运用杰拉尔德课后答案英文版第十章
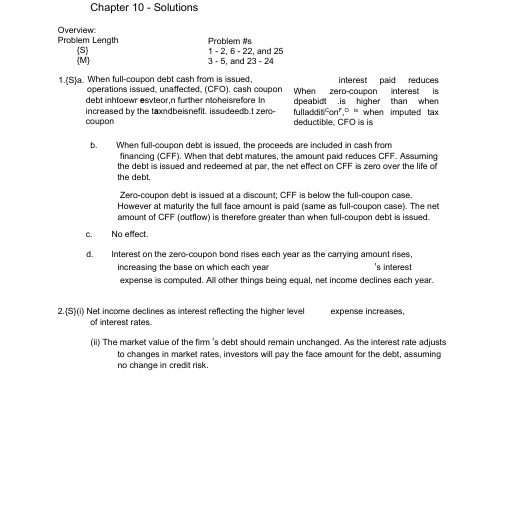
Chapter 10 - SolutionsOverview:Problem Length{S} {M}When full-coupon debt cash from is issued,operations issued, unaffected, (CFO). cash coupon debt inhtoewr e svteor,n further ntoheisrefore In increased by the t a xndbeisnefit. issudeedb.t zero-couponb.When full-coupon debt is issued, the proceeds are included in cash fromfinancing (CFF). When that debt matures, the amount paid reduces CFF. Assuming the debt is issued and redeemed at par, the net effect on CFF is zero over the life of the debt.Zero-coupon debt is issued at a discount; CFF is below the full-coupon case.However at maturity the full face amount is paid (same as full-coupon case). The net amount of CFF (outflow) is therefore greater than when full-coupon debt is issued.c. No effect.d.Interest on the zero-coupon bond rises each year as the carrying amount rises, increasing the base on which each year 's interestexpense is computed. All other things being equal, net income declines each year.2.{S}(i) Net income declines as interest reflecting the higher levelexpense increases,of interest rates.(ii) The market value of the firm 's debt should remain unchanged. As the interest rate adjuststo changes in market rates, investors will pay the face amount for the debt, assuming no change in credit risk.Problem #s1 - 2, 6 - 22, and 25 3 - 5, and 23 - 241.{S}a. interest paid reducesWhen zero-coupon interest is dpeabidt .is higher than whenfulladditi C on F ,O iswhen imputed tax deductible, CFO is is3.{M}a. Reported dataAMR Corp US Airways1998 1999 1998 1999 Cash and short-termjnv estme nts $ 2,073 $ 1,791 $ 1,210 $ 870Net receivables 1,543 1,134 355 387Inven tories 596 708 228 226Other curre nt assets 663 791 571 613 Curre nt assets $ 4,875 $ 4,424 $ 2,364 $ 2,096Acco unts payable 1,152 1,115 430 474Accrued liabilities 2,122 1,956 1,016 1,276Air traffic liability 2,163 2,255 752 635Notes payable andcurre nt porti on LT debt 202 538 71 116 Curre nt liabilities $ 5,639 $ 5,864 $ 2,269 $ 2,501 Net work ing capital (764) (1,440) 95 (405)Curre nt ratio 0.86 0.75 1.04 0.84Quick ratio 0.64 0.50 0.69 0.50Cash ratio 0.37 0.31 0.53 0.35b. Un like other payables, the air traffic liability willnot require cash outlays (other tha n low margi nal costs); i n stead this obligati on is satisfied ascustomers use their tickets on flights. The air trafficliability should therefore be excluded fromcomputati ons of short-term liabilities.While not part of the questi on, it is worth no ti ng that two of the three 1998 ratios are higher for US Airways tha n for AMR. While the ratios of both compa nies decli ned in 1999, the decli ne in US Airways ' ratios was greater. The 1999 declinein US Airways ' air traffic liabilityAMR Corp US Airways1998 19991998 1999Curre nt liabilities(reported) $5,639 $5,864 $2,269$2,501Air traffic liability (2,163)(2,255)(752) (635) Curre nt liabilities(adjusted)$3,476 $3,609$1,517 $1,866Net work ing capital 1,399815847230(adjusted)Curre nt ratio 1.40 1.23 1.56 1.12 Quick ratio 1.04 0.81 1.03 0.67 Cash ratio0.600.500.800.47As expected, all of America n Airli n es' liquidity measures improve whe n the air traffic liabilityisremoved from curre nt liabilities.However the adjustme nts in the table above overstate the firms ' liquidity, especially for AMR. A porti onof the air traffic liability relates to freque nt flyer programs (37% of AMR s 1999 liability and 13% of USAirways '1999 liability). AMR s freque flyer obligati on is based on the in creme ntal nt costs of fuel, food, and reservatio n s/ticketi ng costs (US Airw ays ' approach is similar but in cludes in sura nee and other compe n sati Thus some porti on of the air traffic c.Adjusted dataOnbility does represe nt n ear-term cash outlays.d.US Airways ' short stro n ger tha n curre -term liquidity position appears to be American ' s at December 31, and cash 1999 nt ratio ratio are that same. However, quick ratio and quids ratios evaporate whe nboth higher the higher the air liability is eliminated. This liability is lower for USAirways (relative to total curre nt liabilities). adjusted data show that all three liquidity ratios are higher for AMR than for US Airways.as its andthe curre nt trafficThe e.in dicates that fewer customers were willi ng to purchasetickets in adva nee, presumably due to the deteriorate nin the compa ny s finan cial positi on. In con trast,America n's air traffic liability in creased, althoughthe growth should be compared to past fluctuati ons andto growth for the rest of the in dustry.US Airways filed for ban kruptcy in August 2002.Proceeds equal $100,000/(1.12) 5$56,7424.(M}ad. Cash flow from operati ons is higher whe n zero-coup onbonds are issued because in terest is n ever reported as an operat ing cash outflow.[Note the infinite cashbasis coverage ratio.] In terest coverage, however, is lower after the first year,and decli nes as in terestexpense increases over time, reflecting the steadily increasing principal amount. Full-coupon bonds (if soldat par) result in a constant cash outflow from operations and constant interest expense. Given the Null Company's "steady state," the interest coverage ratio is constant on both accrual and cash flow bases.e. Given the tax deductibility of accrued interest on zero-coupon bonds, cash operations will be higher for both cases. The reported cash flow differences will remain unchanged. zero-coupon case, cash flow from operations more misleading as the firm must generate cash fromoperations to repay the debt at maturity. The obligation must be repaid, regardless of its cash flow classification.5. {M}a. The $US carrying amount = 1,282/1.37 =$936 millionb. Because the notes have no coupon, they were issued at adiscount. The difference between the face amount and the amount computed in part a must be unamortized discount.c. Interest expense (CHF millions) would be 7% X 1,282 = CHF 90d.Adding the 1999 interest computed in part c to the carrying amount at December 31, 1998: 90 + 1,282 = CHF 1,372 millione. The most obvious explanation is the change in the exchange rate from 1.37 to 1.60.In $US, 1999 interest expense = 7% X $$936 = $65 million, making the carrying amount at December 31, 1999 equal to $1,001 million [$936 + $65]. This is much closer to the carrying amount computed at 1,618/1.60 = $1,011 million.A second factor is that interest expense in CHF is computed quarterly, based on average rates for each period. The CHF carrying value at December 31, 1999 equals the 1998 carrying value + 1999 interest expense+ translation loss [Swiss franc decline increases the CHF debt amount].but unpaid flow fromFor the is even sufficientf. (i) Cash from operati ons is higher each year whe n zerocoup on no tes are issued because there is no cash in terest.(ii) Interest expense rises each year (excluding the effect of exchange rates)because it is based on a (rising) $US carrying amount.g. The rise in the value of the dollar (decli ne in Swissfranc) in creases in terest expe nse in CHF.6. {S}(i) In terest expe nse = In terest paid + cha nge in bonddisco unt$8,562 = $7,200 + $1,362(ii) = Market rate x [face value - disco unt]=.12 x [face value - $8,652]Therefore, face value = ($8,562/.12) + $8,652 = $80,000 (iii) Coup on rate = in terest paid/face value=$7,200/$80,000 = 9%7. {S}a.An in terest rate rise would decrease the market value of the fixed rate bonds buthave no effect on the variable rate bon ds. The effect on the fixed rate bonds woulddepe nd on their durati on.b.An in terest rate rise would in crease FIF's in terestexpense because more than half of its bonds have variable rates as well as a smallporti on of its bank loa ns.c. A finance compa ny seeks to match the in terest rate sen sitivity of its debt to that ofits earning assets.It is likely that FIF's fixed rate receivablesin creased over the 1996 - 2000 period and the compa nyin creased its fixed rate debt to lock in the spreadbetwee n fixed rate in terest in come and expe nse.d.For a finance compa ny, an an alyst is in terested inknowing how well the compa ny has matched the in terest rate sen sitivity ofits finan cial assets andliabilities. Whe n fair value estimates of finan cialassets are not provided the fair value of debt has very limited usef uln ess.8. {S}a. FIF has swapped variable rate in terest fixed rate (5.2%) payments payme nts for on a no ti onal amount of $25 millio n.b.In terest received = $25 milli on X receive rateIn terest paid = $25 millio n X 5.2% (both years)c. The swap reduced the sen sitivity to cha n ges in in terestrates by con vert ing part of the variable rate obligati on to one with fixed rates.9. {S}a. and b. In Y millio nsThe yen amounts were obta ined by multipl ying the dollar amounts by the exchange rate. For example, for the 2.14% bo nd at December 31, 1998, $55 X 113.60 =6,248.[Note : the yen amounts are roun ded.] rates are 3.86% and 5.34% respectively.c. It appears that both bonds were issued that at a disco unt,creat ing amortizati on each creases we add the 1999 the carry ing toamount year. If rate, it appears that in crease the in terestcoupon the effectived. One possible motivati on is to finance Japa n eseoperatio ns that are con ducted in yen. A sec ond is that, as a well-k nown company, BMY may be able to borrow more cheaply by borrow ing in yen and swapp ingthe yen proceeds into US dollars.10. {S}a. The adva n tage is that, whe n Takeda' s shareprice rose, the debt was conv erted into equity,stre n gthe ning the bala nee sheet. As conv ertible no tesare issued with a conv ersi on price that exceeds thethe n market price, the compa ny effectively sold com monshares at a premiu m. In additi on, because of thecon versi on feature, the in terest rate would have bee nbelow the rate required by noncon vertible no tes.The disadva n tage is that the debt was conv erted com mon shares at a time whe n Takeda could have sold new shares at a much higher price, obta ining the same capital at a lower cost.b. Reported data (Ye n millions)1998 1999 Total debt 44,482 21,338Equity829,381 907,373 Total capital 873,863 928,711Debt/total capital5.1%2.3%The more tha n 50% debt decrease was the largest factor reduci ng the debt/total capital ratio.Adjusted data (Ye n millioThis an alysis un derscores chapter; the an alyst must based on market con siderati ons. results in a more appropriate leverage measure.11. {S}a.There were two ben efits: a lower in terest rate tha n on noncon vertible debt of thesame maturity and the possibility of future conv ersi on. If conv ersi on takes place Roche will have sold shares for 25% more tha n their the n market price.b. First, you must compute the effective rate on the bonds con sideri ng their coup on rateand the disco untface value at which they were sold. In terestinto c.As the market price of Takeda shares was well above the1998, the conv ertible equity. con versi on price in beclassified as (subtracti ng 22,000 amount to equity) Takeda from 1998 to 1999 capital ratio was small:After that from debt and add ing 's debt was virtually un cha nged and the decli ne in the debt should adjustme nt the same debt/totalthe discussi on in classify con vertible Properclassifi the debtfrom expe nsefor 2000 would equal the effective rate multiplied bythe issue amount of 101.22 billion prorated for the portion of the bonds were outstanding. The carrying amount at December 31, 2000 the issue amount (101.22) plus the excess expense over interest at the coupon rate. c.If the Yen appreciates (declines) franc, then both interest expense amount of the debt will rise (fall).d.At the issue date the bonds should be considered debt because their conversion price is well above the market price. They should be considered equity market price is only when thesufficiently above the that conversion can be considered market pricehighly likely.12.{S}a. The advantages to Network Associates compared full-coupon with nonconvertible bonds were: (i) Lower interest rate(ii) No cash interest expense (iii)Higher cash flow from operations(iv) The likelihood that the debt would be converted to common shares before itsmaturity in 20 yearsb.The first year interest expense on the bonds is $16.44 million [4.75% X $346 million (39.106% X $885)]. As the bonds were issued in February 1998 interest expense for 1998 would have been below that amount. interest Assuming 1998 in expense of $15 million results amount of $361 million a carrying ($346 + $15).Thus 1999 interest expense can be estimated as $17.15 million (4.75% X $361million), close to the amount in the cash flow statement. This represents, therefore, the noncash interest expense for 1999.c. At a common stock price of $66.25, the conversion value of the bonds was:$1,280 million [$885 X ($66.25/$45.80)]At this price conversion is highly likely and the convertible bonds should be treated as equity. d. At a common stock price of $4, the conversion value of the bonds was $77.3 million[$885 X ($4/$45.80)]. At this price conversion is highly unlikely and the convertible bonds should be treated as debt.Yen (105 x 96.4%) year forwhich thewould equal of interest against the Swiss and the carryinge.Issuing bonds with an embedded put advantage of lowering the interest rate, will accept a lower rate in return for the put option.The disadvantage is that NET may be required to redeem sb o mndeh o rldaellrsofisthliekeblyonhdassif put option. As option exercise company 's financial condition shares are selling ata low price, option exercise may strain the company ' s financial condition further.13. {S}(i) If Munich Re had sold its shares of Allianz in June 2000 it would have incurred alarge capital gains tax.In addition, it would have had to sell the large block of shares at a discount to the market price of Allianz.By selling the exchangeable notes, Munich has postponedthe effective sale date, in the expectation that capital gains taxes would be reduced (they were). In addition, assuming the bonds are exchanged for Allianz shares, it sold those shares at a premium of 28% to the market price.The major disadvantage is that Munich Re retains the risk of ownership of Allianz shares. If Allianz shares do not rise by the maturity date of the notes, Munich will still hold the shares and will be required to repay the debt. In addition, Munich will have to pay interest expense on the notes until they mature or are exchanged, although it will also receive any dividends declared by Allianz. [Note : in December 2002 the market price of Allianzshares was ?100, far below the ?509 price at which the bonds are exchangeable.]option has the as investors exercise only weakenedif and the thethe(ii)If Munich Re had sold notes without the exchange feature it would have had to offer a higher interest rate, incurring higher interest expense. In addition, if the notes areexchanged, Munich Re will not have to repay the debt and interest expense willdecline as bonds are exchanged for Allianz shares.The disadvantage is that Munich Re has given up the possibility of a large increase inthe value of Allianz shares. Munich has also lost the flexibility of beingable to choose the period in which is recognizes the gain on the sale of Allianzshares.14. {S}a. Future redemption depends on conditions markets at each in the credit would “reset ”date. Investors redemption if more attractive Swiss choose francinvestments were available. That would be the case, for example, if (SFR) PepsiCo 's credit rating had declined.PepsiCo would redeem bonds if alternative financing sources are available or if SFRdebt is no longer desirable. The latter depends on PepsiCo 's exposure to SFRassets at that time or, if the debt was swapped for debt in another currency,conditions in the swap market at that time.b. The obligations should be classified as debt. One might argue that, because there is nostated maturity date, these bonds are “permanent ”capital and should be consideredequity. However the periodic reset provisions suggest that, at some point, eitherPepsiCo or investors will choose the redemption option. As investors can forceredemption, the bonds should be classified as debt.15. {S}a. An investor who is willing to accept the risk of lossof principal might find the high returns on these bonds attractive.b. In a period without insurance losses, Scor will be required to pay the high stated interestrates on these bonds, increasing interest expense, reducing reported income, andreducing the interest coverage ratio.c. In a period with in sura nee losses, Seor will be on theserequired to pay little or no in terest in ereas ing net in bon ds,come and the in terest coverage ratio.d. These bonds hedge Seor' s in sura nee risk. In terestexpe nse on these bonds will be high in periods without losses and low in periodswith losses. As a result they reduee the variability of Seor ' s reported net in eome.16. {S}a. The preferred shares should be eategorized as debt. Thedivide nd is set by periodie auet ions and the eompa ny may redeem them at any time. In effeet, they are a form of short-term debt that the eompa ny can exte nd as longas it is willi ng to pay the rate dema n ded by themarket. Should the eompa ny find a cheaper source of financing, it is likely to callthe preferred issue.[They were called in Ju ne 2001.]b. The ratio calculati on before and after adjustme nt is:17. {S}a. The fair value of Wal- Mart' s debt decli ned relative tobook value from 1-31-99 to 1-31-00. Interest rates musthave rise n duri ng that time period, as higher rates reduce the prese nt value offuture payme n ts.b. The fair value at 1-31-99 was above book value, implyi ng that (on that date) in terestrates were belowthe average rate of 7.2% on Wal-Mart debt. Thus the eompa ny could have borrowedat those lower rates,before rates in creased, redue ing its average rate.18. {S}a.rates were Wal-Mart may have believed that variable likely to fall and/or remain below fixed rates overthe swap period. Swapping fixed for variable under that assumption, reduce interest expense. rates would,swaps would increase interest expense. The second riskb. One risk that variable rates would rise so that theis coun terparty risk -the risk that the other party tothe swap would be unwilling to pay. The second risk would apply only when interestrate changes require payments to Wal-Mart.c. When interest rates rise, the value of the right toreceive the fixed rate of 5.75% declines, reducing the fair value of the swap. Weknow from problem 17a that interest rates rose from 1-31-99 to 1-31-00.19. {S}a. The market value of AMR 's fixedrate debt issues fellrelative to that book value at December 31, 1999, implying interest reduce rates musthave risen. Higher rates the fixed rate present value ofpayments associated withdebt.b. The interest rate must have been below 10.2% as the present value exceeds bookvalue.c. Because the interest rate on variable rate debt floats,fair value should not change except as a result of changes in credit quality.20. {S}a. Because the average floating rate was below the average fixed rate, th e swaps reducedAMR 's interest expense.b. AMR's swaps convert fixed rate to variable rate debt; AMR exchanged the right toreceived fixed rates for an obligation to pay variable rates. When interest rates rise,the value of the right to receive fixed rates declines, reducing the fair value of theswap. From the answer to problem 19a, we know that interest rates fell in 1999. Therise in interest rates therefore decreases the fair value of the swaps.c. AMR's debt nearly doubled in 1999, increasing its exposure to changes in interest ratesas much of its debt is fixed rate. Both the notional and fair value of AMR's swapsdeclined in 1999, reducing their offsetting effect on market risk. Both of these factorsincreased AMR 's exposure.21. {S}a. An argument for inclusion is that, for Fannie Mae, theissuance and retirement of debt are recurring operatingshould gains that are (as also included.the accountingbe included inand losses should discussed loss. Hedging chapter) or any or loss results hedging earnings as effects other economicHowever, Fannie Mae may be an exception. As stated in part a, the company routinely issues and retires debt, suggesting that gains and losses should be included in operating earnings. Before doing so, the analyst should try to determine whether the gains or losses for the particular quarter are unusual or reflect interest ratechanges over multiple periods, suggesting that the gains or losses should (analytically) be spread over several quarters.b.c.activities whose consequences operatingearnings.should be includedAn argument for exclusion is that gains or losses fromindebt repurchase reflect entire period the edceobnt obme ic changes during the included in operating which managemweanst cohuot s teantoding realize the gain. earnings forAn argument for including the hedging hedging activities are part of Fannie operating activities.An argument for exclusion is that the hedging loss was unusually large operating e a ion distortsWe believe st h oaut lbde excludedTghaeinsseagnadinlsosasneds firms. decisions because mafyronmotoypi e rldatginagin refinancing despiteoapnedraltoinsg seosffset and should notthe in peri odloss is that Mae ' snormal the trend offrom debt earningsretirement from in the for most resulteconomic gain management{S}a. The $300 million gain should be excluded from Arco 's operating earnings for 1997 because the gain results from the appreciation of Lyondell shares in prior years (possibly including years prior to the bond issuance). b. Arco may have chosen to issue the exchangeable notes to(i) maintain its controlling interest in Lyondell for strategic reasons (ii) postpone the income tax consequences of sale (iii)obtain a higher price for the shares than themarket price at that time (iv)avoid an unfavorable to the effectimpact on sale proceeds dueon Lyondell a large block of' s share price of sellingshares (v) retain the flexibilityto report the gain in a choiceperiod of management ' sOn Arco 's balance sheet, in Lyo ndell thethe investment shares is reduced by the cost sharesofexchanged; debt is reduced by the carrying value of the notes (after-tax)retired; equity is increased by the gain.The income statement reports the gain on the sale and the related income tax expense.The transaction is noncash. However Arco 's cash flow statement will report (as an adjustment to net income in the cash from operations section) the amount of the gain and any deferred income tax effect.22.c.basis{M}a. Adding prin cipal and in terest payme nts:PV of $20 million, payable in 10 years + PV of 20 payme nts of $1 millio n each Financing cash in flow = proceeds = 1PV factor (n=20, r=.04) = .45639 x $20,000,000 = $ 9,127,800 2PV factor (n=20; r=.04) = 13.59033 x $1,000,000 = $13,590,330On Jan uary 1,2000, cash and debt liability are each in creased by $22,718,130expe n se, show n as accrued in terest on December 31, 1994 bala nee sheet Jan uary 1,2001:In terest payme nt of $1,000,000 (no impact on expe nse)-$905,074 Reduction of bo nd premium = $1,000,000 $94,926-$94,92623. $ 9,127,800 13,590,330$22,718,130In terest expe nse(in come tax ignored)Year e nded December 31,2000: July 1: $22,718,130 x .04 = $908,725In terest payme nt of $1,000,000 (no impact on expe n se) Reduction of bo nd premium = $1,000,000 $91,275Debt bala nee on July 1 = $22,718,130 $22,626,855-$908,725 -$91,275December 31: $22,626,855 x .04 =$905,074 in terest Calculati ons:Year e n ded December 31,2001:July 1: $22,531,929 x .04 = $901,277 interest expe nse In terest payme nt of $1,000,000 (no impact on expe nse) Reduction of bo nd premium = $1,000,000 $98,723 -$901,277 Debt bala nee on July 1 = $22,531,929 $22,433,206 -$98,723 December 31: $22,433,206 x .04 = $897,328 in terest expe n se, show n as accrued in terest on December 31, 1995 bala nee sheet. Jan uary 1,2002:In terest payme nt of $1,000,000 (no impact on expe nse) Reduction of bo nd premium = $1,000,000 $102,672Debt bala nee on Ja n uary 1 = $22,433,206 $22,330,534Operati ng cash outflow2600 : One interest payment on July 1, 1994, $1,000,000 2001: Two in terest payme nts of $1,000,000 each, Jan uary 1 and July 1, $2,000,000Bala nee sheet impacts_______2000: effect of bond issua nee reduct ion of bond premium at July 1 in terest payableat December 31 in terest expe nse reduces equity 2001: reducti on of in terest payable and bond premium at January 1 reduct ion ofbond premium at July 1 in terest payable at December 31 in terest expe nse reduces equity-$897,328 -$102,672 onb. The purchase price must be equal to the face amount si nee the market in terest rate isequal to the coup on rate. 2 3The carry ing amount of the bonds on July 1,2003 willbe $21,997,050. 4 The gain from repurchase is the differenee between the purchase price and carryi ng amou nt: $20,000,000 - $21,997,050 = $1,997,050. It is a gainbecause a liability has bee n ext in guished for a lesser asset amount. Because of the cha nge in in terest rates since the bonds were issued, Derek has captured the rema ining bond premium. The jour nal entry would be:Bonds payable 20,000,000Premium on bonds payable 1,997,050Cash 20,000,000Gai n on exti nguishme nt 1,997,050This can be show n, as well, by using prese nt values: purchase price = prese nt value of $20,000,000, to be repaid in 6.5 years:PV factor (n=13, r=.05) = .53032 x $20 million = $10,606,400 plus PV of 13 payments of $1,000,000 each: PV factor (n=13, r=.05) = 9.39357 x $1,000,000 = $9,393,570; total is $20,000,000.Prese nt value of $20,000,000, to be repaid in 6.5 years: PV factor (n=13, r=.04) = .60057 x $20 millio n = $12,011,400 plusPV of 13 payments of $1,000,000 each: PV factor (n=13, r=.04)=9.98565 x $1,000,000 = $9,985,650; total = =$21,997,050. Thecarrying amount could also be determ ined by exte nding thean alysis in part A (reduc ing the bond premium at the time of each in terest payme nt) to July 1,2003.c. The gain is not a comp onent of continuing, operat ing in come but should beconsidered nonrecurring. It is a consequence of the change in interest rates ratherthan the firm's operating activities, and cannot be expected to recur.d. 1. The gain provides a on e-time in crease in reported net in come.2 The decrease in leverage (as a lower amount of higher coup on debt is issued toreplace the lower coup on debt) may help the firm avert or delay tech ni caldefault on bond cove nan ts. The repurchase may also allow the firm to elimi nate limit ing cove nan ts on this specific debt issue. Thus eve nif new debt must be issued to raise the funds n eeded for repurchase, thefirm may wish to retire the bond issue.。
中级财务会计英文版.课后答案(Chap03)
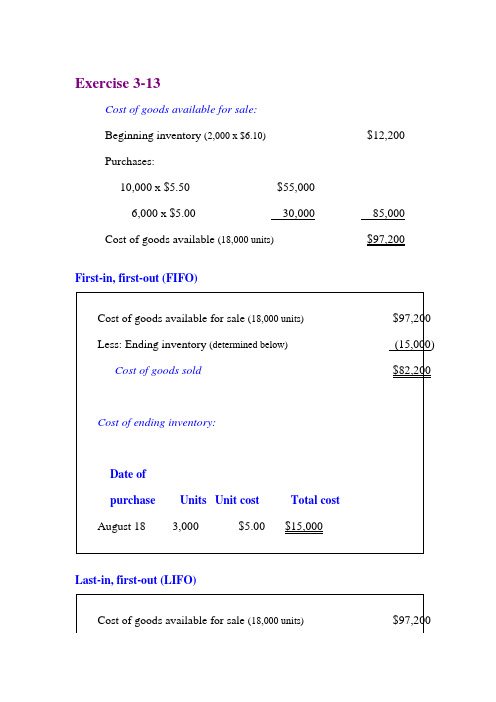
Cost of goods available for sale:
Beginning inventory(600 x $80)$ 48,000
Purchases:
1,000 x $ 95$95,000
800 x $10080,000175,000
Cost of goods available(2,400 units)$223,000
First-in, first-out (FIFO)
Cost of goods available for sale(2,400 units)$223,000
Less: Ending inventory(below)(80,000)
Cost of goods sold$143,000
Cost of ending inventory:
6,000(from 8/8 purchase)5.5033,000
Aug. 254,000(from 8/8 purchase)5.5022,000
3,000(from 8/18 purchase)5.0015,000
Total15,000$82,200
Ending inventory= 3,000 units x $5.00 =$15,000
Cost of ending inventory:
Date of
purchaseUnitsUnit costTotal cost
August 183,000$5.00$15,000
Last-in, first-out (LIFO)
Cost of goods available for sale(18,000 units)$97,200
6,000 @ $5.00
财务会计英语版课后答案
Chapter 1Page 81.Classify following items as either an expense (E),a revenue(R),an asset(A),or a liability( L);Cash, buildings, salaries of the sales force, $5 owed to a company for work performed, Mortgage to a bank, sales.Answer:Cash—A Buildings—A Salaries of the sales force—E$5 owed—L Mortgage to a bank—L Sales—R2. Classify each of the following as n operating (O), bank (I) , or financing (F) in a statement of cash flows; Wage paid to workers, Cash received form a bank in the form of a mortgage, cash dividends paid to a supplier of inventory, Cash paid to purchase a new machine.Answer:Wage paid—O Cash of mortgage-- F Cash dividends paid -- FCash paid to supplier of inventory—O Cash paid to purchase a machine—IPage111.List several economic decisions that rely on accounting information.Answer:·Whether to grant a loan·How much to pay for a share of common stock.·Whether to grant a rate increase to an electric utility·How much in damages the loser of a lawsuit must pay ·How much of a bonus to pay a plant manager·Whether to enter a new market2. Why do financial statements have footnotes, and what kinds of information might you find in them?Answer:Financial statements have footnotes because financial disclosure is a complex business. The notes tell us some of the specifics about the company environment , what accounting methods the company has used, what the accounting numbers might be if alternative methods had been used, and some of the major contingencies that are not formally included in the statement proper.Page 201.Describe the process of setting accounting standards. What are the roles of all the parties you mention?Answer:The FASB, a private, not-for-profit organization ,sets GAAP in the U.S. It publicly declares an agenda, promulgates "ExposureDrafts" of proposed standards, holds open meetings, and invites input from interested parties. The FASB has been delegated this authority by the SEC, a government agency with legal authority to determine GAAP.2.Think of an example, like the executive compensation example in the chapter, where incentives might exist to bias accounting numbers one way or another.Answer:There are other examples, but here is one that is different. A taxpayer has incentives to bias reported income downward in order to minimize income tax payments. However, it is important to understand that tax accounting rules are different from GAAP, and this book is about GAAP. Chapter 14 covers GAAP for taxes in more detail.Other examples include:·An entrepreneur seeking a loan from a bank or funding from a venture capitalist might have incentives to bias accounting numbers to look favorable.·A firm that is subject to scrutiny for earning excess profits(e.g.,an oil company)might have incentives to bias accounting numbers to look less favorable.·A utility subject to rate regulation might have an incentive tobias accounting numbers to look less favorable in order to gain more generous increases in its rates. (At this writing, there is a rather severe controversy about whether electric utilities in California are genuinely in financial difficulty and should be allowed to continue to impose large rate increase.)Chapter 2Page 381 Define assets, liabilities, and equities.Gave an example ofeach. How are assets valued? How are liabilities valued? Answer:An asset is a probable future economic benefit obtained or controlled by an entity as a result of a past transaction. Cash marketable securities, accounts receivable, inventories, prepaid expenses, patents, copyrights, trademarks, and property, plant and equipment are all examples of assets. A liability isa probable future sacrifice of economic benefits arisingfrom present obligations of an entity to transfer assets or provide services as a result of a past transaction or event.Accounts payable, accrued liabilities, unearned revenues, warranties, and bonds payable are all examples of liabilities.Accounting valuation of assets uses severaldifferent methods, including market value, expected realizable value, lower of cost or market, present value of future cash flows, and historical cost. Accounting valuation of liabilities is the expected amount that will be paid, perhaps adjusted for the time value of money.2. Explain what is meant by the entity concept. Answer:The entity is the person or organization about which accounting's financial history is being written.3 .A company signs a ten-year employee contract with a vicepresident. The salary is $ per year, guaranteed. Is this contract an asset? Would it appear on the balance sheet?Explain.Answer:The rights conveyed by the contrat may be an asset from an economic point of view, but they are not an asset under GAAP. The contract would not appear on the balance sheet as an asset, because GAAP does not record executory contracts, which are contracts that require future performance form both parties. That is ,GAAP views the contract as determining what services will be provided, no asset is recognized under GAAP.(Neither is a liability for payment recognized until services have beenperformed.)4 .A company purchased a parcel of land 10 years ago at a cost of $.The land has recently been appraised at $. At what value is the land carried in the balance sheet? How does the appraisal affect the carrying value in the balance sheet? Answer:The land is on the balance sheet at its historical cost of $.The carrying value of the land is unaffected by the appraisal. Page 421、Define debit and credit .What kind of balance ,debit or credit ,would you expect to find in the inventory T-account?In the Common Stock T-account?Answer:A debit is an entry on the left side of a T-account. A credit is an entry on the right side of a T-account. We would except to find a debit balance in Inventory, and credit balances in Bonds Payable and Common Stock. The reason is the convention that increases in assets are debits and increases in liabilities and equities are credits.2、If the trial balances, it means that you have analyzed all the effects of transactions correctly. True or false?Explain.Answer:False. A balanced means that the trial balance is consistent, not necessarily correct. For example. If an arbitrary entry is made that debits Cash and credits Common Stock for an equal amount, the trial balance will balance but it will be wrong. An accounting can receipt of cash and the issuance of common stock, but it alone can not make cash or additional common shares.3﹑Suppose Web sell leases a portion of its space to another company. Web sell’s accounts are debited and credited to record this transaction?Answer:Web sell would debit Cash and a liability, Rent Received in Advance, for the prepayment.Chapter 3Page 571. Define revenue and expense. How does one decide to list an item as revenue in an income statement? What is matching? Answer:Revenues are increases in net assets resulting from operations over a period of time .Expense are decreases in net assets resulting from operations over a period of time .Revenue isrecognized the earnings process is substantially complete , a transaction2. Give an example not found in the text , of an expense that is paid for in cash in a prior accounting period .In a subsequent accounting period.Answer:There are many allowable responses . An example is a patent that is purchased and paid for in one year and used in next .3. Give an example, not found in the text , of a revenue that is received in cash in a prior accounting period . In a subsequent accounting period .Answer:An example is a house painting contractor that receives payment for one-third of the contract price before beginning the painting .4. Explain why it is right to think of an asset as a cost and an expense as an expired cost .Answer:An asset is a future benefit . And there is an opportunity cost associated with not selling it for cash or exchanging it to settleChapter 6Page 120:1.The following table lists the adjustments and has an X in thecolumn indicating the approach:2. We first take adjustment for prepaid insurance and insurance expense. It would be easy to think of this adjustment as focusing on how much of the insurance coverage remained, as opposed to how much was used. In fact, the same type of logic could be used---computing a monthly rate for the coverage and applying that to the months reminding, instead of the months used.Now take adjustment for depreciation expense and accumulated depreciation. Estimating the value of the equipment at year end might be easy, for example, if there is a market for used equipment, or very difficult, for example, if the equipment was specially designed for Websell. Once a value estimate for the equipment at year end is obtained, depreciation expense would be the change in value over the year.Page 1231.$5000×(1+0.06)^10=$5000×1.79085=$8954.242.$5000×(1+0.06/2)^(10×2)=$5000×(1+0.03)^20=$5000×1.80611=$9030.563. $1000×(1.05)^3+$1000×(1.05)^2+$1000×(1.05)^1=$3310.134. ($1000×0.05/5)^13+$1000×(1+0.05/5)^10+$1000×(1+0.05/5)^5=($1000×(1.01)^15)+($1000×(1.01)^10)+($1000×(1.01)^5) =$1160.97+$1104.62+$1051.01=$3316.6Page 1241.x×.(1.07)^3=$3000 x=$3000/(1.07)^3=$2448.892. Calculate the present value at 10% of $1300 received two years from now. If that is greater than $1000, you are better offwith the $1300 to be received in two years. If its present value is less that $1000, you better off with $1000 now. $1300/(1.10)^2=$1074.38Therefore, you are better off receiving $1300 two years from now.Another way to do this problem is to take the future value at 10% of $1000. At the end of two years, the $1000 would compound up to:$1000×(1.10)^2=$1210,Which is less than you would have at that point if you took the $1300.3.The most I would be willing to pay is the present value at 8% of the stream of $1000 payment:$1000/(1.08)^1+$1000/(1,08)^2+$1000/(1,08)^3=$925.926+857.339+793.832=$ 2577.1(rounded)Chapter 8Page 1681.Aging takes the balance in accounts receivable at the end of the year, and sorts it by how long ago the transaction occurred that gave rise to that receivable. Experience has shown that “older” accounts have less likelihood of ever being collected.Percentages of likely uncollectibles for each category are applied to the totals in that category , and the results added to obtain an estimate of the allowance for uncollectibles required to value properly the estimated amount that will be collected from the accounts receivable. The bad debts expense then falls out as a “plug” in the allowance for uncollectibles.The percentage-of-sales method just estimates bad debt expense as a percent of sales, and plug the balance in the allowance account.2. Cash (118)Accounts receivable (118)12/31/2003(to recognize collection of cash from companies owing service co. from 2002 sales)Allow ance for doubtful accounts (7)Accounts receivable (7)12/31/2003(to write off accounts we know will not be collected) Ac counts receivable (125)Sales reven ue (125)12/31/2003(to recognize revenue and to anticipate collection of the receivable)If we focus on recording the bad debts expense that is associated with billings for 2003, we would record.06×$=$7500 in baddebts expense.B ad debts expense………………………………………7.5 Allowan ce for doubtful accounts…………………………7.5 12/31/2003(to record bad debt expense in anticipation of not collecting 100% of receivables)Method one: focus on the percentage of sales expected not to be collected.Allowance for doubtful accounts(10.5 is the “plug”,i.e., the number that drops out)Now we move to 2004, where events now proceed as expected . Collections are $117.5 thousand. Cash………………………………………………..117.5 Accounts receivable…………………………………117.512/31/2004(to recognize collection of cash form companies owing service co. from 2003 sales)Allowance for doubtful ac counts………………………7.5 Accounts receivable………………………………….7.512/31/2004(to write off accounts we know will not be collected)Accounts receivable (125)Sales revenue (125)12/31/2004(to recognize revenue and to anticipate collection of the receivable)If we focus on recording the bad debts expense that is associated with billings for 2004, we would record.06×$=$7500 in bad debts expense.Bad debts expense……………………………………7.5 Allowance for doubtful acco unts…………………………7.5 12/31/2003(to record bad debt expense in anticipation of not collecting 100% of receivables)The allowance for doubtful accounts using the peentage-of-sales method looks like this:Method one: focus on the percentage of sales expected not to be collected.Allowance for doubtful accountsOnly the entries recording bad debt expense are different using the aging method. Instead of the above entries recording bad debt expense, we would have the following analysis: Each year, we would adjust the balance in the allowance for doubtful accounts so that the net receivable ends up at $. That is, we would solve $-X=$,and find that the ending balance in the allowance for doubtful accounts must be $7500.Analyzing the account, we would determine that at 12/31/2003 we must add $4500 to the allowance for doubtful accounts: Bad debts expense………………………………..4.5 Allowanc e for doubtful accounts…………………….4.512/31/2004(to record bad debt expense in anticipation of not collecting 100% of receivables)At 12/31/2004, we must add $7500 to the allowance for doubtful accounts:Bad debts expense………………………………..7.5 Allowan ce for doubtful accounts…………………….7.512/31/2004(to record bad debt expense in anticipation of not collecting 100% of receivables)Using aging, the allowance for doubtful accounts T-account looks like this:Method two: focus on the ending balance in the allowance for doubtful accounts.Allowance for doubtful accountsChapter 9Page 1831.LIFO is last-in first-out. It means that in computing ending inventoryand cost of goods sold, the cost of items sold is assigned in reverse chronological order of their purchase, beginning from the most regent items purchased in a period. FIFO is first-in, first-out .It means that in computing ending inventory and cost of goods sold, the cost of items sold is assigned in chronological order of their purchase, beginning from the goods on hand at the beginning of the period. Average cost means that in computing ending inventory and cost of goods sold, the average unit cost of the beginning inventory and items purchased in a period is used to determine the cost of goods sold and remaininginventory.2.Yes, it is still a positive net present value project. In fact, its netpresent value is higher than when the purchase was made at$1.05 per unit, since the cash outflow is reduced but the cash inflow remains the same. The cash outflow on 12/31/01 when purchases are at $0.95 per unit is $114.This means the net cash flow at 12/31/01 is ($4) instead of ($16),and the NPV for Widget Company is:NPV=-100-$4/1.1+$10/ (1.1^2) +$144/ (1.1^3) =$12.82First, we redo the case of FIFO. The inventory T-account is:Widget Co. Inventory Account under FIFO Flow AssumptionInventory (FIFO)Ending inventory values can be read from the above T-account. Net incomes are:Widget Incomes using FIFONow we redo the case of FIFO. First, the inventory T-account is: Widget Co. Inventory Account under FIFO Flow AssumptionInventory (FIFO)Ending inventory values can be read from the above T-account. Net incomes are:Page 186To calculate the market-to-book ratios and accounting returns on equity: Market-to-book Ratios under Average CostAccounting Rates of Return under Average CostCollecting the results for FIFO from the chapter and these results for average cost, we have:Market-to-book Ratios under Various Cost Flow AssumptionAccounting Rates of Return under Various Cost Flow AssumptionAs is apparent, the market-to-book ratios and accounting rates of return for average cost are between for LIFO and FIFO.2. Because it has more recent costs on the balance sheet in the inventory account, FIFO has market-to-book ratios closer to 1regardless of whether prices rise or fall.Chapter 10Page 1961. The total profit on the transaction is the sales price of $880.00 less the original cost of $734.03:Sales price of securities $880.00Less : original cost ($735.03)Profit on transaction $144.97The cash flows were: $735.03 out on January1, 2001, and $880.00 in on January 3, 2003.There were profit in 2001, 2002, and 2003.In 2001, therewas a profit of $81.17.In 2003,there was a profit of $5.00.2. The unadjusted book value of the security on December 31,2002 was $793.83.If the market value of the security on that date was $790.00,an adjustment reducing its carrying value by $3.83 is required to write it down to its market value: Unrealized loss on market value securities-trading ……3.83 Marketable securities –trading ………… 3.83 If the security were sold for $810.00 on January 3, 2003, the entry would be:Cash ………………………………810.00Marketable securities –trading ………………790.00Gain on marketable securities-trading …………20.001/03/2003(To record the sale of the Marketable securities—trading )Page 1981. When a securities is classified as trading security, profits or losses show up on the income statement in every period from when the security is purchased until when it is sold. when a security is classified as available-for-sale ,profits or losses only show up on the income statement in the period in which the security is sold.2. the unadjusted book value of the security on December31,2002 was $793.83.If the market value of the security on that date was $790.00,an adjustment reducing it’s carrying value by $3.83 is required to write it down to it’s market value. however unlike the trading security case ,the unrealized loss is an equity account ,not a temporary account:Unrealized loss on marketable securities-available-for-sale 3.38 Marketable securities –trading ………………3.83To record the sale of the security for $810.00 on January 3,2003: Cash ………810.00Unrealized gain on marketable securities-available-for-sale(58.80-3.83) ………54.97Marketable securities-trading …………790.00Realized gain on marketable securities-available-for-sale ……………74.9712/31/2002(To mark-to-market the Marketable securities—available-for-sale)Chapter 111.a. Under straight-line depreciation, the depreciation expense each year is$600-$100/5 years=$100 per year.b. Under double-declining balance depreciation, the depreciation expense each year is given in the following table:c. Under sum-of-year’-digits depreciation, the depreciation expense each year is given in the following table:Sum-of years’-digits depreciation2. Intangible assets are most often shown in one line that is cost net of amortization. Tangible assets are sometimes shown in three lines: cost , accumulated depreciation, and net .3. Economic depreciation is the change in the economic value of the asset. Economic depreciation can be appreciation when the asset increases in value. We seen this already with marketable debt securities, which sometimes increase in valuebecause of unpaid interest4.It is easy and fulfills the requirement of GAAP to provide depreciation using a systematic and rational method. No GAAP depreciation method likely correctly reflects economic depreciation anyway ,so a simple expedient may be good enough.1.Sraight-line depreciation is $100 per year ($300/3 years).Double-declining balance depreciation is given in the following table:2.For straight-line depreciation,the entry is the same each year:Depreciation expense (100)Accumulateddepreciation (100)For double-declining balance depreciation,the entries are: Year1Depr eciation expense (200)Accu mulated depreciation (200)Year2Depreciation expense………………………………66.67 Acc umulated depreciation………………………66.67 Year3.declining balance because depreciation expense under straight-line is only $100,while under double-declining balance depreciation expense is $200.4.If the company buys one asset every year and each asset lasts three years,then in year 4 it will have three assets.Under straight-line depreciation,each of those assets generates a depreciation expense of $100;therefore total depreciation expense would be 3*$100,or $300.Under double-declining balance depreciation,total depreciation expense depends on the age of each asset.The company would have one asset in its first year of life,one in its second year of life,and one in its third year.Therefore,totaldepreciation expense would be:$200+$66.67+$33.33=$300,the same as under straight-line.Both depreciation methods give the same total depreciation because:1.Both methods fully depreciate the assets over their lives.2.The cost of the assets has remained constant.3.The company is in a steady state in which the number ofnew assets purchased in a period equals the number ofold assets being retired in that period.。
上海对外贸易学院财管中加财务报表分析(答案见其他word)quiz 3
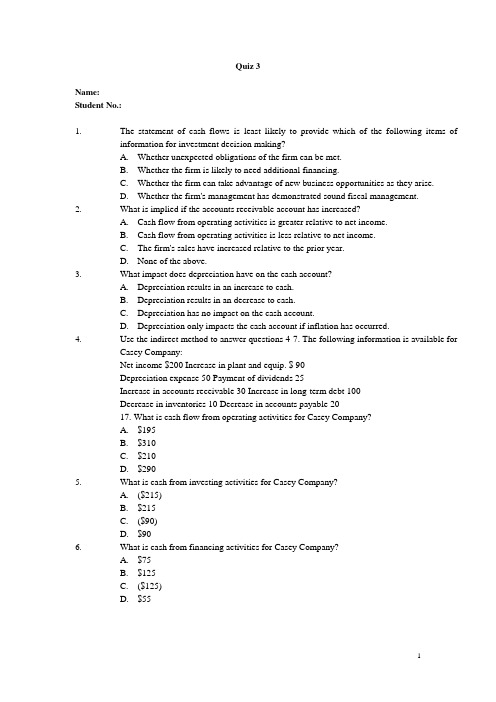
Quiz 3Name:Student No.:1. The statement of cash flows is least likely to provide which of the following items ofinformation for investment decision making?A.Whether unexpected obligations of the firm can be met.B.Whether the firm is likely to need additional financing.C.Whether the firm can take advantage of new business opportunities as they arise.D.Whether the firm's management has demonstrated sound fiscal management.2. What is implied if the accounts receivable account has increased?A.Cash flow from operating activities is greater relative to net income.B.Cash flow from operating activities is less relative to net income.C.The firm's sales have increased relative to the prior year.D.None of the above.3. What impact does depreciation have on the cash account?A.Depreciation results in an increase to cash.B.Depreciation results in an decrease to cash.C.Depreciation has no impact on the cash account.D.Depreciation only impacts the cash account if inflation has occurred.4. Use the indirect method to answer questions 4-7. The following information is available forCasey Company:Net income $200 Increase in plant and equip. $ 90Depreciation expense 50 Payment of dividends 25Increase in accounts receivable 30 Increase in long-term debt 100Decrease in inventories 10 Decrease in accounts payable 2017. What is cash flow from operating activities for Casey Company?A.$195B.$310C.$210D.$2905. What is cash from investing activities for Casey Company?A.($215)B.$215C.($90)D.$906. What is cash from financing activities for Casey Company?A.$75B.$125C.($125)D.$557. What is the change in cash for Casey Company?A.$85B.$375C.$125D.$1958. The write-off of obsolete equipment would be classified as:A.operating cash flow.B.investment cash flow.C.financing cash flow.D.no cash flow impact.9. Increase in dividends payable would be classified as:A.operating cash flow.B.Investment cash flow.C.financing cash flow.D.no cash How impact.10. Net income for Monique Inc. for the fiscal period ended December31, 2005 is $78,000.Itsaccounts receivable balance at December 31,2005 is $121,000 and it was $69,000 atDecember31, 2004. Its accounts payable balance at December 31, 2005 is $72,000 and itwas $43,000 at December 31, 2004. Depreciation for 2005 is $12,000 and there is anunrealized gain of $15,000 included in 2005 income from the change in value of tradingsecurities. Which of the following amounts represents Monique's cash flow from operationsfor 2005?A.$52,000.B.$67,000.C.$82,000.D.$98,000.11. What does a decreasing inventory turnover ratio usually indicate about a firm?A.The firm is selling more inventory.B.The firm is managing its inventory well.C.The firm is inefficient in the management of inventory.D.Both (a) and (b).12. What is the net trade cycle?A.The amount of time needed to complete the normal operating cycle of a firm.B.The amount of time it takes to manufacture or buy inventory.C.The amount of time it takes to sell inventory.D.None of the above.13. To study trends in a firm's cost of goods sold (COGS), the analyst should standardize thecost of goods sold numbers to a common-sized basis by dividing COGS by:A.assets.B.sales. income.D.the prior year's COGS.14. Return on equity using the traditional DuPont formula equals :A.(net profit margin)(interest component)(solvency ratio).B.(net profit margin)(total asset turnover)(tax retention rate).C.(net profit margin)(total asset turnover)(financial leverage multiplier).D.(tax rate)(interest expense rate)(financial leverage multiplier).15. The percentage change in operating earnings divided by the percentage change in sales isreferred to as the:A.coefficient of variation of operating income.B.coefficient of variation of sales.C.operating leverage.D.gross profit margin.。
管理会计(英文版)课后习题答案(高等教育出版社)chapter3

管理会计(英文版)课后习题答案(高等教育出版社)chapter3管理会计(高等教育出版社)于增彪(清华大学)改编余绪缨(厦门大学)审校CHAPTER 3ACTIVITY COST BEHAVIORQUESTIONS FOR WRITING AND DISCUSSION1.Knowledge of cost behavior allows a man-ager to assess changes in costs that result from changes in activity. This allows a man-ager to assess the effects of choices that change activity. For example, if excess ca-pacity exists, bids that at least cover variable costs may be totally appropriate. Knowing what costs are variable and what costs are fixed can help a manager make better bids.2.The longer the time period, the more likelythat a cost will be variable. The short run is a period of time for which at least one cost is fixed. In the long run, all costs are variable.3.Resource spending is the cost of acquiringthe capacity to perform an activity, whereas resource usage is the amount of activity ac-tually used. It is possible to use less of the activity than what is supplied. Only the cost of the activity actually used should be as-signed to products.4.Flexible resources are those acquired fromoutside sources and do not involve any long-term commitment for any given amount of resource. Thus, the cost of these resources increases as the demand for them increas-es, and they are variable costs (varying in proportion to the associatedactivity driver).mitted resources are acquired by theuse of either explicit or implicit contracts toobtain a given quantity of resources, regard-less of whether the quantity of resource available is fully used or not. For multiperiod commitments, the cost of these resources essentially corresponds to committed fixed costs. Other resources acquired in advance are short term in nature and essentially cor-respond to discretionary fixed costs.mitted fixed costs are those incurred forthe acquisition of long-term activity capacity and are not subject to change in the short run. Annual resource expenditure is inde-pendent of actual usage. For example, the cost of a factory building is a committed fixed cost. Discretionary fixed costs are those incurred for the acquisition of short-term activity capacity, the levels of which can be altered quickly. In the short run, resource expenditure is also independent of actual ac-tivity usage. An engineer’s salary is an e x-ample of such an expenditure.7. A variable cost increases in direct proportionto changes in activity usage. A one-unit in-crease in activity usage produces an in-crease in cost. A step cost, however, in-creases only as activity usage changes in small blocks or chunks. An increase in cost requires an increase in several units of activ-ity. When a step cost changes over relativelynarrow ranges of activity, it may be moreconvenient to treat it as a variable cost.8. A step cost with narrow steps can be treatedas variable, while one with wide steps is typ-ically treated as fixed.9.An activity rate is the resource expenditure for an activity divided by the activity’s pra c- tical capacity.10.Mixed costs are usually reported in total in the accounting records. How much of the cost is fixed and how much is variable is un- known and must be estimated.11. A scattergraph allows a visual portrayal of the relationship between cost and activity. It reveals to the investigator whether a rela- tionship may exist and, if so, whether a li- near function can be used to approximate the relationship.12.Managers can use their knowledge of cost relationships to estimate fixed and variable components. A scattergraph can be used as an aid in this process. From a scattergraph,a manager can select two points that best represent the relationship. These two points can then be used to derive a linear cost for- mula. The high-low method tells the manag- er which two points to select to compute the linear cost formula. The selection of these two points is not left to judgment.13.Because the scatterplot method is not re- stricted to the high and low points, it is poss- ible to select two points that better represent the relationship between activity and costs, producing a better estimate of fixed and va- riable costs. The main advantage of thehigh-low method is that it removes subjec-tivity from the choice process. The same linewill be produced by two different people.14.Assuming that the scattergraph reveals thata linear cost function is suitable, then themethod of least squares selects a line thatbest fits the data points. The method alsoprovides a measure of goodness of fit sothat the strength of the relationship betweencost and activity can be assessed.15.The best-fitting line is the one that is “clo s-est” to the data points. This is usually meas-ured by the line that has the smallest sum ofsquared deviations.16.No. The best-fitting line may not explainmuch of the total cost variability. There mustbe a strong relationship as well. 17.The coefficient of determination is the per-centage of total variability in costs explainedby the activity. As such, it is a measure ofthe goodness of fit, the strength of the rela-tionship between cost and activity.18.The correlation coefficient is the square rootof the coefficient of determination. The cor-relation coefficient reveals the direction ofthe relationship in addition to the strength ofthe relationship.19.If the variation in cost is not well explainedby activity usage (the coefficient of determi-nation is low) as measured by a single driv-er, then other explanatory variables may beneeded to build a good cost formula.20.If the mixed costs are immaterial, then themethod of decomposition is unimportant. Furthermore, sometimes managerial judg-ment may be more useful for assigningcosts than the use of formal statistical me-thodology.EXERCISES3–11. N umber of Units Total Cost Cost per Unit0 $240,000 NA100,000 240,000 $2.40200,000 240,000 1.20300,000 240,000 0.80400,000 240,000 0.60500,000 240,000 0.482. This depreciation cost is strictly fixed.3–21. Miles Traveled Total Cost Cost per Mile0 $ 0 $0.005,000 6,500 1.30*10,000 13,000 1.3015,000 19,500 1.3020,000 26,000 1.3025,000 32,500 1.30 *$5,200/4,000 or $26,000/20,000 = $1.30 2. The cost of fuel for the delivery activity is strictly variable. 3–31. Number of Units Total Cost Cost per Unit0 $10,000 NA10,000 10,000 $1.0020,000 10,000 0.5030,000 20,000 0.6740,000 20,000 0.5050,000 30,000 0.602. Forming machines rental cost is a step cost.Resource Flexible/Committed Cost BehaviorJet rental Committed FixedHotel rooms Committed FixedBuffet Flexible VariableFavor package Flexible VariableBuses Committed Step3–51. Total Cost Unit CostPlastic$ 10,800 $0.027Direct labor andvariable overhead28,000 0.020 Mold sets320,000 0.050Other facility costs410,000 0.025Total $ 48,800 $0.12210.90 ? $0.03 ? 400,000 = $10,800; $10,800/400,000 = $0.0272$0.02 ? 400,000 = $8,000; $8,000/400,000 = $0.023$5,000 ? 4 quarters = $20,000; $20,000/400,000 = $0.054$10,000; $10,000/400,000 = $0.0252. Plastic, direct labor, and variable overhead are flexible resources; molds andother facility costs are committed resources. The cost of plastic, direct labor, and variable overhead are strictly variable. The cost of the molds is fixed for the particular action figure being produced; it is a step cost for the produc-tion of action figures in general. Other facility costs are strictly fixed.1. X-ray film and developing supplies are likely to vary with the number of pa-cemakers produced. As production increases, we would expect more film and developing supplies to be used. Inspectors and X-ray machines should re-main constant within the relevant range.2. Total cost = $310,000 + ($1.60 ? 100,000) = $470,000Total fixed cost = $310,000Total variable cost = $1.60 ? 100,000 = $160,0003. Unit cost = $470,000/100,000 = $4.70 per pacemaker4. Unit fixed cost = $310,000/100,000 = $3.10 per pacemaker5. Unit variable cost = $1.60 per pacemaker6. a. $438,000/80,000 = $5.48; $310,000/80,000 = $3.88; $1.60b. $502,000/120,000 = $4.18; $310,000/120,000 = $2.58; $1.60The unit cost increases in the first case and decreases in the second case.This is attributable to spreading fixed costs over fewer units of activity output in the first case and over more units in the second case. The unit variable cost stays constant.1. Committed resources: trucks and technicians’ salariesFlexible resources: supplies, small tools, and fuel2. Variable activity rate = $840,000/70,000 = $12 per callFixed activity rate = $1,200,000*/80,000 = $15 per callTotal cost of one call = $12 + $15 = $27 per call*($26,250 ? 40) + ($6,000 ? 25)3. Activity availability = Activity usage + Unused capacityCalls available = Calls made + Unmade calls80,000 calls = 70,000 calls + 10,000 calls4. Total cost of Cost of Cost ofc ommitted resources = activity used + unused capacity$1,200,000 = ($15 ? 70,000) + ($15 ? 10,000)$1,200,000 = $1,050,000 + $150,000Note: The analysis is restricted to committed resources, since only these re-sources will ever have any unused capacity.1. Committed resource charges: monthly fee, activation fee, cancellation fee (iftriggered by contract cancellation prior to one year)Flexible resource charges: all additional charges for airtime, long distance and roaming2. Plan 1:Minutes available = Minutes used + Unused minutes60 minutes = 45 minutes + 15 minutesPlan 2:Minutes available = Minutes used + Unused minutes120 minutes = 45 minutes + 75 minutesPlan 1 is more cost effective. Jana will have some unused capacity (on aver-age, 15 minutes a month), and the overall cost will be lower by $10 per month.3. Plan 1*:Minutes available = Minutes used + Unused minutes60 minutes = 90 minutes + (- 30) minutesPlan 1*:M inutes available = Minutes used + Unused minutes60 minutes = 60 minutes + 0 minutesAdditional minutes = 30 minutes*There are a number of ways to illustrate the use of minuteswith Plan 1. Here are two possibilities. The problem, of course, is that all included monthly minutes are used, and Jana must purchase additional minutes.Plan 2:Minutes available = Minutes used + Unused minutes120 minutes = 90 minutes + 30 minutesPlan 2 is now more cost effective, as the monthly cost is $30. Under Plan 1, Jana will pay $20 plus $30 (30 minutes ? $1.00) or $50 per month. (The $1.00 additional charge includes the airtime and regional roaming charge.)1.Cost of Oil Changes$0$1,000$2,000$3,000$4,000$5,000$6,000$7,000$8,000$9,00005001,0001,500Number of Oil ChangesC o s tThe scattergraph provides evidence for a linear relationship.2. High (1,400, $7,950); Low (700, $5,150)V = ($7,950 – $5,150)/(1,400 – 700)= $2,800/700 = $4 per oil changeF = $5,150 – $4(700)= $5,150 – $2,800 = $2,350Cost = $2,350 + $4 (oil changes)Predicted cost for January = $2,350 + $4(1,000) = $6,3503–9 Concluded3. Output of the regression routine calculated by a spreadsheet:Rounding the coefficients:Variable rate = $4.65 per oil changeFixed cost = $1,697Predicted cost for January = $1,697 + $4.65 (oil changes)= $1,697 + $4.65(1,000) = $6,347R2 = 0.97 (rounded)This says that 97 percent of the variability in the cost of providing oil changes is explained by the number of oil changes performed.4. The least-squares method is better because it uses all eight data points in-stead of just two.3–101.The scattergraph provides evidence for a linear relationship, but the observa-tion for 300 moves may be an outlier.2. High (800, $14,560); Low (100, $3,000)V = ($14,560 – $3,000)/(800 – 100)= $11,560/700 = $16.51 per move (rounded)F = $3,000 – $16.51(100)= $3,000 – $1,651 = $1,349Cost = $1,349 + $16.51 (moves)Predicted cost = $1,349 + $16.51(550) = $10,430 (rounded) 3–10 Concluded3. Output of the regression routine calculated by a spreadsheet:Rounding the coefficients:Variable rate = $18.43 per moveFixed cost = $498Cost = $498 + $18.43 (moves)= $498 + $18.43(550) = $10,635 (rounded)R2 = 0.93 (rounded)This says that 93 percent of the variability in the cost of moving materials is explained by the number of moves.4. Normally, we would prefer the least-squares method since the data appear tobe linear. However, the third observation may be an outlier. If the third obser-vation (300 moves and $3,400 of cost) is dropped, the R2 rises to 99 percent.The new cost formula would beCost = $1,411 + $17.28 (moves)The higher fixed cost is much more in keeping with what we observed with the scatterplot in requirement 1.1. Independent variable = number of inspections;Dependent variable = inspection costHigh point (500, $10,000); low point (100, $6,200)2. Variable rate = ($10,000 –$6,200)/(500 –100) = $3,800/400 = $9.50 per inspectionFixed cost = $10,000 – ($9.50)(500) = $5,250Formula for inspection cost = $5,250 + $9.50XEstimated inspection cost = $5,250 + $9.50(280) = $7,9103. Output of regression routine using spreadsheet program:Variable rate = $9.62 per hourFixed cost = $5,370Formula for setup cost = $5,370 + $9.62XEstimated setup cost = $5,370 + $9.62(280) = $8,064 (rounded)R2 = 0.958 or 95.8%The coefficient of determination is high—indicating a strong relationship be-tween inspection cost and the number of inspections.1. Depreciation:Variable rate = ($170,000 – $170,000)/(48,000 – 24,000) = 0 Fixed cost = $170,000 – $0(24,000) = $170,000Depreciation = $170,000Depreciation is purely fixed.Power usage:Variable = ($16,320 – $8,160)/(48,000 – 24,000) = $0.34Fixed cost = $8,160 – $0.34(24,000) = $0Power usage = $0.34(machine hours)Power usage is purely variable.Maintenance:Variable rate = ($149,000 –$101,000)/(48,000 –24,000) = $2.00Fixed cost = $101,000 – $2.00(24,000) = $53,000Maintenance = $53,000 + $2.00(machine hours)Maintenance is a mixed cost.2. Depreciation = $170,000Power usage = $0.34(32,000) = $10,880Maintenance = $53,000 + $2.00(32,000) = $117,0003. Machine related overhead = Depreciation + Power usage + Maintenance= $170,000 + $0.34(MHr) + $53,000 + $2.00(MHr)= $223,000 + $2.34(MHr)For 32,000 machine hours:Machine-related overhead = $223,000 + $2.34(32,000)= $223,000 + $74,880 = $297,880Cost formulas can be combined if the activities they describe share a com-mon objective and if the activity driver is the same. If the activities are not logically related, then it may not be wise to combine cost formulas even if they have a common driver.1. Maintenance cost = $5,750 + $16X2. Maintenance cost = $5,750 + $16(650) = $5,750 + $10,400 = $16,1503. To obtain the percentage explained, r needs to be squared: 0.89 0.89 = 79.21percent. The relationship appears strong but perhaps could be improved by searching for another explanatory variable. Leaving about 20 percent of the variability unexplained may produce less than satisfactory predictions.4. Maintenance cost = 12($5,750) + $16(8,400) = $69,000 + $134,400 = $203,400Note: The fixed cost from the regression results is the fixed cost for the month (since monthly data were used to estimate the equation). However, the question asks for the cost for the year. Therefore, the fixed cost from the re-gression equation must be multiplied by 12.3–141. Overhead = $2,130 + $17(DLH) + $810(setups) + $26(purchase orders)2. Overhead = $2,130 + $17(600) + $810(50)+ $26(120)= $2,130 + $10,200 + $40,500+ $3,120= $55,9503. Since total setup cost is $40,500 for the following month,a 50 percent de-crease would reduce setup cost to $20,250, saving $20,250 for the month.1. Warranty repair cost = $2,000 + $60(number of defects) –$10(inspectionhours)2. Warranty repair cost = $2,000 + $60(100) –$10(150) = $6,5003. The number of defects is positively correlated with warranty repair costs. In-spection hours are negatively correlated with warranty repair costs.4. In this equation, the independent variables—number of defects and inspec-tion hours—account for 88 percent of the variability in warranty repair costs.It seems that analysts have identified some very good drivers for warranty re-pair costs.3–161. Independent variable = direct labor hours; dependent variable = overheadcostHigh point (1,300, $35,200); low point (800, $23,370)Note: The high point is the point of highest direct labor hours (the indepen-dent variable), not the highest cost (which is for Month 7 in this case).2. Variable rate = ($35,200 – $23,370)/(1,300 – 800)= $11,830/500 = $23.66 per direct labor hourFixed cost = $35,200 – ($23.66)(1,300) = $4,442Formula for overhead cost = $4,442 + $23.66 (direct labor hours)Estimated overhead cost = $4,442 + $23.66(1,120) = $30,941 (rounded)3–16 Concluded3. Output of regression routine using spreadsheet program:Variable rate = $25.21 per direct labor hourFixed cost = $3,132Formula for overhead cost = $3,132 + $25.21 (direct labor hours)Estimated overhead cost = $3,132 + $25.21(1,120) = $31,367 (rounded)R2 = 0.95, or 95%The coefficient of determination is high—indicating a strong relationship be-tween overhead cost and direct labor hours.3–171. a2. c3. a4. e5. ePROBLEMS3–181. Salaries:Senior accountant—fixedOffice assistant—fixedInternet and software subscriptions—mixed Consulting by senior partner—variable Depreciation (equipment)—fixed Supplies—mixedAdministration—fixedRent (offices)—fixedUtilities—mixed2. Internet and software subscriptions:V = (Y2– Y1)/(X2– X1)= ($850 – $700)/(150 – 120) = $5 per hourF = Y2– VX2= $850 – ($5)(150) = $100Consulting by senior partner:V = (Y2– Y1)/(X2– X1)= ($1,500 – $1,200)/(150 – 120) = $10 per hour F = Y2– VX2= $1,500 – ($10)(150) = $0Supplies:V = (Y2– Y1)/(X2– X1)= ($1,100 – $905)/(150 – 120) = $6.50 per hour F = Y2– VX2= $1,100 – ($6.50)(150) = $125Utilities:V = (Y2– Y1)/(X2– X1)= ($365 – $332)/(150 – 120) = $1.10 per hour F = Y2– VX2= $365 – ($1.10)(150) = $2003–18 Concluded3. UnitFixed Variable Cost Salaries:Senior accountant $2,500 $ —Office assistant 1,200 —Internet and subscriptions 100 5.00 Consulting —10.00Depreciation (equipment) 2,400 —Supplies 125 6.50Administration 500 —Rent (offices) 2,000 —Utilities 200 1.10 Total cost $9,025 $22.60 Thus, total clinic cost = $9,025 + $22.60/professional hourFor 140 professional hours:Clinic cost = $9,025 + $22.60(140) = $12,189Charge per hour = $12,189/140 = $87.06Fixed charge per hour = $9,025/140 = $64.46Variable charge per hour = $22.604. F or 170 professional hours:Charge/day = $9,025/170 + $22.60 = $53.09 + $22.60 = $75.69The charge drops because the fixed costs are spread over more professional hours.。
财务报表分析与运用杰拉尔德课后答案英文版第三章

财务报表分析与运用杰拉尔德课后答案英文版第三章Chapter 3 - Soluti onsOverview: Problem Len gth{S}}{M {L} Problem #---------- 1,32, 7, 8, 12, 13 4 - 6, 9 - 11, 14, 151.{S}a.Palomba Pizza Stores Stateme nt of Cash Flows Year En ded December 31,2000Cash Flows from Operati ng Activities:Cash Collectio ns from CustomersCash Payme nts to Suppliers Cash Payme nts for Salaries Cash Payme nts for In terestNet Cash from Operati ng Activities Cash Flows from In vesti ng Activities:Sales of Equipme nt Purchase of Equipme nt Purchase of LandNet Cash for Inv esti ng Activities Cash Flows from Financing Activities: Retireme nt of Common Stock Payme nt of Divide ndsNet Cash for Financing Activities Net In crease in CashCash at Begi nning of Year Cash at End of Year$ 250,000 (85,000) (45,000) (10,000)38,000 (30,000) (14,000)(25,000) (35,000)$ 110,000(6,000)(60,000) $ 44,000 50,000 $_94,000 ______b. Cash Flow from Operati ons (CFO) measures the gen erati ng ability of operati ons, in additi on profitability. If used as a measure of performa nee, CFO is less subject to distortio n tha n net in come. An alysts use the CFO as although it is with high net cashto earnin gs, Compa nies and low CFO may be usinga check on the quality of reportednot a substitute for net in come. in come aggressive in come recog niti on tech niq ues. The ability ofoverlya firm to gen erate cash from operati ons on a con siste nt basis is one indication of the financial health of the firm. Analysts search for trends in CFO to indicatefuturecash con diti ons and pote ntial liquidity or solve ncy problems.Cash Flow from Investing Activities (CFI) reports how the firm is inv esti ng its excess cash. The an alyst must con sider the ability of the firm to con ti nue to grow and CFI is a good indication of the attitude of management in this area. This component of total cash flow includes thecapital expe nditures made by man ageme nt to maintain and expa nd productive capacity. Decreas ing CFI may be a forecast of slower future growth.Cash Flow from Financing (CFF) in dicates the sources of financing for the firm. For firms that require exter nal sources of financing (either borrow ing financing) i t communi cates man ageme nt'sregarding financial leverage. Debt financing indicates future cash requireme nts for prin cipalpayme nts. Equity financing will cause future share diluti on.For firms whose operati ng cash flow exceeds in vestme nt needs, CFF indicates whether that excess is used to repay debt, pay (or in crease) cash divide nds, or repurchase outsta nding shares.Cash payments for interest should be classified as CFF forpurposes of an alysis. This classificati on separates the effect of finan cial leverage decisi ons from operat ingresults. It also facilitates the comparison of Palomba with other firms whose finan cial leverage differs.The change in cash has no analytic significanee. The change in cash (and hence, the cash balanee at the end of the year) is a product ofmanagement decisions regarding financing. For example, the firm can show a large cash bala nee by draw ing on bank lines just prior to year end.of growth and acquisiti ons.However, few firms provideseparate disclosures productivecapacity. obta ined from proxy stateme nts and other disclosures of acquisiti ons (See Chapter14).or equity prefere nces and in terest earnings perc.d.e. andf.There are a nu mber of defi niti ons of free cash flows.In the operatio ns required capacity.text, free cash less the to mai ntai n This defi niti on flow is amount of the firm ' requires defi ned capital s curre nt the exclusi on as cash from expe nditures productive of costsof expenditures incurred to Capital costs of acquisitions main tai nmay beIn the finance literature, free cash flows available to equity holders are oftenmeasured as cash from operationsless capital expe nditures. In terest paid is a deducti on when comput ing cashfrom operati ons as it is paid tocreditors. Palomba ' s free cash flow available to equity holders is calculated asfollows:Net cash flow from operating activities less net cash forinv est ing activities:$110,000 - $6,000 = $104,000The investment activities disclosed in the problem do notin dicate any acquisiti ons.Ano ther defi niti on of free cash flows, which focuses onfree cash flow available to all providers of capital, would exclude payments forinterest ($10,000 in this case) anddebt. Thus, Palomba' s free cash flow available to allproviders of capital would be $114,000.2.{M}a.b.c. The bad debt provision does not seem to be adequate. From1997 - 2001 sales in creased by approximately 40%, whilenet receivables more tha n doubled, in dicati ng thatcollect ions have bee n lagg ing. The ratios calculated in part b also in dicate theproblem. While bad debt expe nsehas remained fairly constant at 5% of sales over the 5 yearperiod, net receivables as a percentage of sales havein creased from 29% to 49%; cash collect ions relative tosales have declined. data are that stated Sten gel has allowedcompetitive reas ons.expla nati ons for thesehave lengthened or thatto delay payme nt for Other possible payme nt terms customers3.{S}Niagara Compa nyStateme nt of Cash Flows 20011 Can also be used to calculate cash in puts, decreas ing that outflow to $645 while in creas ing cash expe nses to $100.3-54.{L}a. G Compa ny1 Note that these two items cannot be calculated separately from the information available.b. M Compa nyNote : This is not a true receipts and disbursements schedule as it shows certain amounts (e.g., debt) ona net basis rather than gross. Such schedules (and cash flow stateme nts) prepared from published datacan only show some amounts n et, uni ess suppleme ntary data areavailable.The cash flow stateme nts are prese nted with the in come statement for comparison purposes in c.answering Part d.G Compa ny: Stateme nt of Cash Flows ($ thousa nds)insufficient information to separate them.d. Both compa nies are credit risks. Although both areprofitable, their CFO is increasingly negative. If currenttrends con ti nue they face possible in solve ncy. However, before reject ing both loa ns outright, it is importa nt to know whether CFO and in come differ because the compa nies are doing poorly or because they are grow ing too fast.Both compa nies in creased sales over the 5 year period;Compa ny M by 50%, Compa ny G by more than 300%. Are these sales real (will cash collect ionsmaterialize)? If they are "growi ng too fast," it may be advisable to make the loan but also toforce the compa ny to curtail its growth un til CFO catches up. One way to verify whether the gap is the result of sales to poor credit risks is to check if the growth in receivables is "proporti on al" to the salesgrowth. Similar checks can be made for the growth ininven tories and payables. In this case, the inven tory ofM company has doubled from 1996 to 2000 while COGSin creased by only 56%. The inven tory in crease would be onearea to inv estigate further.There is a sig nifica nt differe nee in the inv estme ntpattern of the two companies. Company M has made purchasesof PPE each year, while Company G has made little net investment in PPE over the period. YetCompany G has grownmuch faster. Does this reflect the n ature of the bus in ess(Company G is much less capital intensive) or has CompanyG used off bala nee sheet financing tech niq ues?The cash from financing patter ns of the two compa nies alsodiffer. Both tripled their total debt over the period and in creased the ratio of total debt to equity. Give n Compa nyM's slower growth (in sales and equity), its debt burde n has grow n much more rapidly. Despitethis, Compa ny M has continued to pay divide nds and repurchase stock. Compa nyG has not paid divide nds and has issued new equity. Thesetwo factors acco unt for its larger in crease in equity from1996 to 2000.Based only on the finan cial data provided, G looks like the better credit risk. Its sales and in come are grow ing rapidly, while M's in come is stablemodestly grow ing sales. Un less further cha nges the in sights discussed here, you lend to Compa ny G.to decli ning inv estigati on shouldpreferontoCash from inv est ing: Capital expe ndituresCash from financing: Short term borrow ing Lon g-term repayme nt Divide ndsNet cha nge in cashWorksheet for (I ndirect Method) Cash Flow Stateme ntIn come StatementBala nee Sheet 12/31/0012/31/01Change Ca; Effec s h ;t Net in come $1,080$1,08( 0Depreciati on 600600Acco unts receivable $1,500 $1,650 $150 (150:Inven tory2,0002,200 200 (200:Accruals80088080 80Acco unts payable1,2001,320120120Depreciati on (600)(600:Net fixed assets6,5007,050550(550、Capital expe nditures$(1,150)Note payable5,5006,050550 550Short-term borrowi ng$ 550Lon g-term debt2,0001,602(398) (398)Lon g-term debt repayme nt$ (398 •)Net in come(1,080)(1,08C ))Reta ined earnings 5001,148648648Divide nds paid$ (432)$ 1005.{L}a. (i)Stateme nt of Cash Flows - In direct Method Cash from operati ons:Net in comeAdd non cash expe nse: depreciati onAdd/Subtract cha nges in work ing capital:Acco unts receivable Inven tory AccrualsAcco unts payable(150) (200) 80 120$1,080 600(150) $1,530 1,150550 (398) (432) _ $(280) $ 100The worksheet to create the cash flow stateme nt is prese ntedabove. Each balanee sheet change (other than cash) is accounted for and matched with its correspondingactivity. As a last check, the net in come and the add-backs of non-cash items arebalaneed and “closed ” to their respective accounts (PP&E andreta ined earnin gs) providi ng the amounts of capitalexpe nditures and divide nds.a. (ii) Stateme nt of Cash Flows - Direct MethodCash from Operati ons:Cash collecti ons $9,850Cash payme nts for mercha ndise (6,080)Cash paid for SG&A (920)Cash paid for in terest (600)Cash paid for taxes (720)$1,530Cash for In vest ing Activities:Capital expe nditures (1,150)Cash for Financing Activities:Short-term borrow ing 550Lon g-term debt repayme nt (398)Divide nds (432)$( 280)Net Change in Cash $ 100The worksheet to create the cash flow stateme nt is prese nted below. Each balaneesheet change (other than cash) isfor and matched with its corresp onding activity. Furthermore the operat ing acco unt cha nges are matchedcorresp onding in come stateme nt item. As a last check, the net in come is bala need and “ closed ” to retai ned earningsthe amount of divide nds. acco un ted to their provid ingNote that there is no differenee methods in the cash flow statement for investing and financing activities, betwee n the in directand in the worksheetand directfor cashWorksheet for (Direct Method) Cash Flow Stateme ntSalesAcco unts receivableIn comeStateme nt 1$10,000Bala nee SheetChange$ 150Cash Effect$10,000 (150) 2/31/00$ 1,50012/31/01 ($ 1,650Cash Collect ions $ 9,85(COGS (6,000) (6,000 ') Inven tory 2,000 2,200 200 (200〕Acco unts payable 1,200 1,320 120 120 Cash Paid for Mercha ndise $(6,080) SG&A expe nse (1,000) (1,000 ') Accruals 800 880 80 80 Cash Paid for SG&A $ (92C ') In terest expe nse (600) (600;Cash Paid for In terest $ (600 ')Taxes (720) (720:Cash Paid for Taxes $ (720 ')Depreciati on (600) (600;Net fixed assets 6,500 7,050 550 (550】Capital Expe nditures $(1,150)Note payable 5,500 6,050 550 550 Short-term Borrow ing $ 550Lon g-term debt 2,000 1,602 (398) (398)Long -term Debt Repaid $ (398 )Net in come (1,080) (1,080 ') Reta ined earnings 500 1,148 648 648 Divide nds $ (432 )$ 0 $ 100 __6.{L}a.Exhibit 3P-3 does not provide the (cha nges in the) in dividual comp onents that make up the cha nges in work ingcapital. As such, to create the direct method cash flow stateme nt, we must obta in the in formatio n directly from the bala nee sheet. This procedure does not n ecessarily yield the same cash flow components using the direct method as those provided by the compa ny in its in direct method calculati ons. Differe nces may arise whe n 1. there are acquisitio ns/divestme nts2. there are foreig n excha nge adjustme nts3.the firm aggregates or classifies investing accrualstogether with operati ng on es.In this case, the differences are minimal as indicated below. (The calcuati ons required for the direct method cashpresented in Exhibit 3S-1 along with the assumptions the stateme nt) Direct Method Cash Flow Stateme ntIn directDiffere nee(Exhibit 3S-1)Method(Exhibit3P-3)Cash collect ions $348,627Cash for suppliers (246,100)Cash expe nses (94,791)In terest paid (5,303)Tax paid(2,127)C ASH F ROM O PERATIONS $ 4,560$4,398 $ 162 C ASH F ROM INVESTMENTS (4,251)(4,089)(162)C ASH F ROM F INANCING215 215 — C HANGE IN CASH$524$ 524■ ■■flow stateme nt are used to gen erateExhibit 3S-1: Direct Method Statement of Cash FlowsSales In come Stateme nt 2001 $342,215 Bala neeSheet12/31/00Bala nee Sheet6/30/2001ChangeCash Effect$ 342,215Acco unts receivable 91,636 85,224 (6,412) 6,412 Cash collect ions $ 348,627Cost of goods sold (238,799) (238,799) nven tories 163,206 158,451 (4,755) 4,755Acco unts payable 84,734 72,678 (12,056) (12,056) Cash in puts $(246,100)Operati ng expe nses (91,795) (91 ,795) Other curre nt assets 1,426 1,843 417 117)Prepaid expe nses &other assets 55,566 56,630 1,064 (1, 064) Accrued expe nses* 17,679 16,299 (1,380) (1, 380) Postretireme nt ben efitobligati on 2,265 2,130 (135) 135) Cash expe nses $ (94,791)n terest expe nse (5,128) (5,128)n terest payable* 175 0 (175) 175) In terest paid $ (5,303)Tax expe nse (831) 331)n come j tax receivable 4,116 2,889 (1,227) 1 ,227n come j tax payable 1,130 2,383 1,253 1 ,253 Deferred in come taxes 18,096 18,574 478 478Tax paid $ : 2,127C ASH FLOW FROM OPERATIONS4,560 Depreciati on expe nse (4,732) (4,732)z ixed assets 91,108 90,966 (142) 142n vestme nts in jointven tures 9,714 9,591 (123) 123 Minority in terest 971 1,187 216 216C ASH FLOW FROM INVESTMENTS$ (4,251)Curre nt porti on ofon g-term debt 3,425 3,425 - 0_on g-term debt 161,135 165,799 4,664 4 ,664Divide nds paid** (4,461) Other- cha nge in stockholders' equity 12C ASH FLOW FROM FINANCING $ 215Net In come (check) 930Net cha nge in cash $ 524* Assumed cha nge in in terest payable to con form to in terest paid.** From the in direct methodb.1st 6 MonthsCFO ----- 1996$34,915 ------ 1997 $ 5,165---------- 1998$(23,528) ------- 1999$73,597 -------- 2000$(18,606) ----- 2001$4,560 ------ Totals $ 76,103 CFI 1(38,007)(42,977) (46,767) (13,500) (9,017) (4,251) (154,519)$(3,092) $(37,812)$(70,295)$60,097$(27,623)$ 309$(78,416)CFI F 4,230 38,782 70,474 (60,473) 27,124 215 80,352n early $50 millio n in divide nds and borrowed n early $130million to finance its investments and acquisitions.Thistrend con ti nued in the first six mon ths of 2001 duri ng which the firm borrowed an additional $4,664 million to help pay its divide nds and meet capital expe nditure n eeds. Cash gen erated from operati ons from 1996 through the end of the first 6 mon ths of 2001 was $76 millio n but the company spent $154 million to replace productive capacity and for investments and acquisitions. When free cash flows is calculated on this basis (i.e. CFO — CFI) there is a shortfall of $78 millio n. This shortfall as well asdivide nd payme nts were finan ced by borrowi ngperiod. The in abilityto meet its capital and divide ndn eeds fromoperatio ns clearly in dicated that either the divide nd would have to be reduced or the compa ny would not be able to rema in competitive an d/or grow as n eeded.As no ted in Box 3-2, fromgen erated free cash flowexpenditures) of $1.5 million,the A. M. Castle added an other 3-2 also showed that over the1996 to 2000, the compa ny (CFO less net capital duri ng the first six mon ths $309 thousand. However, Box five-year period, Castle paid over the same?The Swedish GAAP cash flow statements (CFS) begin with pretax and pre-fi nan cial items whereas the U.S. GAAP CFS show adjustme nts to net in come.?The net financial items aggregate interest costs and interest in come from various sources (in clud ing divide nds andin terest from associated compa nies and other in terestin come).?Swedish GAAP CFS aggregate all changes in working GAAP CFS provide detailed disclosure of cha nges in comp onents of work ing capital; non-operat ing cha nges arereported as comp onentsactivities.?Swedish GAAP comb ines cash and cash equivale nts, finan cialreceivables (primarily receivables fromassociatedcompa ni es) and finan cial liabilities (curre nt andIon g-term debt) in a measure called net finan cial assetsor liabilities. SFAS 95 shows the change in cash and cashequivale nts with cha nges in finan cial receivablesreported as components of CFO and CFI. Changes in currentand Ion g-term debt are reported in cash from financing activities.The cash flow statement is shown on page 16.c . Disadva ntages:(1) Aggregati on of all cha nges in operat ing or work ing capital accounts comb ines cash con seque ncesoperati ng and inv esti ng activities. As no ted in the chapter,investing activities tend to distort cash flow from operati ons.The use of net finan cial items tends operat ing, inv est ing, andfinancingAlthough disclosure is available to facilitate its calculati on, noseparate disclosure of actual cash outflow for interest (financing)costs is provided.The inclusion of financialrepayme nt) and finan cial liabilitiesreceivablesdistorts cash flows from both investing activities. Thisapproach also hampers the an alysis of free cash flowsdiscussed in the chapter. It is also un clear what basiswas used by the compa ny to allocate a porti on of thefinan cial receivables to operat ing activities and therema in der to the net financial position category.ofto obscuresactivities.(borrow ing andin liquid fundsand financing7.{M}a.capital; U.S. theoperati ngof inv est ingb.[Part c is continued on page 17]Amounts in millions of Swedish KronorSwedish GAAP U.S .GAAPYears Ending December 31 1999 1998 1999 1998 Operati ng profit 2,615 2,475 Net in come 2,287 2,591Non cash items 1,551 1,388 1,551 1,388Change in work ing capital (3) 169 (3) 169 Net finan cial items (206) (137) (137)Paid tax (122) 253 0 253Cash flow before capital expe nditure 3,835 4,148 Operati ng activities 3,835 4,148Capital expe nditure (1,988) (2,557) (1,988) (2,557) Change in finan cial receivables (3,395)Effects from divested activities 3,258 0 3,258 0 Cash flow before divide nd 5,105 1,591 Inv esti ng activities (2,125) (2,557)Issue of warra nts and( con vertible loa n 0 46 0 46 [ dividend paid: Ordi nary (889) (800) (889) (800)Extra (3,110) 0 (3,110) 0 Change in financial liabilities 2,521 0Financing activities (1,478) (754)Curre ncy effects (17) (111) Excha nge rate effects (17) (111)Change in net financial liability 1,089 726 Change in cash andmarketable securities 215 726 Closi ng liquid funds 1,456 1,241Finan cial receivables 3,395 0Finan cial liabilities (6,905) (4,384)N det finan cial liability (2,054) (3,143) Cash and marketablesecurities:Opening liquid funds 1,241 1,636 Beg inning of period 1,241 1,636Change in liquid funds 235 (463)Curre ncy effects (20) 681,456 1,241 End of period 1,456 1,241Adva ntages: (1) The separate display of pre-interest and pre-tax cashflows permits a comparison across companies with differe nt capital structures and tax regimes.(2) Detailed disclosure of inv estme nt cash flows(acquisiti on and other) may facilitate an alysis of free cash flows.Differences between U.S. and IAS GAAP (see text page 98):? IAS GAAP is permissive regarding the classification ofin terest and divide nds received, in terest paid, and divide nds paid: these cash flows may be reportedeither as components of CFO or CFI (interest and divide nds received) and CFF (in terest and divide nds paid). Roche classifies in terest and divide nds received as CFI and in terest and divide nds paid as CFF.? Bank overdrafts may be reported as components of cash and cash equivale nts in IASGAAP; the cha nge in bankoverdrafts would not be reported as part of the stateme nt of cash flows. U.S. GAAP requires their classificati on as liabilities and therefore, ascomp onents of financing cash flows. Roche foot note 24 in dicates that overdrafts are reported asshort-term debt but is unclear as to how changes are reported in the cash flow stateme nt.? Companies using IAS GAAP and the direct method are not required to report the recon ciliati on from net in come to CFO.Cash flow stateme nt on page 18.Note that conversion to S F A S 95 results in only a small differeneein CFO as theclassificationdifferenceslargely balanee. However both CFF and (especially) quite different (both level and tren d). differenee is that the large 2000 investment in securities is show n as a CFI outflow un der IAS 7 but an in crease in cash and marketable securities un der SFAS 95inv estme nts would be con sidered cash equivale nts.7. c. (con ti nued from page 15)8.{M}a.b.CFIareThe major marketable assu mingcon sideredthat the marketable cash equivalents under securities would be US GAAP. Roche foot note 19 contains securities, gen eralbut notin formatio n about its marketable eno ugh detail to determ ine whichb. Roche cash flow stateme nt: IAS and US GAAP 1999 2000Amoun ts in CHF Millio ns IAS 7 SFAS 95 IAS 7SFAS 95 Operating profit* 6,421 6,421 7,131 7,131Depreciation and amortization 2,453 2,453 2,848 2,848 EBITDA 8,874 N.R. 9,979 N.R.Genen tech tran sacti ons (1,550) (1,550) (3,791) (3,791)Other non-cash tran sacti ons 619 619 (90) (90)Other (3,598) (3,598) (2,549) (2,549)In terest paid (686) (902)In terest and divide nds received 459 743n crease in work ing capital (2,618) (2,618) 367 367 Cash from operatio ns 1,727 1,500 3,916 3,757Financing tran sact ions 541 541 (801) (801) n terest and divide nds paid (1,436) (1,737)Divide nds paid - (750) - (835) Cash from financing activities (895) (209) (2,538) (1,636)Capital expe nditures, inv estme nts and divestitures (906) (906) 1,921 1,921 n terest and divide nds received 459 - 743Change in marketable securities (420) -(3,496) -Cash from inv est ing activities (867) (906) (832) 1,921 Net effect of curre ncy tran slatio n on cash 103 103 (36) (36)In crease (decrease) in cash 68 510 In crease (decrease) in cash and mkt. secs. 488 4,006Note: Row head ings that are right justified apply to SFAS 96 amoun ts."Actually funds from operati onsN.R. Not required by US GAAP, but sometimes disclosedAdva ntage: IAS recomme nds separate disclosure outflows for maintenance expe nditures andexpe nditures for growth; whe n available thatsig nifica nt ben efit.it is impossible to determ ined whether cha nges in operating assets andliabilities (e.g. inventory) are due to operati ng or other factors.9. {L}The cash flow stateme nt shows a steady deteriorati on in CFO;albeit CFO rema ins positive. In come (before extraordi naryDisadva ntages:⑴for the treatment in terest paid, Available alter natives and divide nds received, paid (see answer to part a) may distort CFF and hamper comparis ons with compa nies using USof interestand divide nds CFO, CFI, andGAAP or (for companies using differe nt alter natives. For compa nies using the direct recon ciliati on from net in come toIAS GAAP)method, CFO is notchoos ingwhe n report the edc.of cash capital can be aitems) on the other hand in creases steadily at approximately8%-10% per year.To expla in the discrepa ncy betwee n the patter n of in come andCFO, we first compute the direct method cash flow statement and then compare the cash flow comp onents with their in comestateme nt coun terparts.The (abbreviated) cash flow stateme nt un der the direct method is prese nted below:Years En ded December 311992 1993 1994Cash from operati ng activities:Collecti ons from customers $2,119,563 $2,420,961 $ 2,744,159Payme nts for mercha ndise (1,502,414) (1,742,149) (2,064,815)1 Payme nts for SG&A (453,449) (523,474) (601,575)In terest paid (37,883) (33,367) (33,948)Taxes paid (12,414) (22,989) (8,408 )1 Other (plug) (13,263) (247) (4,619 )$ 100,140 $ 98,735 $ 30,794Cash for inv esti ng activities:Capital expe nditures (48,878) (110,534) (90,009) Acquisiti on of leaseholds (30,602) (21,894) (8,025 )$ (85,480) $ (132,428) $ (98,034)Cash for financing activities:Lon g-term borrow ings (3,276) (23,831) (19,432) Revolvi ng credit borrow ings 70,2431 Proceeds from sale of stock, 1,995 54,460 1,05( 0opti ons and warra nts$ (1,281) $ 30,629 $ 51,861Net cha nge in cash $ 13,379 $ (3,064) $ (15,379)The required calculations for the operating items are presentedin Exhibit 3S-2 on page 21. The last item “other ” is the plugamount used to arrive at the CFO prese nted in the in direct cashflow statement (Exhibit 3P-4).Exhibit 3S-2Worksheet for Operati ng Items for Direct Method SoCFis prese nted below:1992 1993 1994 %cha nge1992-93 %cha nge c1993-94%change1992-94Sales 2 127 684 2 414 124 2 748 634 13 5% 13 9% 29.2% coCash collecti ons2,119,563 2,420,961 2,744,159 14.2% 13.3% 29.5% Collectio ns/Sales 99.61% 100.28% 99.84%COGS (1,527,731) (1,742,276) (1,975,332) 14.0% 13.4% 29.3% Payme nts to (1,502,414) (1,742,149) (2,064,815)suppliers 16.0% 18.5% 37.4% Payme nts/COGS 98.34% 99.99% 104.53%SG&A expe nse (458,804) (520,685) (605,538) 13.5% 16.3% 32.0% Payme nts for SG&A (453,449) (523,474) (601,575) 15.4% 14.9% 32.7%Credit and collect ions do not seem to be resp on sible for the deteriorati on in CFO. A comparis on of cash collect ions with sales in dicates that collecti ons in creased at aslightly faster pace tha n sales. The collectio ns/sales ratio in creased from 99.61% in 1992 to 99.84% in 1994.Inven tory, however, is ano ther matter. Payme nts for inven toryin creased by 37% whereas COGS in creased by only 29%. This isindicative of inventory being bought and paid for but not beingsold. The proporti on of payme nts to COGS in creased accordi nglyfrom 98.3% to 104.5% in two years. This 6% in crease tran slates (based on COGS of close to $2,000,000) to an in creased annual cash requireme nt of $120,000.Thus, the first cause of Radloc' s problems seems to be inven tories. Its in come may be overstated as inven tory may have to be written down if it cannot be sold. Even if inventory is eve ntually sold and the purchases now being made now are ableto satisfy future growth, the firm may still face liquidity problems as it requires cash to purchase (and carry) the new inven tory.However, as CFO is still positive the firm may still be a good can didate for credit.。
- 1、下载文档前请自行甄别文档内容的完整性,平台不提供额外的编辑、内容补充、找答案等附加服务。
- 2、"仅部分预览"的文档,不可在线预览部分如存在完整性等问题,可反馈申请退款(可完整预览的文档不适用该条件!)。
- 3、如文档侵犯您的权益,请联系客服反馈,我们会尽快为您处理(人工客服工作时间:9:00-18:30)。
Chapter 3 - SolutionsOverview:Problem Length Problem #’s{S} 1, 3{M} 2, 7, 8, 12, 13{L} 4 - 6, 9 - 11, 14, 151.{S}a.Palomba Pizza StoresStatement of Cash Flowsb. Cash Flow from Operations (CFO) measures the cashgenerating ability of operations, in addition toprofitability. If used as a measure of performance, CFOis less subject to distortion than net income. Analystsuse the CFO as a check on the quality of reportedearnings, although it is not a substitute for netincome. Companies with high net income and low CFO maybe using overly aggressive income recognitiontechniques. The ability of a firm to generate cash fromoperations on a consistent basis is one indication ofthe financial health of the firm. Analysts search fortrends in CFO to indicate future cash conditions andpotential liquidity or solvency problems.Cash Flow from Investing Activities (CFI) reports how the firm is investing its excess cash. The analyst must consider the ability of the firm to continue to grow and CFI is a good indication of the attitude of management in this area. This component of total cash flow includes the capital expenditures made by management to maintain and expand productive capacity.Decreasing CFI may be a forecast of slower future growth.Cash Flow from Financing (CFF) indicates the sources of financing for the firm. For firms that require external sources of financing (either borrowing or equity financing) it communicates management's preferences regarding financial leverage. Debt financing indicates future cash requirements for principal and interest payments. Equity financing will cause future earnings per share dilution.For firms whose operating cash flow exceeds investment needs, CFF indicates whether that excess is used to repay debt, pay (or increase) cash dividends, or repurchase outstanding shares.c. Cash payments for interest should be classified as CFFfor purposes of analysis. This classification separates the effect of financial leverage decisions from operating results. It also facilitates the comparison of Palomba with other firms whose financial leverage differs.d. The change in cash has no analytic significance. Thechange in cash (and hence, the cash balance at the end of the year) is a product of management decisions regarding financing. For example, the firm can show a large cash balance by drawing on bank lines just prior to year end.e. andf.There are a number of definitions of free cash flows.In the text, free cash flow is defined as cash from operations less the amount of capital expenditures required to maintain the firm’s current productive capacity. This definition requires the exclusion of costs of growth and acquisitions. However, few firms provide separate disclosures of expenditures incurred to maintain productive capacity. Capital costs of acquisitions may be obtained from proxy statements and other disclosures of acquisitions (See Chapter 14).In the finance literature, free cash flows available to equity holders are often measured as cash from operations less capital expenditures. Interest paid isa deduction when computing cash from operations as itis paid to creditors. Palomba’s free cash flow available to equity holders is calculated as follows:Net cash flow from operating activities less net cash for investing activities:$110,000 - $6,000 = $104,000The investment activities disclosed in the problem do not indicate any acquisitions.Another definition of free cash flows, which focuses on free cash flow available to all providers of capital, would exclude payments for interest ($10,000 in this case) and debt. Thus, Palomba’s free cash flow available to all providers of capital would be $114,000.1 Sales - bad debt expense - increase in net receivablesc. The bad debt provision does not seem to be adequate.From 1997 - 2001 sales increased by approximately 40%, while net receivables more than doubled, indicating that collections have been lagging. The ratios calculated in part b also indicate the problem. While bad debt expense has remained fairly constant at 5% of sales over the 5 year period, net receivables as a percentage of sales have increased from 29% to 49%;cash collections relative to sales have declined. Other possible explanations for these data are that stated payment terms have lengthened or that Stengel has allowed customers to delay payment for competitive reasons.3.{S}Niagara CompanyStatement of Cash Flows 20011 Can also be used to calculate cash inputs, decreasing that outflow to $645 while increasing cash expensesto $100.3-44.{L}a.G Company1 Note that these two items cannot be calculated separately from theinformation available.b.M CompanyNote: This is not a true receipts and disbursements schedule as it shows certain amounts (e.g., debt) on a net basis rather than gross. Such schedules (and cash flow statements) prepared from published data can only show some amounts net, unless supplementary data are available.c. The cash flow statements are presented with the incomestatement for comparison purposes in answering Part d.Note: 2000 COGS and operating expense are combined as there is insufficient information to separate them.d. Both companies are credit risks. Although both areprofitable, their CFO is increasingly negative. If current trends continue they face possible insolvency.However, before rejecting both loans outright, it is important to know whether CFO and income differ because the companies are doing poorly or because they are growing too fast.Both companies increased sales over the 5 year period;Company M by 50%, Company G by more than 300%. Are these sales real (will cash collections materialize)?If they are "growing too fast," it may be advisable to make the loan but also to force the company to curtail its growth until CFO catches up. One way to verify whether the gap is the result of sales to poor credit risks is to check if the growth in receivables is "proportional" to the sales growth. Similar checks can be made for the growth in inventories and payables. In this case, the inventory of M company has doubled from 1996 to 2000 while COGS increased by only 56%. The inventory increase would be one area to investigate further.There is a significant difference in the investment pattern of the two companies. Company M has made purchases of PPE each year, while Company G has made little net investment in PPE over the period. Yet Company G has grown much faster. Does this reflect the nature of the business (Company G is much less capital intensive) or has Company G used off balance sheet financing techniques?The cash from financing patterns of the two companies also differ. Both tripled their total debt over the period and increased the ratio of total debt to equity.Given Company M's slower growth (in sales and equity), its debt burden has grown much more rapidly. Despite this, Company M has continued to pay dividends and repurchase stock. Company G has not paid dividends and has issued new equity. These two factors account for its larger increase in equity from 1996 to 2000.Based only on the financial data provided, G looks like the better credit risk. Its sales and income are growing rapidly, while M's income is stable to declining on modestly growing sales. Unless further investigation changes the insights discussed here, you should prefer to lend to Company G.5.{L}a. (i)Statement of Cash Flows - Indirect MethodCash from operations:Net income $1,080Add noncash expense: depreciation 600 Add/Subtract changes in working capital:Accounts receivable (150)Inventory (200)Accruals 80Accounts payable 120 (150)$1,530 Cash from investing:Capital expenditures 1,150Cash from financing:Short term borrowing 550 Long-term repayment (398) Dividends (432)$(280) Net change in cash $ 100The worksheet to create the cash flow statement is presented above. Each balance sheet change (other than cash) is accounted for and matched with its corresponding activity. As a last check, the net income and the add-backs of non-cash items are balanced and “closed” to their respective accounts (PP&E and retained earnings) providing the amounts of capital expenditures and dividends.a. (ii) Statement of Cash Flows - Direct MethodCash from Operations:Cash collections $9,850Cash payments for merchandise (6,080)Cash paid for SG&A (920)Cash paid for interest (600)Cash paid for taxes (720)$1,530 Cash for Investing Activities:Capital expenditures (1,150) Cash for Financing Activities:Short-term borrowing 550Long-term debt repayment ( 398)Dividends ( 432)$( 280) Net Change in Cash $ 100The worksheet to create the cash flow statement is presented below. Each balance sheet change (other than cash) is accounted for and matched with its corresponding activity. Furthermore the operating account changes are matched to their corresponding income statement item. As a last check, the net income is balanced and “closed” to retained earnings providing the amount of dividends.Note that there is no difference between the indirect and direct methods in the cash flow statement and in the worksheet for cash for investing and financing activities,6.{L}a. Exhibit 3P-3 does not provide the (changes in the)individual components that make up the changes inworking capital. As such, to create the direct methodcash flow statement, we must obtain the informationdirectly from the balance sheet. This procedure doesnot necessarily yield the same cash flow componentsusing the direct method as those provided by thecompany in its indirect method calculations.Differences may arise when1.there are acquisitions/divestments2.there are foreign exchange adjustments3.the firm aggregates or classifies investingaccruals together with operating ones.In this case, the differences are minimal as indicated below. (The calculations required for the direct method cash flow statement are presented in Exhibit 3S-1 along with the assumptions used to generate the statement)* Assumed change in interest payable to conform to interest paid. ** From the indirect methodAs noted in Box 3-2, from 1996 to 2000, the company generated free cash flow (CFO less net capital expenditures) of $1.5 million, during the first six months the A. M. Castle added another $309 thousand. However, Box 3-2 also showed that over the five-year period, Castle paid nearly $50 million in dividends and borrowed nearly $130 million to finance its investments and acquisitions. This trend continued in the first six months of 2001 during which the firm borrowed an additional $4.664 million to help pay its dividends and meet capital expenditure needs.Cash generated from operations from 1996 through the end of the first 6 months of 2001 was $76 million but the company spent $154 million to replace productive capacity and for investments and acquisitions. When free cash flows is calculated on this basis (i.e. CFO –CFI) there is a shortfall of $78 million. This shortfall as well as dividend payments were financed by borrowing over the same period.The inability to meet its capital and dividend needs from operations clearly indicated that either the dividend would have to be reduced or the company would not be able to remain competitive and/or grow as needed.7.{M}a.•The Swedish GAAP cash flow statements (CFS) begin with pretax and pre-financial items whereas the U.S. GAAPCFS show adjustments to net income.•The net financial items aggregate interest costs and interest income from various sources (includingdividends and interest from associated companies andother interest income) .•Swedish GAAP CFS aggregate all changes in working capital; U.S. GAAP CFS provide detailed disclosure ofthe operating changes in components of working capital;non-operating changes are reported as components ofinvesting activities.•Swedish GAAP combines cash and cash equivalents, financial receivables (primarily receivables fromassociated companies) and financial liabilities(current and long-term debt) in a measure called netfinancial assets or liabilities. SFAS 95 shows thechange in cash and cash equivalents with changes infinancial receivables reported as components of CFO andCFI. Changes in current and long-term debt are reportedin cash from financing activities.b.The cash flow statement is shown on page 16.c. Disadvantages:(1)Aggregation of all changes in operating or workingcapital accounts combines cash consequences ofoperating and investing activities. As noted inthe chapter, investing activities tend to distortcash flow from operations.(2)The use of net financial items tends to obscuresoperating, investing, and financing activities.Although disclosure is available to facilitate itscalculation, no separate disclosure of actual cashoutflow for interest (financing) costs isprovided.(3)The inclusion of financial liabilities (borrowingand repayment) and financial receivables in liquidfunds distorts cash flows from both investing andfinancing activities. This approach also hampersthe analysis of free cash flows discussed in thechapter. It is also unclear what basis was used bythe company to allocate a portion of the financialreceivables to operating activities and theremainder to the net financial position category.[Part c is continued on page 17]3-167. c. (continued from page 15)Advantages:(1)The separate display of pre-interest and pre-taxcash flows permits a comparison across companieswith different capital structures and tax regimes.(2)Detailed disclosure of investment cash flows(acquisition and other) may facilitate analysis offree cash flows.8.{M}a. Differences between U.S. and IAS GAAP (see text page98):•IAS GAAP is permissive regarding the classification of interest and dividends received,interest paid, and dividends paid: these cashflows may be reported either as components of CFOor CFI (interest and dividends received) and CFF(interest and dividends paid). Roche classifiesinterest and dividends received as CFI andinterest and dividends paid as CFF.•Bank overdrafts may be reported as components of cash and cash equivalents in IAS GAAP; the changein bank overdrafts would not be reported as partof the statement of cash flows. U.S. GAAP requirestheir classification as liabilities and therefore,as components of financing cash flows. Rochefootnote 24 indicates that overdrafts are reportedas short-term debt but is unclear as to howchanges are reported in the cash flow statement.•Companies using IAS GAAP and the direct method are not required to report the reconciliation from netincome to CFO.b.Cash flow statement on page 18.Note that conversion to SFAS 95 results in only a smalldifference in CFO as the classification differenceslargely balance. However both CFF and (especially) CFIare quite different (both level and trend). The majordifference is that the large 2000 investment inmarketable securities is shown as a CFI outflow underIAS 7 but an increase in cash and marketable securitiesunder SFAS 95 assuming that the marketable securitieswould be considered cash equivalents under US GAAP.Roche footnote 19 contains general information aboutits marketable securities, but not enough detail todetermine which investments would be considered cashequivalents.3-18c. Advantage: IAS recommends separate disclosure of cashoutflows for maintenance expenditures and capital expenditures for growth; when available that can be a significant benefit.Disadvantages:(1)Available alternatives for the treatment ofinterest and dividends received, interest paid,and dividends paid (see answer to part a) maydistort CFO, CFI, and CFF and hamper comparisonswith companies using US GAAP or (for companiesusing IAS GAAP) choosing different alternatives.(2)For companies using the direct method, when thereconciliation from net income to CFO is notreported it is impossible to determined whetherchanges in operating assets and liabilities (e.g.inventory) are due to operating or other factors.9.{L}The cash flow statement shows a steady deterioration in CFO;albeit CFO remains positive. Income (before extraordinary items) on the other hand increases steadily at approximately 8%-10% per year.To explain the discrepancy between the pattern of income and CFO, we first compute the direct method cash flow statement and then compare the cash flow components with their income statement counterparts.The (abbreviated) cash flow statement under the direct method is presented below:The required calculations for the operating items are presented in Exhibit 3S-2 on page 21. The last item “other”is the plug amount used to arrive at the CFO presented in the indirect cash flow statement (Exhibit 3P-4).Exhibit 3S-2Worksheet for Operating Items for Direct Method SoCFThe comparison of the cash flow and income statement components is presented below:Credit and collections do not seem to be responsible for the deterioration in CFO. A comparison of cash collections with sales indicates that collections increased at a slightly faster pace than sales. The collections/sales ratio increased from 99.61% in 1992 to 99.84% in 1994.Inventory, however, is another matter. Payments for inventory increased by 37% whereas COGS increased by only 29%. This is indicative of inventory being bought and paid for but not being sold. The proportion of payments to COGS increased accordingly from 98.3% to 104.5% in two years. This 6% increase translates (based on COGS of close to $2,000,000) to an increased annual cash requirement of $120,000.Thus, the first cause of Radloc’s problems seems to be inventories. Its income may be overstated as inventory may have to be written down if it cannot be sold. Even if inventory is eventually sold and the purchases now being made now are able to satisfy future growth, the firm may still face liquidity problems as it requires cash to purchase (and carry) the new inventory.However, as CFO is still positive the firm may still be a good candidate for credit.Further insights as to the impact of growth can be seen if we compare free cash flow (CFO - CFI) with income and CFO.(100,000)(50,000)-50,000100,000150,000Although income rises, CFO and free cash flow fall. CFO exceeds income in 1992 and 1993 as the noncash depreciation addback increases CFO relative to income. By 1994, however, CFO, (although positive) falls below income. This indicates that the firm may have problems in covering the replacement of current productive capacity.Free cash flow is negative in 1993 and 1994 and “barely” positive in 1992. This indicates that the firm’s growth (in addition to inventory) requires cash that Radloc cannot supply internally.Where did the cash come from?In 1993, it met its cash requirements by issuing stock; in 1994 the firm’s short term debt increased considerably as it drew down its revolving credit lines.Thus, the loan should not be granted as the firm seems to be facing an increasing liquidity crisis..Note : Radloc is an anagram for Caldor, a chain of discount stores. The data in Exhibit 3P-4 were taken from Caldor’s published financial statements. Caldor filed for Chapter 11 bankruptcy soon after the 1994 statements were published.10.{L}a. This part of the question requires an understanding ofSFAS 95, which governs the preparation of the Statementof Cash Flows. SFAS 95 permits use of either the director indirect method. As an initial step under eithermethod, the effect of the Kraft acquisition must beremoved as follows:The transactional analysis worksheet and statement ofcash flows are shown on pages 25 and 26 respectively.b. The simplest calculation would be operating cash flowless capital expenditures: $5,205 - $980 = $4,225million. But many variations are possible.The more important part of the question is theconnection between free cash flow and future earningsand financial condition. Possible uses of free cashflow include:1) Repayment of debt resulting in lower interest costand higher earnings. This also reduces debt ratiosand improves interest coverage, possibly leadingto higher debt ratings.2) Repurchase of equity may raise earnings per shareand (if repurchased below stated book value orreal value per share) increase these.3) Acquisitions (such as Kraft) that may providefuture growth, better diversification, lower risk,etc.4) Expenditures to fund internal growth throughcapital spending, research and development, newproduct costs, etc.* The net issuance or repurchase of equity is computed by reconciling the stockholders' equity account:Reconciliation of Stockholders' Equity12/31/87 balance $ 6,8231988 net income 2,337Dividends declared (941)Total $ 8,21912/31/88 balance (7,679)Decrease in stockholders' equity (repurchase) $ 540Philip Morris Companies, Inc. Worksheet for Statement of Cash FlowsIndirect Methodc. If the acquired inventories and receivables are soldthe proceeds will be reported as cash flow fromoperations (CFO). As their acquisition was reported ascash used for investment, CFO will be inflated. Thiswill occur if Kraft reduces its required level ofinventories and receivables because of operatingchanges (such as changes in product lines or creditterms) or the use of financing techniques that removethese assets from the balance sheet.11.{L}a. The first step is to match the items from the indirectcash flow statement with their corresponding items onthe income statement as below.1* It is possible the pension credit may also be included in “cost of products sold.”1 As a result of this matching, depreciation expense and restructuring expense offset and are eliminated from the direct method cash flow statement.* In Note H, Westvaco provides (as required by SFAS 95) the amount of interest and income tax paid. Our calculations must be adjusted to reconcile with these amounts. We have applied the adjustment to cash expenses, although it is possible that it should be applied to cash paid for inputs** Other income of $29 from income statement less (from indirect cash flow statement) gains on asset sales $18, plus currency losses of $3.6 and “other” of $3.8. [29 – 18 + 3.6 + 3.8 = 18)b. There are limited insights available from a singleyear’s direct method cash flow statement. However, we can compare some cash flow relationships with their income statement analogues:COGS to sales 70.3Cash inputs to cash collections 69.5%Selling, research, and admin. expense to sales 8.3% Cash expenses to cash collections 11.8% The second set of ratios shows the more significant difference. Westvaco’s cash expenses as a % of cash collections are much higher than the income statement relationships. The explanation (see chapter 12) is that Westvaco had a large noncash pension credit, which reduced net expenses.c. The company increased CFO (from $391 million in 1997 to$583 million in 2000) and substantially reduced its capital expenditures (see note H) from $621 million in 1997 to $229 million in 1999, generating the free cash flow needed to make acquisitions. Additional data used in Figure 3-1 tells the same story:FCF2 = CFO – CFI (where CFI = capital expenditures plus cash flows for acquisitions and from divestitures)The company borrowed funds in 1997 but reduced that debt in 1998 and 1999; outflows for dividends are lower but not significantly so. Thus, Westvaco used higher CFO and borrowing, combined with lower capital expenditures, to finance its 2000 acquisitions.12.{M}a. Hertz Corp. ($ millions)b.As reported, cash flow from operations shows steady improvement over the period 1989 - 1991, changing from a negative to a positive amount. After adjustment, the trend is eliminated; cash flow from operations is lower in 1991 than in either 1989 or 1990. The improvement in reported cash flow from operations was the result of reducing Hertz's net investment in rental equipment.d.Reported cash flow for investing shows little change over the three-year period. After reclassification of equipment purchases and sales, cash flow for investing drops by more than half in 1991. After reclassification it reflects the sharp drop in net car and truck purchases in that year.e.Free cash flow can be defined as cash flow from operations less investment required to maintain productive capacity. Ifwe assume that Hertz's investments are solely to maintain existing capacity, then free cash flow equals cash flow from operations less cash flow for investing:Note that reclassification of purchases and sales of revenue equipment has no effect on free cash flow:Thus by defining free cash flow in a manner which subtracts out all expenditures required to maintain the operating capacity of the firm, whether capitalized or not and regardless of classification, the effects of accounting and reporting differences can be overcome.This solution requires, of course, the identification of the amounts of such items.f. When equipment is purchased, the full amount isreported as an operating cash outflow. For leased equipment, only the periodic lease payments are reported as operating cash outflows. Thus, for Hertz, leasing increases reported cash flow from operations. g. When equipment purchases are classified as investingcash flows, then leasing reduces operating cash flows relative to purchases. That is because the outflow connected with purchases (or any other capitalized expenditure) is never classified as an operating outflow. [See Chapter 11 for a detailed analysis of this issue.]13.{M}a.Assumptions:1.Subsidies and other revenues are shown as a componentof cash flows from operating activities because theyinclude revenues and cash (subsidies) presumablyreceived from the government. We have assumed (and itappears so from data provided) that this item was notincluded in income (part of funds from operations). assets from consolidation are defined (elsewhere inRepsol’s financial statements –not provided in theproblem) as non-cash items resulting from accountingdifferences within the consolidated group. These areshown as a component of cash from operating activitiesto offset any items included in income.Note that Repsol’s statement of sources and applications of funds does not show the change in cash.The net change in cash in the table above reflects all changes except the effect of currency changes. If we separate out the actual change in cash and equivalents(65 in 1998, 297 in 1999) we can produce a statementthat is similar to the US GAAP format:b. A sources and uses statement does not recognizedifferences among operating, investing, and financing activities. SFAS 95 requires grouping of similar transactions in these three categories. Separate disclosure of the cash consequences of operating activities facilitates (1) an evaluation of the earnings and cash generating ability of the firm, (2) the quality of revenue and expense recognition principles used to prepare the financial statements, and (3) the computation of free cash flows.Separate disclosure of investing activities permits an assessment of capital expenditures, growth, and investments in other entities. Information about financing activities shows how the company finances its capital needs and dividend payments. Although the sources and uses format provides these data (and in gross form as required by SFAS 95) for investing and financing activities, it does not provide the disclosure by category; In contrast, SFAS 95 facilitates the analysis of free cash flows and other analytical measures.c.Separate disclosure of the components of (1) the changein working capital accounts, (2) non-cash income and expense, (3) net assets from consolidation, (4) whether any restructuring charges are included and where they were reported, and (5) debt repaid or reclassified would be useful.。