Phasor measurement Unit—s for system diagnosis and load identification in Australia
PMU的原理及在电厂的应用
20世纪90年代初,基于全球定位系统(G lobal Positioning System,GPS)的相量测量单元(Phasor Measurement Unit,PMU)的成功研制,标志着同步相量(synchrophasor)技术的诞生。
然而由于当时商业GPS技术条件的限制以及缺少高速通信的网络,PMU直到最近几年才在电力系统中的广泛应用。
它的出现促进了大电网广域测量/监视系统(Wide-Area Measurement/ Monitoring System,WAMS)的形成和发展。
我国电力发展趋势逐年实现全国电网互联,随着电网的规模不断扩大,单台机组容量不断增大,电网的动态特性变的非常复杂。
为了进一步加强电力系统调度对电力系统的动态稳定监控和分析的能力,需要在重要的变电站和电厂安装同步相量测量装置,构建电力系统实时动态检测系统,并通过调度中心对电力系统的动态过程进行监测和分析。
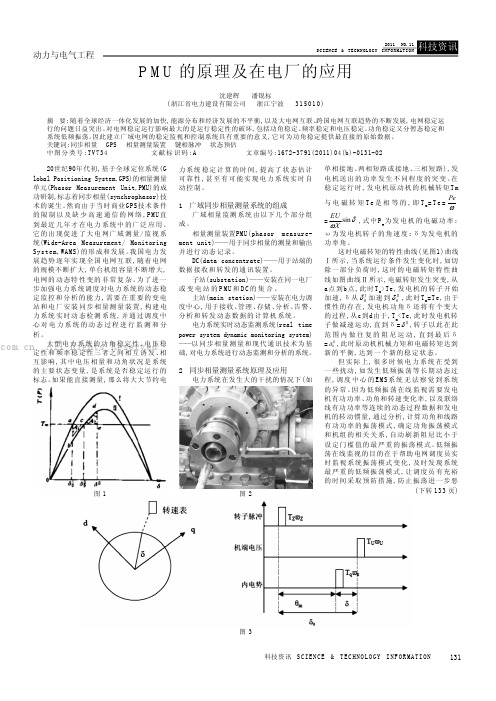
大型电力系统的功角稳定性、电压稳定性和频率稳定性三者之间相互诱发、相互影响,其中电压相量和功角状况是系统的主要状态变量,是系统是否稳定运行的标志。
如果能直接测量,那么将大大节约电力系统稳定计算的时间,提高了状态估计可靠性,甚至有可能实现电力系统实时自动控制。
1 广域同步相量测量系统的组成广域相量监测系统由以下几个部分组成。
相量测量装置PMU(phasor measure-ment unit)——用于同步相量的测量和输出并进行动态记录。
DC(data concentrate)——用于站端的数据接收和转发的通讯装置。
子站(substation)——安装在同一电厂或变电站的P M U 和D C 的集合。
主站(main station)——安装在电力调度中心,用于接收、管理、存储、分析、告警、分析和转发动态数据的计算机系统。
电力系统实时动态监测系统(real time power system dynamic monitoring system)——以同步相量测量和现代通讯技术为基础,对电力系统进行动态监测和分析的系统。
PMU同步相量测量系统简介

EMS系统侧重于监测系统稳态运行,测量周期通常是秒级, 而且不带时标,不同地点之间缺乏准确的共同时间标记。
WAMS介绍
继电保护及故障录波数据的采样频率都在几千HZ以上,带 有时标,但是只在发生故障时采集故障点附近的数据,记录数 据只是局部,并且待续时间短,通常在数秒之内,难以用于对 全系统动态行为的监视和分析。
✓ 发电机功角的计算
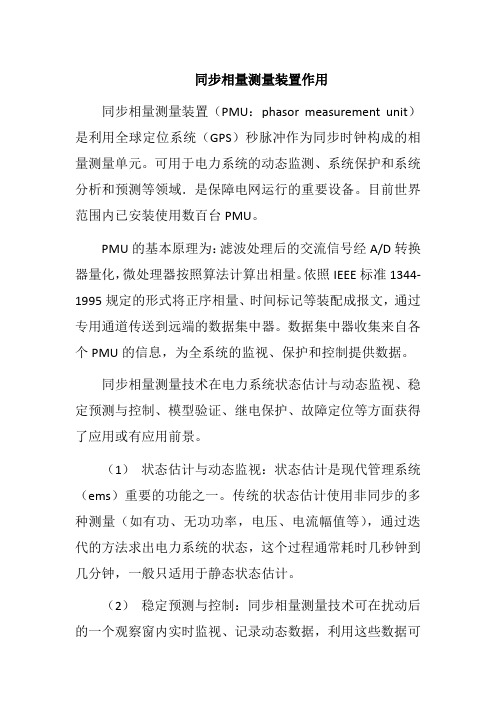
一般测量发电机功角的方法有3种: ①利用发电厂或变电站测量的电压、电流和功率计算出功角; ②利用键相脉冲检测转子的位置; ③利用转速信号计算功角。
相量概念
正弦信号:
xt 2X sint
采用相量表示为:
X = X e jφ =X cosφ + jX sinφ
相量由两部分组成,即幅值X(有效值)和相位φ,用直角 坐标则表示为实部和虚部。所以相量测量就必须同时测量幅值 和相位。
✓ 对静态稳定监视来说,相角测量将为SCADA系统增加一个新的 数据状态量,加快潮流计算的速度。
发电机功角测量
✓ 功角是指发电机空载电势相量Eq与机端电压U 之间的夹角。同步 发电机并网运行后,其功角δ 是用来观察和判断该机组和电力系统并 列运行稳定性的一个很重要的状态量。正常状态发电机功角在30度左 右运行,当功角在90度时是极不稳定的状态,稍有波动过一点就不能 再同步了。
GD GD GD GD T2 U3
HELP ALPHA
V0 W.X YZ SHIFT
PMU1
PMU2
➢ 利用GPS的秒脉冲作为统一的时间参考点,测得输电线两端的
电压相量为 U11,U22, 1 2
➢ 两地相角差δ实际上是指在同一时刻两个节点正序电压的相角 差,它是系统运行的重要状态变量之一。利用这个角度,可以得 知两端电力潮流的方向与大小;相角差的大小也反映了静稳裕度 的大小,它的周期变化就表明系统发生了功率振荡。
智能配电网广域测控系统及其保护控制应用技术

智能配电网广域测控系统是一种基于现代传感器、通信和计算机技术的分布 式控制系统。它通过广泛部署的智能终端设备实时监测配电网的状态,实现对电 网的快速响应和高效控制。智能配电网广域测控系统的结构包括数据采集层、数 据处理层和应用层。
特点:
1、分布式控制:智能配电网广域测控系统采用分布式控制方式,能够实现 对配电网的快速响应和高效控制。
智能配电网广域测控系统及其保护 控制应用技术
ቤተ መጻሕፍቲ ባይዱ
随着电力系统的发展和智能化技术的进步,智能配电网广域测控系统及其保 护控制应用技术已成为研究的热点。本次演示将介绍智能配电网广域测控系统的 概念、结构、特点和应用,以及保护控制应用技术的实现方法和应用案例,最后 对智能调度管理的控制策略进行探讨。
智能配电网广域测控系统
2、实时监测:智能终端设备能够实时监测配电网的状态,从而及时发现和 解决问题。
3、数据共享:系统支持多用户同时访问和共享数据,从而提高决策效率和 管理水平。
3、数据共享:系统支持多用户 同时访问和共享数据,从而提高 决策效率和管理水平。
1、电力调度:智能配电网广域测控系统能够为电力调度提供实时数据支持, 帮助调度员更好地掌控配电网的运行状态。
总之,智能配电网分布式控制技术是实现智能配电网高效运行和优化的关键 所在。通过在多个领域应用分布式控制技术,可以有效地提高智能配电网的整体 性能和能源利用效率,降低能源消耗和碳排放量,推动能源结构的优化和调整。 因此,应当加强对于智能配电网分布式控制技术的研究和应用,为实现绿色、可 持续发展做出积极贡献。
广域控制保护系统的应用包括:
1、快速切除故障:通过对电网中故障的快速识别和切除,减少故障对电网 的影响。
2、防止连锁反应:通过对电网中故障的快速切除,防止故障引发连锁反应, 造成更大范围的停电事故。
基于广域保护系统的距离后备保护整定方案

基于广域保护系统的距离后备保护整定方案谷松林【摘要】电网中发生潮流转移现象后,受影响的输电线路会承受大量的转移负荷,进入过负荷运行状态.距离保护后备段的整定要求躲开线路正常运行时的最小负荷阻抗,因此潮流转移带来的线路过负荷将会对距离保护后备段带来显著影响.针对这一情况,提出了一种能够应对潮流转移情况的距离后备保护整定方案.该方案基于广域保护系统,利用WAMS可测幅值与相角的特点快速计算线路的视在阻抗值.然后根据线路视在阻抗的变化幅度确定线路所承受的转移负荷比例,针对线路不同的过负荷状态进行与之对应的后备保护整定值调整,既防止过负荷线路上的后备保护发生误动,又使后备保护保有正确识别短路故障的能力.最后将整定信息与负荷波动情况上传至调度中心,为调度中心进行负荷控制提供辅助决策,并依据调度中心的决策进一步调整后备保护的整定值,直至线路恢复正常的负荷输送状态.以新英格兰10机39节点系统为样例,采用BPA仿真验证了该方案的有效性.【期刊名称】《电力系统保护与控制》【年(卷),期】2016(044)001【总页数】8页(P40-47)【关键词】潮流转移;过负荷;广域测量系统;距离后备保护【作者】谷松林【作者单位】国网北京经济技术研究院,北京102209【正文语种】中文【中图分类】TM77潮流转移是使电网发生连锁跳闸现象的重要诱因,若不及时采取有效的抑制措施将导致电网发生大停电事故,严重威胁电力系统的安全稳定运行[1-4]。
在此研究方向上国外起步较早,建立了与大停电相关的连锁故障模型,并指出在潮流转移情况下,后备保护的过负荷误动是引发连锁跳闸的重要原因[5-7]。
为解决这一问题,近年来在研究中引入了图论的相关知识,提出了输电断面的概念[8],通过划分输电断面来快速搜索受潮流转移影响的过负荷支路,如文献[9]研究了基于转移潮流灵敏度因子的潮流转移识别方案;文献[10]根据实际电网结构利用图论知识生成有向图,建立送端节点-送电支路邻接表,计算支路开断分布因子,识别受潮流转移影响较大的线路;文献[11]利用图论将电网拓扑图划分为多个广义潮流转移区域,将区域外节点与其相应的区域连接割点等效为虚拟母线,使计算范围从全网简化到过载线路所属的广义潮流转移区域;文献[12]给出了用于评价支路受潮流转移影响程度的过载严重度指标;文献[13]通过预测线路故障时间和概率的方法来识别潮流转移的发生。
广域保护综述

广域保护综述社会的进步和经济的发展对可靠、稳定、高质量的电力供应提出了越来越高的要求,任何一次停电都可能带来巨额的经济损失,严重影响人们的日常生活。
电力工业市场化的逐步推进以及大规模、远距离输电的增加对电力系统安全稳定运行提出了更高的要求。
近年来北美以及世界范围内的几次大停电事故让我们认识到:事故的发生并不是因为继电保护和安全自动装置误动作,恰恰相反,他们都能正确动作,仍然不能避免大规模停电事故的发生,其原因就在于保护装置与安全自动装置之间缺乏相应的配合协调,基于本地量的装置难以反映区域电力系统的运行状况。
为适应电力系统发展的需要,解决现有保护、控制系统存在的问题,一种基于网络通信、多点信息综合比较判断的广域保护系统(Wide-AreaProtectionSystem,WAPS)近年来受到国内外学者的广泛关注。
1广域保护的定义及与传统继电保护区别广域保护可定义为:依赖电力系统多点的信息,对故障进行快速、可靠、精确的切除,同时分析故障切除对系统安全稳定运行的影响,并采取相应的控制措施,可提高输电线可用容量或系统可靠性,同时实现继电保护和自动控制功能的系统。
目前提出的广域保护系统可以分为2类:一类是利用广域信息实现安全监视、控制、稳定边界计算及状态估计等功能,其侧重点在广域信息的利用和安全功能的实现;另一类则是利用广域信息完成继电保护功能。
广域保护在电网保护控制中是基本定位于传统保护及SCADA/EMS之间的系统保护控制手段,国际大电网会议将广域保护的功能及控制手段等进行了定义,其动作时间范围在100ms~100S之问,如图1所示。
传统的继电保护主要集中于元件保护,以线路、母线、变压器、发电机和电动机等为保护对象。
传统保护以切除被保护元件内部故障为己任,主要通过开关动作来实现故障隔离。
各电力设备的主保护相互独立,不顾及故障元件被切除后,剩余电力系统中的潮流转移引起的后果。
比如故障元件被保护装置正确切除或正常元件被保护装置误切除后,由于功率的转移引起相邻电力元件的过载,导致过载保护动作等,这是传统继电保护的固有弊端。
同步相量测量装置作用
同步相量测量装置作用同步相量测量装置(PMU:phasor measurement unit)是利用全球定位系统(GPS)秒脉冲作为同步时钟构成的相量测量单元。
可用于电力系统的动态监测、系统保护和系统分析和预测等领域.是保障电网运行的重要设备。
目前世界范围内已安装使用数百台PMU。
PMU的基本原理为:滤波处理后的交流信号经A/D转换器量化,微处理器按照算法计算出相量。
依照IEEE标准1344-1995规定的形式将正序相量、时间标记等装配成报文,通过专用通道传送到远端的数据集中器。
数据集中器收集来自各个PMU的信息,为全系统的监视、保护和控制提供数据。
同步相量测量技术在电力系统状态估计与动态监视、稳定预测与控制、模型验证、继电保护、故障定位等方面获得了应用或有应用前景。
(1)状态估计与动态监视:状态估计是现代管理系统(ems)重要的功能之一。
传统的状态估计使用非同步的多种测量(如有功、无功功率,电压、电流幅值等),通过迭代的方法求出电力系统的状态,这个过程通常耗时几秒钟到几分钟,一般只适用于静态状态估计。
(2)稳定预测与控制:同步相量测量技术可在扰动后的一个观察窗内实时监视、记录动态数据,利用这些数据可以预测系统的稳定性,并产生相应的控制决策。
基于同步相量测量技术,采用模糊神经元网络进行预测和控制决策,取pmu所提供的发电机转子角度以及由转子角度推算出的速度(变化率)等作为神经元网络的输入,输出对应稳定、不稳定。
在弱节点处安装pmu,可以观测电压稳定性。
pss利用pmu所提供的广域相量作为输入,构成全局控制环,可以消去区域间振荡。
(3)模型验证:电力系统的许多运行是在数值仿真的基础上得到的,而仿真程序是否正确在很大程序上取决于所采用的模型。
同步相量测量技术使直接观察扰动后的系统振荡成为可能,比较观察所得的数据与仿真的结果是否一致以验证模型,修正模型直到二者一致。
(4)继电保护和故障定位:同步相量测量技术能提高设备保护、系统保护等各类保护的效率,显着的例子就是自适应失步保护。
南方电网并网机组防功率振荡运行管理规定(试行)

附件:南方电网并网机组防止功率振荡运行管理规定(试行)1总则1.1为指导并规范南方电网并网发电机组的运行管理,提高电网及机组的安全稳定运行水平,防止机组功率振荡,结合南方电力系统的实际运行情况,特制定本规定,请各有关单位严格执行。
1.2本规定适用于南方电网并网发电厂运行管理。
2规范性引用文件下列文件中的条款通过本规定的引用而成为本规定的条款。
凡是注日期的引用文件,其随后所有的修改单(不包括勘误的内容)或修订版均不适用于本规定,然而,鼓励根据本规定达成协议的各方研究是否可使用这些文件的最新版本。
凡是不注日期的引用文件,其最新版本适用于本规定。
DL/T1040-2007 电网运行准则DL/T711-1999 汽轮机调节控制系统试验导则DL/T656-2006 火力发电厂汽轮机控制系统验收测试规程DL/T843-2010 大型汽轮发电机组励磁系统技术条件Q/CSG114003-2012 南方电网同步发电机原动机及调节系统参数测试与建模导则Q/CSG114003-2011 南方电网同步发电机励磁系统参数实测与建模导则Q/CSG110006-2011 南方电网电力系统稳定器(PSS)技术条件Q/CSG114002-2011 南方电网电力系统稳定器整定试验导则Q/CSG110011-2011 南方电网相量测量装置(PMU)技术规范Q/CSG110004 -2012 南方电网自动发电控制(AGC)技术规范国家电力监管委员会22号令电网运行规则南方电监市场[2012]10号文南方区域发电厂并网运行管理实施细则(修订稿)南方电网调[2010]9号文南方电网同步发电机励磁系统、原动机及其调节系统参数实测与建模工作管理规定(2010年版)3术语和定义3.1自动发电控制(Automatic Generation Control,AGC)能量管理系统EMS中的一项重要功能,通过自动控制电厂机组的出力,实现对系统频率和联络线交换功率控制,保障电网安全、稳定、优质、经济运行。
电厂常用系统代号及解释

电厂常用系统代号及解释序号代号英文中文备注1PC power centre动力中心2MCC Motor Control Center电动机控制中心3NCS Networked Control System 网络监控系统4UPS uninterruptible power supply不停电电源5FECS Fuel Evaporative Emission Control System 厂用电监控系统/电气计算机监控管理系统英文不确定6GPS Global Positioning System 全球定位系统7GIS Gas Insulated Switchgear 气体绝缘组合电器设备8AVC automatic voltage control 自动电压控制9AGC Automatic Generation Control 自动发电量控制10EMS Energy management system 能量管理系统11PMU Phasor Measurement Unit同步相量测量装置12SIS Supervisory Information System 厂级监控信息系统13DCS Distributed control system 分散控制系统14SCR Selective Catalytic Reduction 选择性催化还原法脱硝15DAS data acquisition system 数据采集系统16MCS modolation control system 模拟量控制系统17SCS sequence control system顺序控制系统18FSSS furnace safeguard supervisory system锅炉炉膛安全监控系统BMS(burner manageme nt control system)19DEH digital electro-hydraulic control system汽机数据电液调节系统20MEH feedwater pump turbine electr-hydraulic control system 给水泵小汽轮机电液控制系统21METS micro emergency trip system 给水泵汽机紧急跳闸控制22BPC by-pass control system 汽机旁路系统23ETS emergency trip system汽机紧急跳闸系统24TSI turbine supervisory instrumentation汽机监视仪表系统25MTSI micro turbine supervisory instrumentation 给水泵汽机监视仪表系统26AVR Automatic Voltage Regulation 自动电压调节装置27ASS Automatic synchronized system 自动准同期装置28ECS electric control system 厂用电监控系统29FCS Fieldbus Control System 现场总线控制30AGC automatic gain control 自动发电控制、自动增益控制31PCV pressure control valve压力控制阀32OPC overspeed protection control 超速保护控制33RB runback减负荷34APS automatic power plant start up&shut down system 机组自启停系统35PLC programmable logic control system 控制系统36MIS management information system 管理信息系统37DPU Distributed Processing Unit分散处理单元38TDMTesting Data Management/Technical Data Management试验数据管理/技术数据管理注:个人工作过程中整理的,欢迎指正,欢迎给补充意见。
- 1、下载文档前请自行甄别文档内容的完整性,平台不提供额外的编辑、内容补充、找答案等附加服务。
- 2、"仅部分预览"的文档,不可在线预览部分如存在完整性等问题,可反馈申请退款(可完整预览的文档不适用该条件!)。
- 3、如文档侵犯您的权益,请联系客服反馈,我们会尽快为您处理(人工客服工作时间:9:00-18:30)。
Abstract--In 1993 QUT developed phasor measurement andc ommunic ation systems whic h were initially deployed on the Queensland Network. This development and deployment was extended in 2001 to enc ompass the major load c enters in the Australian National Grid. The system has been used for eigenvalues-eigenvector estimation, for diagnosis of major system disturbances and for load identification.Index Terms—Phasor Measurement, Power System Dynamics, Power System identification,I. I NTRODUCTIONHE phasor measurement unit (PMU) system developed by QUT achieves a good performance through high sample rates, precise sampling and most importantly, a high precision in the phase locked loop to the GPS signal. The system of units installed enables live transfer of data across the Australian network, which offers significant benefits for on-line monitoring. The current system transfers up to 3 phasor measuremts at one site with a transfer rate of 10Hz using TCP/IP, and also allows for the local storage of data at both 50Hz and 10Hz sampling rates. Typical hard drive storage provides local storage for 1 year with automatic overwrite as the storage becomes full.Fig 1: Front view of the mobile unitThis work was supported in part by Australian research Council grant with assistance from Powerlink, Transgrid, ElectraNET SA VenCorp.G. Ledwich and P. O’Shea are with the School of Engineering Systems, Queensland University of Technology (e-mail g.ledwich@.au pj.oshea@.au)D. Geddey is with Transgrid (e-mail don.geddey@.au)II. E IGENVECTOR AND EIGENVALUE IDENTIFICATIONIt is critical to obtain reliable and accurate estimates of the eigenvalues and eigenvectors for the dominant modes in the power system. A number of strategies have been used to enhance the quality and reliability of the estimates. These strategies are described in the ensuing paragraphs.The most straightforward way to identify key modes in a power system is to stage brake resistor tests or on-line switching events, and then using Prony analysis of the system response so as to estimate the damping factors and frequencies. Early attempts to use this approach, however, yielded unreliable results because of the poor conditioning of the Prony method. Subsequent use of singular value decomposition in conjunction with Prony analysis improved the conditioning of the method, yielding a corresponding improvement in estimation quality. [7].Regular disruption of power systems via braking resistor tests and staged on-line switching events is problematical. To avert the need for these types of major disruptions, ‘ambient’ testing methods were investigated. During these investigations it was observed that during normal operation of power systems the normal customer driven load changes which stimulate voltage angle changes can be modelled well as the integral of white noise [8]. This led to the further realisation that one could use these load changes in normal power system operation as the ‘test stimulus’ and then used statistical analysis of the power system response to infer the damping and frequencies of the modes of interest. Given that the stimulus was assumed to be integrated white noise, a suitable pre-processing stage for the estimation process was differentiation followed by creation of the autocorrelation function. It is not hard to show that the autocorrelation function so formed contains the dominant modes in the power system, along with some additive noise [1]. It is therefore well suited to analysis with Prony methods enhanced with singular value decomposition [7]. The use of ambient power system data and autocorrelation function techniques for modal parameter estimation has the advantage that long data records can be used with relatively high signal to noise ratio (SNR). One of the problems encountered when using Prony type methods to estimate the parameters of decaying sinusoids isPhasor Measurement Unit’s for system diagnosis and load identification in AustraliaG. Ledwich, Senior Member, IEEE, D. Geddey non member and P. O’Shea, Senior Member, IEEE TCurrent probesGPSAntenna©2008 IEEE.knowing how much of the data record to use. If one uses too little of the data then the estimates have limited accuracy because of the small amount of data; if one uses too much of the data then (because of the decay of the modes) one is using a significant portion of data which has low SNR – as a result the results are unreliable. A partial solution to this problem was provided by analysis at Transgird, who proposed weighting the data with a window which is matched (at least approximately) to the mode of interest. This is tantamount to using a matched filter approach, which is known to provide good noise performance.Because the PMU system has multiple sites measuring the same modes, multisite algorithms were used to gain improved identification. In many cases when there are multiple measurements of the one event (each corrupted by noise), combining the signals will enhance the detection of the signal. The enhancement, however, depends on at least partial de-correlation of the noise across measurement sites as well aslong records, conditions which are not always the case atmultiple sites in interconnected power systems.A key benefit of multi-site is that the relative contribution of the different modes are different at different sites. The approach that has been found most effective in combining the data from multiple sites is to make linear combinations of measurements to enhance the mode of interest. Ideally if we have three measurements of three modes then there is a linear mapping to combine measurements to yield decoupledmeasurements of the modes. In the iterative decoupling of the modes in [3] this approach was shown to yield better resultsthan the methods described in [6] and [7].Another benefit of multisite estimation is that the relative magnitude and phase of the modes in each of the differentmeasurements can be extracted. It has been fortunate that most of the sites chosen have shown a strong response to inter-area measurements and almost no response to localmodes. This supports the contention that the measurement sites represent a reasonable measurement of inter-area nodephasors. This means that the measurements can be useddirectly to form eigenvectors without further processing. One example which illustrates this point was found frommeasurements associated with the joining of Tasmania to mainland Australia with the HVDC link Basslink (see Fig 2). Here there is a single major mode that is clearly seen Fig 3 as a mode at 1Hz (i.e. 6.3 rad/s) as a North-South grouping in thecorresponding vector plot in Fig 4.Fig 2 Locations of generation groups within Tasmania’s networkSpectrum of autocorrelation (Basslink imports 450MW from VIC)Freuquency (rad/s)Post-Basslink with 450MW import from VICFig 3 Spectrum of autocorrelation from Creek Road, George Town and Farrell902700Phasor plot at W=7.5961 rad/s (Basslink export 510MW to VIC )Fig 4 Mode shape of mode 1 (Basslink with exportation power to VIC) III. A LARMING ON SUDDEN DAMPING DETERIORATIONTo obtain accurate damping factor estimates using ambient data, one needs long data sets – typically more than half an hour of data. If there is a fault in a system, however, one cannot in general afford to wait for half and hour before taking action. To deal with the case of sudden and potentially dangerous deterioration in damping one can monitor for sudden changes rather than try and wait to calculate exact damping values. Once sudden changes are detected alarms are created so that appropriate action is taken. This approach hasbeen tested on both simulated and real data and found to be effective – it relied on power system modelling and statistical monitoring of the Kalman innovation for that model [2].In [2] one sees the alarming algorithm demonstrated on a signal taken from a PMU measurement of an incident of poor connection of a generator in Victoria. This detection was based on 1 minute samples. While this case was not one of a sudden loss of mode damping such as from tripping of a SVC with power oscillation damper, it illustrates how a change of damping and the relevant frequency can be reliably alarmed.IV. R ECENT E VENTS IN A USTRALIAA summary of 4 major events in the Australian network as seen by the measurement network is presented in [5]. The 13/08/2004 event resulted in the 3 stage loss of 5 major generators in NSW. What was of interest was that the load shedding process was much more vigorous in Qld than NSW so the power transfer and thus the angle between Qld and NSW steps up to near 800 as seen in Fig 5 and Fig 6. It was fortunate that this incident started from an unusually low levelof transfer or the link would probably have been broken.Fig 5 Angle difference between Brisbane and SydneyFig 8 Allocation of power flow after eventThe relative strength of load shedding could be enhanced by use of the initial df/dt to indicate the region with the greatest need to load shed. The plot in Fig 7 shows that the loss of generation was clearly detectable to be in NSW. The overall pattern of post fault flows is seen in fig 8.V. L OAD IDENTIFICATIONRecent research projects have focused on the power system item with greatest uncertainty, namely the consumer load. The original measurement system yielded quite accurate measurements of system angle variations (of the order of 0.1 degree with measurement accuracy to 0.01 degrees). The variation of voltage magnitude in the bandwidth of electromagnetic oscillations is much smaller than this angle under normal operation. For load modelling the process adopted has been to seek correlations between voltage/frequency to P/Q. When the voltage magnitude measurement is poorly quantized then the power measurement formed from the voltage and current phasors is also going to suffer. This is a problem because the original measurement system was such that perurbations might onlycross 4 or 5 significant bits. Changes to the PMU system were therefore implemented to increase the transducers to 16 bit,perform data transfers using 32 bit files or use filtered enhancement of the variations in the 16 bit files. This latter process enhanced the high frequency terms before quantization, so that there were lesser quantization effects on the variations of interest.The benefit of the PMU concept is the ability to make high precision measurement of fundamental voltage/current magnitude and angle. This has provided an unprecedented opportunity for high precision angle/frequency measurements. It is the ability to get some idea of the response of the loads to a very small frequency variation that makes it possible to separate motor loads from impedance type loads.A model which has proved useful for analysing power system responses to load changes is provided in Fig 9 specifically for frequency to power relations. The plots in Fig 10 and 11 relate to the same feedback structure of Voltage affecting real and reactive power respectively. In figures 10 and 11 there are two types of excursions. There is one line of a slight droop in voltage with increase of power and other excursions which show a rise of P with a rise in V. The nearly horizontal line is interpreted as changes in the load P and Q respectively causing changes in the voltage at the substation. It is clear to see that this supply impedance effect is much more strongly associated with reactive loads. The other excursions are interpreted as external events causing voltage changes which then cause positive changes in Power for positive voltage changes.Fig 9 expanded model of feedback system Fig 10 Plot of Diff(V) against diff(P) Fig 11 Plot of Diff(V) against Diff(Q)Once the slope is known then the loop can be resolved and the transfer function for the load derived. One aspect of interest is that recent studies are showing that the area under the real component of the f-P relationship on a log of frequency plot is related to the total power of induction motors in the load (see fig 12) . The feedback component in the model in Fig 9 with the power affecting frequency (fig 13) is an indication of system electromagnetic modes and overall governor responseVI. D AMPING SIGNAL VALIDATIONi) The availability of an accurate long-term modal-parameter identification system has changed the way system damping tests are performed. Previously, time-domain fitting the ring-down of power oscillations following the brief insertion of a braking resistor was used to estimate the parameters of inter-area modes. This method suffered from the relatively large contributions made by randomly-excited oscillations of these modes. Now, modal parameter estimates during testing are obtained from the continuous-monitoring system that analyses the measured voltage angles at four sites. Figure 14 shows the variation of the damping of one inter-area mode (estimated using a 3-hour analysis window) as a power-oscillation damper (POD) was switched on and off at 3-hour intervals over a 24-hour period.Fig. 14 Estimated damping of a 2 rad/s inter-area oscillation mode in the Australian system during SVC power oscillation damper (POD) on/off testing.The sawtooth variation of estimated damping is a consequence of the 3-hour analysis window and 3-hourswitching interval. It is clear from Fig. A that changes otherthan the POD contributed to the variation of the mode damping over the 24-hour period. The results from the testing and those obtained from system eigenvalue studies provideda basis for validating the model of the SVC POD.ii) The measurements can be used to determine the (complex) ratios of the contributions made by particular variables to a chosen mode. Of particular value is the ratio of a voltage magnitude at a chosen location to a chosen voltage-angle difference signal. The evaluation of this ratio can be used to assess the contributions of nearby controllers (e.g. generator PSSs and SVC PODs) that are designed tocontribute damping of an inter-area mode. These controllers aim to produce voltage-magnitude contributions to the mode with a fixed phase ratio to voltage-angle contributions. Therefore identifying this phasor ratio is a useful check on the functioning of particular controllers. Applications have found two separate deficiences in the model of an SVC POD, which have both been corrected.VII. C ONCLUSIONSThe high precision data available from PMU systems when applied across a power system provide for a wide range of analysis control and identification improvements. The examples in Australia show the range of uses of PMU data from eigenvalue/eigenvector analysis, post fault analysis, damping alarms, load modelling and damping signal evaluation.VIII. R EFERENCES[1] M. Glickman, P. O’Shea G. Ledwich “Estimation of Modal Damping inPower Networks” Volume 22, Issue 3, Aug. 2007 Page(s):1340 - 1350 [2] R. A. Wiltshire, G. Ledwich, P. O’Shea “A Kalman Filtering Approach toRapidly Detecting Modal Changes in Power Systems” Volume 22, Issue 4, Nov. 2007 Page(s):1698 - 1706[3] G Ledwich “Decoupling for Improved Modal Estimates “IEEE PES 2007-03-05 24-28 June 2007 Page(s):1 - 6[4] C. L. Zhang G. F. Ledwich M. E. Langfellner, S. Karri "Modal AnalysisOf Pre- And Post Basslink With Tasmanian Network" Australian Universities Power Engineering Conference AUPEC, 10-13 Dec 2006, Melbourne, Australia[5] C. L. Zhang G. F. Ledwich ‘Analysis Of Major Australian Events UsingAn Angle Measurement System” AUPEC Sept 2005 Hobart PP159-164 [6] P. O’Shea, “The use of sliding spectral windows for parameter estimationin power system disturbance monitoring,” IEEE Trans. Power Syst.,vol. 15, pp. 1261–1267, Nov. 2000.[7] R. Kumaresan and D. Tufts, “Parameter estimation of dampedexponentials and pole-zero modeling,” IEEE Trans. Acoust., Speech, Signal Processing, vol. ASSP-30, pp. 833–890, 1982.[8] G.Ledwich E.Palmer “Modal Estimates from normal operation of powersystems” IEEE PES Winter meeting Singapore 2000.Gerard Ledwic h (M’69 SM’78) is a professor in Electrical Power Engineering at QUT and Fellow of the Institution of Engineers Australia. He has held positionsat University of Queensland, and in the Queensland Electricity Commission. He was the Pacific PowerProfessor at the University of Newcastle. The current position is Chair in Power Engineering at Queensland University of Technology. His research interests include control systems, powerelectronics, power systems and distributed generation. Donald Geddey received a B.Sc. degree, a B.E. (Hons) degree and a PhD. degree from the University of Sydney in 1968, 1970 and 1980 respectively. Since 1974 he has worked in the transmission utility in New South Wales. He is now the System Investigations Manager in the Transmission Development Groupof TransGrid.the Queensland University of Technology, Australia. Hereceived the BE, DipEd and PhD from the University ofQueensland. He worked as an engineer at the OverseasTelecommunications Commission for 3 years, atUniversity of Queensland’s Department of ElectricalEngineering for 4 years, at Queensland University ofTechnology’s School of Electrical and Electronic SystemsEngineering for 3 years, and at the School of Electrical and Computer Systems Engineering at RMIT, for 7 years. While at RMIT he received awards in Student Centred Teaching from the Faculty of Engineering and the University President. He re-joined the staff of the School of Electrical and Electronic Systems Engineering at Queensland University of Technology in 2002. His interests are in i) signal processing for communications and power systems, ii) reconfigurable computing, and iii) the use of multi-media inengineering education.。