1.4 nm TOBERMORITE A COMPARATIVE STUDY
ASTM D790
Designation:D790–03Standard Test Methods forFlexural Properties of Unreinforced and Reinforced Plastics and Electrical Insulating Materials1This standard is issued under thefixed designation D790;the number immediately following the designation indicates the year of original adoption or,in the case of revision,the year of last revision.A number in parentheses indicates the year of last reapproval.A superscript epsilon(e)indicates an editorial change since the last revision or reapproval.This standard has been approved for use by agencies of the Department of Defense.1.Scope*1.1These test methods cover the determination offlexural properties of unreinforced and reinforced plastics,including high-modulus composites and electrical insulating materials in the form of rectangular bars molded directly or cut from sheets, plates,or molded shapes.These test methods are generally applicable to both rigid and semirigid materials.However,flexural strength cannot be determined for those materials that do not break or that do not fail in the outer surface of the test specimen within the5.0%strain limit of these test methods. These test methods utilize a three-point loading system applied to a simply supported beam.A four-point loading system method can be found in Test Method D6272.1.1.1Procedure A,designed principally for materials that break at comparatively small deflections.1.1.2Procedure B,designed particularly for those materials that undergo large deflections during testing.1.1.3Procedure A shall be used for measurement offlexural properties,particularlyflexural modulus,unless the material specification states otherwise.Procedure B may be used for measurement offlexural strength only.Tangent modulus data obtained by Procedure A tends to exhibit lower standard deviations than comparable data obtained by means of Proce-dure B.1.2Comparative tests may be run in accordance with either procedure,provided that the procedure is found satisfactory for the material being tested.1.3The values stated in SI units are to be regarded as the standard.The values provided in parentheses are for informa-tion only.1.4This standard does not purport to address all of the safety concerns,if any,associated with its use.It is the responsibility of the user of this standard to establish appro-priate safety and health practices and determine the applica-bility of regulatory limitations prior to use.N OTE1—These test methods are not technically equivalent to ISO178.2.Referenced Documents2.1ASTM Standards:2D618Practice for Conditioning Plastics for TestingD638Test Method for Tensile Properties of PlasticsD883Terminology Relating to PlasticsD4000Classification System for Specifying Plastic Mate-rialsD5947Test Methods for Physical Dimensions of Solid Plastics SpecimensD6272Test Method for Flexural Properties of Unrein-forced and Reinforced Plastics and Electrical Insulating Materials by Four-Point BendingE4Practices for Force Verification of Testing Machines E691Practice for Conducting an Interlaboratory Study to Determine the Precision of a Test Method3.Terminology3.1Definitions—Definitions of terms applying to these test methods appear in Terminology D883and Annex A1of Test Method D638.4.Summary of Test Method4.1A bar of rectangular cross section rests on two supports and is loaded by means of a loading nose midway between the supports(see Fig.1).A support span-to-depth ratio of16:1 shall be used unless there is reason to suspect that a larger span-to-depth ratio may be required,as may be the case for certain laminated materials(see Section7and Note8for guidance).4.2The specimen is deflected until rupture occurs in the outer surface of the test specimen or until a maximum strain (see12.7)of5.0%is reached,whichever occursfirst.4.3Procedure A employs a strain rate of0.01mm/mm/min [0.01in./in./min]and is the preferred procedure for this test1These test methods are under the jurisdiction of ASTM Committee D20onPlastics and are the direct responsibility of Subcommittee D20.10on Mechanical Properties.Current edition approved March10,2003.Published April2003.Originally approved st previous edition approved in2002as D790–02.2For referenced ASTM standards,visit the ASTM website,,or contact ASTM Customer Service at service@.For Annual Book of ASTM Standards volume information,refer to the standard’s Document Summary page on the ASTM website.1*A Summary of Changes section appears at the end of this standard. Copyright©ASTM International,100Barr Harbor Drive,PO Box C700,West Conshohocken,PA19428-2959,United States.method,while Procedure B employs a strain rate of 0.10mm/mm/min [0.10in./in./min].5.Significance and Use5.1Flexural properties as determined by these test methods are especially useful for quality control and specification purposes.5.2Materials that do not fail by the maximum strain allowed under these test methods (3-point bend)may be more suited to a 4-point bend test.The basic difference between the two test methods is in the location of the maximum bending moment and maximum axial fiber stresses.The maximum axial fiber stresses occur on a line under the loading nose in 3-point bending and over the area between the loading noses in 4-point bending.5.3Flexural properties may vary with specimen depth,temperature,atmospheric conditions,and the difference in rate of straining as specified in Procedures A and B (see also Note 8).5.4Before proceeding with these test methods,reference should be made to the specification of the material being tested.Any test specimen preparation,conditioning,dimensions,or testing parameters,or combination thereof,covered in the materials specification shall take precedence over those men-tioned in these test methods.If there are no material specifi-cations,then the default conditions apply.Table 1in Classifi-cation System D 4000lists the ASTM materials standards that currently exist for plastics.6.Apparatus6.1Testing Machine —A properly calibrated testing ma-chine that can be operated at constant rates of crosshead motion over the range indicated,and in which the error in the load measuring system shall not exceed 61%of the maximum load expected to be measured.It shall be equipped with a deflection measuring device.The stiffness of the testing machine shall besuch that the total elastic deformation of the system does not exceed 1%of the total deflection of the test specimen during testing,or appropriate corrections shall be made.The load indicating mechanism shall be essentially free from inertial lag at the crosshead rate used.The accuracy of the testing machine shall be verified in accordance with Practices E 4.6.2Loading Noses and Supports —The loading nose and supports shall have cylindrical surfaces.In order to avoid excessive indentation,or failure due to stress concentration directly under the loading nose,the radii of the loading nose and supports shall be 5.060.1mm [0.19760.004in.]unless otherwise specified or agreed upon between the interested clients.When other loading noses and supports are used they must comply with the following requirements:they shall have a minimum radius of 3.2mm [1⁄8in.]for all specimens,and for specimens 3.2mm or greater in depth,the radius of the supports may be up to 1.6times the specimen depth.They shall be this large if significant indentation or compressive failure occurs.The arc of the loading nose in contact with the specimen shall be sufficiently large to prevent contact of the specimen with the sides of the nose (see Fig.1).The maximum radius of the loading nose shall be no more than 4times the specimen depth.N OTE 2—Test data have shown that the loading nose and support dimensions can influence the flexural modulus and flexural strength values.The loading nose dimension has the greater influence.Dimensions of the loading nose and supports must be specified in the material specification.6.3Micrometers —Suitable micrometers for measuring the width and thickness of the test specimen to an incremental discrimination of at least 0.025mm [0.001in.]should be used.All width and thickness measurements of rigid and semirigid plastics may be measured with a hand micrometer with ratchet.A suitable instrument for measuring the thickness of nonrigid test specimens shall have:a contact measuring pressure of 2562.5kPa [3.660.36psi],a movable circular contact foot 6.3560.025mm [0.25060.001in.]in diameter and a lower fixed anvil large enough to extend beyond the contact foot in all directions and being parallel to the contact foot within 0.005mm [0.002in.]over the entire foot area.Flatness of foot and anvil shall conform to the portion of the Calibration section of Test Methods D 5947.N OTE —(a )Minimum radius =3.2mm [1⁄8in.].(b )Maximum radius supports 1.6times specimen depth;maximum radius loading nose =4times specimen depth.FIG.1Allowable Range of Loading Nose and Support RadiiTABLE 1Flexural StrengthMaterial Mean,103psiValues Expressed in Units of %of 103psi V r A V R B r C R D ABS9.99 1.59 6.05 4.4417.2DAP thermoset 14.3 6.58 6.5818.618.6Cast acrylic 16.3 1.6711.3 4.7332.0GR polyester19.5 1.43 2.14 4.05 6.08GR polycarbonate 21.0 5.16 6.0514.617.1SMC26.04.767.1913.520.4AV r =within-laboratory coefficient of variation for the indicated material.It is obtained by first pooling the within-laboratory standard deviations of the test results from all of the participating laboratories:Sr =[[(s 1)2+(s 2)2...+(s n )2]/n]1/2then V r =(S r divided by the overall average for the material)3100.BV r =between-laboratory reproducibility,expressed as the coefficient of varia-tion:S R ={S r 2+S L 2}1/2where S L is the standard deviation of laboratory means.Then:V R =(S R divided by the overall average for the material)3100.Cr =within-laboratory critical interval between two test results =2.83V r .DR =between-laboratory critical interval between two test results =2.83V R.27.Test Specimens7.1The specimens may be cut from sheets,plates,or molded shapes,or may be molded to the desiredfinished dimensions.The actual dimensions used in Section4.2,Cal-culation,shall be measured in accordance with Test Methods D5947.N OTE3—Any necessary polishing of specimens shall be done only in the lengthwise direction of the specimen.7.2Sheet Materials(Except Laminated Thermosetting Ma-terials and Certain Materials Used for Electrical Insulation, Including Vulcanized Fiber and Glass Bonded Mica):7.2.1Materials1.6mm[1⁄16in.]or Greater in Thickness—Forflatwise tests,the depth of the specimen shall be the thickness of the material.For edgewise tests,the width of the specimen shall be the thickness of the sheet,and the depth shall not exceed the width(see Notes4and5).For all tests,the support span shall be16(tolerance61)times the depth of the beam.Specimen width shall not exceed one fourth of the support span for specimens greater than3.2mm[1⁄8in.]in depth.Specimens3.2mm or less in depth shall be12.7mm[1⁄2 in.]in width.The specimen shall be long enough to allow for overhanging on each end of at least10%of the support span, but in no case less than6.4mm[1⁄4in.]on each end.Overhang shall be sufficient to prevent the specimen from slipping through the supports.N OTE4—Whenever possible,the original surface of the sheet shall be unaltered.However,where testing machine limitations make it impossible to follow the above criterion on the unaltered sheet,one or both surfaces shall be machined to provide the desired dimensions,and the location of the specimens with reference to the total depth shall be noted.The value obtained on specimens with machined surfaces may differ from those obtained on specimens with original surfaces.Consequently,any specifi-cations forflexural properties on thicker sheets must state whether the original surfaces are to be retained or not.When only one surface was machined,it must be stated whether the machined surface was on the tension or compression side of the beam.N OTE5—Edgewise tests are not applicable for sheets that are so thin that specimens meeting these requirements cannot be cut.If specimen depth exceeds the width,buckling may occur.7.2.2Materials Less than1.6mm[1⁄16in.]in Thickness—The specimen shall be50.8mm[2in.]long by12.7mm[1⁄2in.] wide,testedflatwise on a25.4-mm[1-in.]support span.N OTE6—Use of the formulas for simple beams cited in these test methods for calculating results presumes that beam width is small in comparison with the support span.Therefore,the formulas do not apply rigorously to these dimensions.N OTE7—Where machine sensitivity is such that specimens of these dimensions cannot be measured,wider specimens or shorter support spans,or both,may be used,provided the support span-to-depth ratio is at least14to1.All dimensions must be stated in the report(see also Note6).7.3Laminated Thermosetting Materials and Sheet and Plate Materials Used for Electrical Insulation,Including Vulcanized Fiber and Glass-Bonded Mica—For paper-base and fabric-base grades over25.4mm[1in.]in nominal thickness,the specimens shall be machined on both surfaces to a depth of25.4mm.For glass-base and nylon-base grades, specimens over12.7mm[1⁄2in.]in nominal depth shall be machined on both surfaces to a depth of12.7mm.The support span-to-depth ratio shall be chosen such that failures occur in the outerfibers of the specimens,due only to the bending moment(see Note8).Therefore,a ratio larger than16:1may be necessary(32:1or40:1are recommended).When laminated materials exhibit low compressive strength perpendicular to the laminations,they shall be loaded with a large radius loading nose(up to four times the specimen depth to prevent premature damage to the outerfibers.7.4Molding Materials(Thermoplastics and Thermosets)—The recommended specimen for molding materials is127by 12.7by3.2mm[5by1⁄2by1⁄8in.]testedflatwise on a support span,resulting in a support span-to-depth ratio of16(tolerance 61).Thicker specimens should be avoided if they exhibit significant shrink marks or bubbles when molded.7.5High-Strength Reinforced Composites,Including Highly Orthotropic Laminates—The span-to-depth ratio shall be cho-sen such that failure occurs in the outerfibers of the specimens and is due only to the bending moment(see Note8).A span-to-depth ratio larger than16:1may be necessary(32:1or 40:1are recommended).For some highly anisotropic compos-ites,shear deformation can significantly influence modulus measurements,even at span-to-depth ratios as high as40:1. Hence,for these materials,an increase in the span-to-depth ratio to60:1is recommended to eliminate shear effects when modulus data are required,it should also be noted that the flexural modulus of highly anisotropic laminates is a strong function of ply-stacking sequence and will not necessarily correlate with tensile modulus,which is not stacking-sequence dependent.N OTE8—As a general rule,support span-to-depth ratios of16:1are satisfactory when the ratio of the tensile strength to shear strength is less than8to1,but the support span-to-depth ratio must be increased for composite laminates having relatively low shear strength in the plane of the laminate and relatively high tensile strength parallel to the support span.8.Number of Test Specimens8.1Test at leastfive specimens for each sample in the case of isotropic materials or molded specimens.8.2For each sample of anisotropic material in sheet form, test at leastfive specimens for each of the following conditions. Recommended conditions areflatwise and edgewise tests on specimens cut in lengthwise and crosswise directions of the sheet.For the purposes of this test,“lengthwise”designates the principal axis of anisotropy and shall be interpreted to mean the direction of the sheet known to be stronger inflexure.“Cross-wise”indicates the sheet direction known to be the weaker in flexure and shall be at90°to the lengthwise direction.9.Conditioning9.1Conditioning—Condition the test specimens at236 2°C[73.463.6°F]and5065%relative humidity for not less than40h prior to test in accordance with Procedure A of Practice D618unless otherwise specified by contract or the relevant ASTM material specification.Reference pre-test con-ditioning,to settle disagreements,shall apply tolerances of 61°C[1.8°F]and62%relative humidity.9.2Test Conditions—Conduct the tests at2362°C[73.46 3.6°F]and5065%relative humidity unlessotherwise 3specified by contract or the relevant ASTM material specifica-tion.Reference testing conditions,to settle disagreements, shall apply tolerances of61°C[1.8°F]and62%relative humidity.10.Procedure10.1Procedure A:10.1.1Use an untested specimen for each measurement. Measure the width and depth of the specimen to the nearest 0.03mm[0.001in.]at the center of the support span.For specimens less than2.54mm[0.100in.]in depth,measure the depth to the nearest0.003mm[0.0005in.].These measure-ments shall be made in accordance with Test Methods D5947.10.1.2Determine the support span to be used as described in Section7and set the support span to within1%of the determined value.10.1.3Forflexuralfixtures that have continuously adjust-able spans,measure the span accurately to the nearest0.1mm [0.004in.]for spans less than63mm[2.5in.]and to the nearest 0.3mm[0.012in.]for spans greater than or equal to63mm [2.5in.].Use the actual measured span for all calculations.For flexuralfixtures that havefixed machined span positions,verify the span distance the same as for adjustable spans at each machined position.This distance becomes the span for that position and is used for calculations applicable to all subse-quent tests conducted at that position.See Annex A2for information on the determination of and setting of the span.10.1.4Calculate the rate of crosshead motion as follows and set the machine for the rate of crosshead motion as calculated by Eq1:R5ZL2/6d(1) where:R=rate of crosshead motion,mm[in.]/min,L=support span,mm[in.],d=depth of beam,mm[in.],andZ=rate of straining of the outerfiber,mm/mm/min[in./ in./min].Z shall be equal to0.01.In no case shall the actual crosshead rate differ from that calculated using Eq1,by more than610%.10.1.5Align the loading nose and supports so that the axes of the cylindrical surfaces are parallel and the loading nose is midway between the supports.The parallelism of the apparatus may be checked by means of a plate with parallel grooves into which the loading nose and supports willfit when properly aligned(see A2.3).Center the specimen on the supports,with the long axis of the specimen perpendicular to the loading nose and supports.10.1.6Apply the load to the specimen at the specified crosshead rate,and take simultaneous load-deflection data. Measure deflection either by a gage under the specimen in contact with it at the center of the support span,the gage being mounted stationary relative to the specimen supports,or by measurement of the motion of the loading nose relative to the supports.Load-deflection curves may be plotted to determine theflexural strength,chord or secant modulus or the tangent modulus of elasticity,and the total work as measured by the area under the load-deflection curve.Perform the necessary toe compensation(see Annex A1)to correct for seating and indentation of the specimen and deflections in the machine.10.1.7Terminate the test when the maximum strain in the outer surface of the test specimen has reached0.05mm/mm [in./in.]or at break if break occurs prior to reaching the maximum strain(Notes9and10).The deflection at which this strain will occur may be calculated by letting r equal0.05 mm/mm[in./in.]in Eq2:D5rL2/6d(2) where:D=midspan deflection,mm[in.],r=strain,mm/mm[in./in.],L=support span,mm[in.],andd=depth of beam,mm[in.].N OTE9—For some materials that do not yield or break within the5% strain limit when tested by Procedure A,the increased strain rate allowed by Procedure B(see10.2)may induce the specimen to yield or break,or both,within the required5%strain limit.N OTE10—Beyond5%strain,this test method is not applicable.Some other mechanical property might be more relevant to characterize mate-rials that neither yield nor break by either Procedure A or Procedure B within the5%strain limit(for example,Test Method D638may be considered).10.2Procedure B:10.2.1Use an untested specimen for each measurement.10.2.2Test conditions shall be identical to those described in10.1,except that the rate of straining of the outer surface of the test specimen shall be0.10mm/mm[in./in.]/min.10.2.3If no break has occurred in the specimen by the time the maximum strain in the outer surface of the test specimen has reached0.05mm/mm[in./in.],discontinue the test(see Note10).11.Retests11.1Values for properties at rupture shall not be calculated for any specimen that breaks at some obvious,fortuitousflaw, unless suchflaws constitute a variable being studied.Retests shall be made for any specimen on which values are not calculated.12.Calculation12.1Toe compensation shall be made in accordance with Annex A1unless it can be shown that the toe region of the curve is not due to the take-up of slack,seating of the specimen,or other artifact,but rather is an authentic material response.12.2Flexural Stress(s f)—When a homogeneous elastic material is tested inflexure as a simple beam supported at two points and loaded at the midpoint,the maximum stress in the outer surface of the test specimen occurs at the midpoint.This stress may be calculated for any point on the load-deflection curve by means of the following equation(see Notes11-13):s f53PL/2bd2(3)where:s=stress in the outerfibers at midpoint,MPa[psi], 4P=load at a given point on the load-deflection curve,N [lbf],L=support span,mm[in.],b=width of beam tested,mm[in.],andd=depth of beam tested,mm[in.].N OTE11—Eq3applies strictly to materials for which stress is linearly proportional to strain up to the point of rupture and for which the strains are small.Since this is not always the case,a slight error will be introduced if Eq3is used to calculate stress for materials that are not true Hookean materials.The equation is valid for obtaining comparison data and for specification purposes,but only up to a maximumfiber strain of 5%in the outer surface of the test specimen for specimens tested by the procedures described herein.N OTE12—When testing highly orthotropic laminates,the maximum stress may not always occur in the outer surface of the test specimen.3 Laminated beam theory must be applied to determine the maximum tensile stress at failure.If Eq3is used to calculate stress,it will yield an apparent strength based on homogeneous beam theory.This apparent strength is highly dependent on the ply-stacking sequence of highly orthotropic laminates.N OTE13—The preceding calculation is not valid if the specimen slips excessively between the supports.12.3Flexural Stress for Beams Tested at Large Support Spans(s f)—If support span-to-depth ratios greater than16to 1are used such that deflections in excess of10%of the support span occur,the stress in the outer surface of the specimen for a simple beam can be reasonably approximated with the following equation(see Note14):s f5~3PL/2bd2!@116~D/L!224~d/L!~D/L!#(4) where:s f,P,L,b,and d are the same as for Eq3,andD=deflection of the centerline of the specimen at the middle of the support span,mm[in.].N OTE14—When large support span-to-depth ratios are used,significant end forces are developed at the support noses which will affect the moment in a simple supported beam.Eq4includes additional terms that are an approximate correction factor for the influence of these end forces in large support span-to-depth ratio beams where relatively large deflec-tions exist.12.4Flexural Strength(s fM)—Maximumflexural stress sustained by the test specimen(see Note12)during a bending test.It is calculated according to Eq3or Eq4.Some materials that do not break at strains of up to5%may give a load deflection curve that shows a point at which the load does not increase with an increase in strain,that is,a yield point(Fig.2, Curve B),Y.Theflexural strength may be calculated for these materials by letting P(in Eq3or Eq4)equal this point,Y.12.5Flexural Offset Yield Strength—Offset yield strength is the stress at which the stress-strain curve deviates by a given strain(offset)from the tangent to the initial straight line portion of the stress-strain curve.The value of the offset must be given whenever this property is calculated.N OTE15—This value may differ fromflexural strength defined in12.4.Both methods of calculation are described in the annex to Test Method D638.12.6Flexural Stress at Break(s fB)—Flexural stress at break of the test specimen during a bending test.It is calculated according to Eq3or Eq4.Some materials may give a load deflection curve that shows a break point,B,without a yield point(Fig.2,Curve a)in which case s fB=s fM.Other materials may give a yield deflection curve with both a yield and a break point,B(Fig.2,Curve b).Theflexural stress at break may be calculated for these materials by letting P(in Eq 3or Eq4)equal this point,B.12.7Stress at a Given Strain—The stress in the outer surface of a test specimen at a given strain may be calculated in accordance with Eq3or Eq4by letting P equal the load read from the load-deflection curve at the deflection corresponding to the desired strain(for highly orthotropic laminates,see Note 12).12.8Flexural Strain,e f—Nominal fractional change in the length of an element of the outer surface of the test specimen at midspan,where the maximum strain occurs.It may be calculated for any deflection using Eq5:e f56Dd/L2(5) where:e f=strain in the outer surface,mm/mm[in./in.],D=maximum deflection of the center of the beam,mm [in.],L=support span,mm[in.],and3For a discussion of these effects,see Zweben,C.,Smith,W.S.,and Wardle,M. W.,“Test Methods for Fiber Tensile Strength,Composite Flexural Modulus and Properties of Fabric-Reinforced Laminates,“Composite Materials:Testing and Design(Fifth Conference),ASTM STP674,1979,pp.228–262.N OTE—Curve a:Specimen that breaks before yielding.Curve b:Specimen that yields and then breaks before the5%strain limit.Curve c:Specimen that neither yields nor breaks before the5%strain limit.FIG.2Typical Curves of Flexural Stress(ßf)Versus FlexuralStrain(ef)5d =depth,mm [in.].12.9Modulus of Elasticity :12.9.1Tangent Modulus of Elasticity —The tangent modu-lus of elasticity,often called the “modulus of elasticity,”is the ratio,within the elastic limit,of stress to corresponding strain.It is calculated by drawing a tangent to the steepest initial straight-line portion of the load-deflection curve and using Eq 6(for highly anisotropic composites,see Note 16).E B 5L 3m /4bd3(6)where:E B =modulus of elasticity in bending,MPa [psi],L =support span,mm [in.],b =width of beam tested,mm [in.],d =depth of beam tested,mm [in.],andm =slope of the tangent to the initial straight-line portion of the load-deflection curve,N/mm [lbf/in.]of deflec-tion.N OTE 16—Shear deflections can seriously reduce the apparent modulus of highly anisotropic composites when they are tested at low span-to-depth ratios.3For this reason,a span-to-depth ratio of 60to 1is recommended for flexural modulus determinations on these composites.Flexural strength should be determined on a separate set of replicate specimens at a lower span-to-depth ratio that induces tensile failure in the outer fibers of the beam along its lower face.Since the flexural modulus of highly anisotropic laminates is a critical function of ply-stacking sequence,it will not necessarily correlate with tensile modulus,which is not stacking-sequence dependent.12.9.2Secant Modulus —The secant modulus is the ratio ofstress to corresponding strain at any selected point on the stress-strain curve,that is,the slope of the straight line that joins the origin and a selected point on the actual stress-strain curve.It shall be expressed in megapascals [pounds per square inch].The selected point is chosen at a prespecified stress or strain in accordance with the appropriate material specification or by customer contract.It is calculated in accordance with Eq 6by letting m equal the slope of the secant to the load-deflection curve.The chosen stress or strain point used for the determination of the secant shall be reported.12.9.3Chord Modulus (E f )—The chord modulus may be calculated from two discrete points on the load deflectioncurve.The selected points are to be chosen at two prespecified stress or strain points in accordance with the appropriate material specification or by customer contract.The chosen stress or strain points used for the determination of the chord modulus shall be reported.Calculate the chord modulus,E f using the following equation:E f 5~s f 22s f 1!/~e f 22e f 1!(7)where:s f 2and s f 1are the flexural stresses,calculated from Eq 3or Eq 4and measured at the predefined points on the load deflection curve,and e f 2ande f 1are the flexural strain values,calculated from Eq 5and measured at the predetermined points on the load deflection curve.12.10Arithmetic Mean —For each series of tests,the arithmetic mean of all values obtained shall be calculated to three significant figures and reported as the “average value”for the particular property in question.12.11Standard Deviation —The standard deviation (esti-mated)shall be calculated as follows and be reported to two significant figures:s 5=~(X 22nX¯2!/~n 21!(8)where:s =estimated standard deviation,X =value of single observation,n =number of observations,andX¯=arithmetic mean of the set of observations.13.Report13.1Report the following information:13.1.1Complete identification of the material tested,includ-ing type,source,manufacturer’s code number,form,principal dimensions,and previous history (for laminated materials,ply-stacking sequence shall be reported),13.1.2Direction of cutting and loading specimens,when appropriate,13.1.3Conditioning procedure,13.1.4Depth and width of specimen,13.1.5Procedure used (A or B),13.1.6Support span length,13.1.7Support span-to-depth ratio if different than 16:1,13.1.8Radius of supports and loading noses if different than 5mm,13.1.9Rate of crosshead motion,13.1.10Flexural strain at any given stress,average value and standard deviation,13.1.11If a specimen is rejected,reason(s)for rejection,13.1.12Tangent,secant,or chord modulus in bending,average value,standard deviation,and the strain level(s)used if secant or chord modulus,13.1.13Flexural strength (if desired),average value,and standard deviation,13.1.14Stress at any given strain up to and including 5%(if desired),with strain used,average value,and standard devia-tion,TABLE 2Flexural ModulusMaterial Mean,103psiValues Expressed in units of %of 103psi V r A V R B r C R D ABS338 4.797.6913.621.8DAP thermoset 485 2.897.188.1520.4Cast acrylic 81013.716.138.845.4GR polyester816 3.49 4.209.9111.9GR polycarbonate 1790 5.52 5.5215.615.6SMC195010.913.830.839.1AV r =within-laboratory coefficient of variation for the indicated material.It is obtained by first pooling the within-laboratory standard deviations of the test results from all of the participating laboratories:Sr =[[(s 1)2+(s 2)2...+(s n )2]/n ]1/2then V r =(S r divided by the overall average for the material)3100.BV r =between-laboratory reproducibility,expressed as the coefficient of varia-tion:S R ={S r 2+S L 2}1/2where S L is the standard deviation of laboratory means.Then:V R =(S R divided by the overall average for the material)3100.Cr =within-laboratory critical interval between two test results =2.83V r .DR =between-laboratory critical interval between two test results =2.83V R.6。
臭氧应用英文文章21
/locate/watres
Efficiency of activated carbon to transform ozone into dOH radicals: Influence of operational parameters
Some recent studies (Jans and Hoigne´ , 1998; Beltra´ n et al., 2002; Ma et al., 2004) have reported that activated carbon can accelerate ozone decomposition resulting in the formation of dOH radicals. It was demonstrated that incorporated metal centres, electrons of the graphenic layers (basal plane electrons) and basic surface groups of the activated carbon, are the main factors responsible for the decomposition of ozone at the activated carbon surface (Rivera-Utrilla et al., 2002; Rivera-Utrilla and Sa´ nchez-Polo, 2002, 2004). In addition, it was also observed that the presence of activated carbon during ozonation of organic micropollutants leads to a reduction in the concentration of DOM increasing the applicability of this treatment system (Rivera-Utrilla et al., 2002; Rivera-Utrilla and Sa´ nchezPolo, 2002, 2004).
专题05 阅读理解D篇(2024年新课标I卷) (专家评价+三年真题+满分策略+多维变式) 原卷版

《2024年高考英语新课标卷真题深度解析与考后提升》专题05阅读理解D篇(新课标I卷)原卷版(专家评价+全文翻译+三年真题+词汇变式+满分策略+话题变式)目录一、原题呈现P2二、答案解析P3三、专家评价P3四、全文翻译P3五、词汇变式P4(一)考纲词汇词形转换P4(二)考纲词汇识词知意P4(三)高频短语积少成多P5(四)阅读理解单句填空变式P5(五)长难句分析P6六、三年真题P7(一)2023年新课标I卷阅读理解D篇P7(二)2022年新课标I卷阅读理解D篇P8(三)2021年新课标I卷阅读理解D篇P9七、满分策略(阅读理解说明文)P10八、阅读理解变式P12 变式一:生物多样性研究、发现、进展6篇P12变式二:阅读理解D篇35题变式(科普研究建议类)6篇P20一原题呈现阅读理解D篇关键词: 说明文;人与社会;社会科学研究方法研究;生物多样性; 科学探究精神;科学素养In the race to document the species on Earth before they go extinct, researchers and citizen scientists have collected billions of records. Today, most records of biodiversity are often in the form of photos, videos, and other digital records. Though they are useful for detecting shifts in the number and variety of species in an area, a new Stanford study has found that this type of record is not perfect.“With the rise of technology it is easy for people to make observation s of different species with the aid of a mobile application,” said Barnabas Daru, who is lead author of the study and assistant professor of biology in the Stanford School of Humanities and Sciences. “These observations now outnumber the primary data that comes from physical specimens(标本), and since we are increasingly using observational data to investigate how species are responding to global change, I wanted to know: Are they usable?”Using a global dataset of 1.9 billion records of plants, insects, birds, and animals, Daru and his team tested how well these data represent actual global biodiversity patterns.“We were particularly interested in exploring the aspects of sampling that tend to bias (使有偏差) data, like the greater likelihood of a citizen scientist to take a picture of a flowering plant instead of the grass right next to it,” said Daru.Their study revealed that the large number of observation-only records did not lead to better global coverage. Moreover, these data are biased and favor certain regions, time periods, and species. This makes sense because the people who get observational biodiversity data on mobile devices are often citizen scientists recording their encounters with species in areas nearby. These data are also biased toward certain species with attractive or eye-catching features.What can we do with the imperfect datasets of biodiversity?“Quite a lot,” Daru explained. “Biodiversity apps can use our study results to inform users of oversampled areas and lead them to places – and even species – that are not w ell-sampled. To improve the quality of observational data, biodiversity apps can also encourage users to have an expert confirm the identification of their uploaded image.”32. What do we know about the records of species collected now?A. They are becoming outdated.B. They are mostly in electronic form.C. They are limited in number.D. They are used for public exhibition.33. What does Daru’s study focus on?A. Threatened species.B. Physical specimens.C. Observational data.D. Mobile applications.34. What has led to the biases according to the study?A. Mistakes in data analysis.B. Poor quality of uploaded pictures.C. Improper way of sampling.D. Unreliable data collection devices.35. What is Daru’s suggestion for biodiversity apps?A. Review data from certain areas.B. Hire experts to check the records.C. Confirm the identity of the users.D. Give guidance to citizen scientists.二答案解析三专家评价考查关键能力,促进思维品质发展2024年高考英语全国卷继续加强内容和形式创新,优化试题设问角度和方式,增强试题的开放性和灵活性,引导学生进行独立思考和判断,培养逻辑思维能力、批判思维能力和创新思维能力。
C-S-H组成和结构

• 基本组成
转化
SiO2-CaO-H2O
• 两个指标
钙硅比(C/S)
• 组成复杂性
CaOx·SiO2·(H2O)y 水硅比(H/S)
时间和空间的双重变化性
C/S 0.6-2.0
C-S-H凝胶形貌
Ⅰ型C-S-H
纤维状的C-S-H相(SEM)
Ⅱ型C-S-H 网络状的C-S-H相和六角板状Ca(OH)2晶体(SEM)
C-S-H的组成和结构
史才军
湖南大学土木工程学院
C-S-H概述 C-S-H发展历程 C-S-H化学组成 C-S-H结构模型
C-S-H 凝胶研究方法
C-S-H概述
重要的水泥水化产物 决定混凝土工程特性的重要因素 水泥水化体积的50 - 60% 表面积大 (100-700 m2/g) 可通过人工合成,由含钙盐和硅酸盐的 溶液沉淀得到
凝胶由刚性的C-S-H 组成,只能解释浆体湿胀干缩过程中的毛细作用。
Ca9( Si6O18H2) •6H2O
C-S-H(Ⅰ) 与1.4-nm tobermorite结构类似 桥式四面体的缺失,单链长度改变 层间Ca离子含量的变化 Ca/Si=0.67~1.5
C-S-H(Ⅱ) 与jennite结构类似 不完美的六水矽钙石 桥式四面体的缺失,单链长度改变 C/S≈2.0
1.4-nm tobermorite
中心:Ca-O多面体 两侧:[SiO4]4-四面体单链 层状结构 C/S=0.87 理想结构组成通式:
Ca5( Si6O18H2) • 8H2O
层状结构
B-桥四面体 P-成对的四面体 H-OH 离子
Jennite
Ca-O层周围存在大量OH-; Ca-O层发生起皱,皱褶里含有硅 氧四面体、水分子和OH-; C/S=1.5 理想结构组成通式:
基于红外与核磁共振技术揭示C-S-H聚合机理
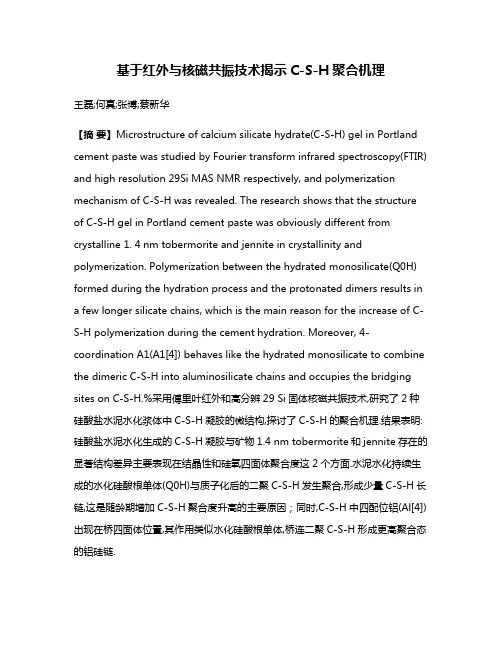
基于红外与核磁共振技术揭示C-S-H聚合机理王磊;何真;张博;蔡新华【摘要】Microstructure of calcium silicate hydrate(C-S-H) gel in Portland cement paste was studied by Fourier transform infrared spectroscopy(FTIR) and high resolution 29Si MAS NMR respectively, and polymerization mechanism of C-S-H was revealed. The research shows that the structure of C-S-H gel in Portland cement paste was obviously different from crystalline 1. 4 nm tobermorite and jennite in crystallinity and polymerization. Polymerization between the hydrated monosilicate(Q0H) formed during the hydration process and the protonated dimers results in a few longer silicate chains, which is the main reason for the increase of C-S-H polymerization during the cement hydration. Moreover, 4-coordination A1(A1[4]) behaves like the hydrated monosilicate to combine the dimeric C-S-H into aluminosilicate chains and occupies the bridging sites on C-S-H.%采用傅里叶红外和高分辨29 Si固体核磁共振技术,研究了2种硅酸盐水泥水化浆体中C-S-H凝胶的微结构,探讨了C-S-H的聚合机理.结果表明:硅酸盐水泥水化生成的C-S-H凝胶与矿物1.4 nm tobermorite和jennite存在的显著结构差异主要表现在结晶性和硅氧四面体聚合度这2个方面.水泥水化持续生成的水化硅酸根单体(Q0H)与质子化后的二聚C-S-H发生聚合,形成少量C-S-H长链,这是随龄期增加C-S-H聚合度升高的主要原因;同时,C-S-H中四配位铝(Al[4])出现在桥四面体位置,其作用类似水化硅酸根单体,桥连二聚C-S-H形成更高聚合态的铝硅链.【期刊名称】《建筑材料学报》【年(卷),期】2011(014)004【总页数】6页(P447-451,458)【关键词】C-S-H;微结构;聚合度;机理;核磁共振【作者】王磊;何真;张博;蔡新华【作者单位】武汉大学水资源与水电工程科学国家重点实验室,湖北武汉430072;武汉大学水资源与水电工程科学国家重点实验室,湖北武汉430072;武汉大学水资源与水电工程科学国家重点实验室,湖北武汉430072;武汉大学水资源与水电工程科学国家重点实验室,湖北武汉430072【正文语种】中文【中图分类】TQ172.1水化硅酸钙凝胶(C-S-H凝胶)是硅酸盐水泥最主要的水化产物和水泥混凝土最主要的胶结成分[1],是决定混凝土工程特性如强度、收缩和抗渗性的重要因素[2],其结构会随着水泥混凝土水胶比、养护温度、水化龄期、初始组分的变化而变化[3-5],同时还受结构中固溶的掺杂离子的影响[6-7].有多种结构模型可以表征C-S-H凝胶结构,目前应用最广的是Taylor[8-9]提出的类tobermorite(下文简称为 T)和类jennite(下文简称为J)模型,其模型依据是C-S-H凝胶的某些结构特点类似于T,J这2种矿物,如硅氧四面体聚合的三元重复结构、中央Ca—O层等(见图1).Kirkpatrick等[5]基于结晶学的观点认为C-S-H凝胶结构更类似于矿物T并提出了具有缺陷结构的T模型.Grutzek[4]提出的模型则假定不同的C-S-H凝胶都具有一个初始结构,这种水化初期形成的先驱结构是二聚C-S-H,随着水化进行逐渐变为链状结构T,最终形成了二聚C-S-H和链状结构T的混合体.Thomas等[2]使用无弹性中子散射发现白水泥和C3S水化形成的C-S-H凝胶中23%(质量分数)的Ca2+被OH-价平衡,接近于J结构的33%,从而认为C-S-H凝胶在结构上更类似于矿物J.Richardson模型[10-11]协调了几种主要的C-S-H模型差异,并用数值化图揭示了C-S-H中硅氧四面体排列遵循T和J结构的3n-1规则(n=1,2,3,……)以及 C-S-H 二聚体持续大量存在的原因.图1 1.4nm tobermorite的三元重复结构示意图Fig.1 Schematic diagrams showing dreierkette structure present in 1.4nm tobermorite[10-11]尽管有了广泛的探索研究,但对C-S-H凝胶微结构的理解仍然不够充分,重要的未知问题包括:硅酸盐水泥水化生成的C-S-H凝胶与矿物T和J之间的结构差异;C-S-H聚合的实质以及C-S-H结构中Al对C-S-H聚合的影响.本文在已有的研究基础上,通过FTIR和高分辨29Si固体核磁共振技术,从结晶性和硅氧四面体聚合度这2个方面研究了C-S-H凝胶与矿物T,J结构差异的特征,并对水化过程中C-S-H聚合机理以及Al对C-S-H聚合的影响进行了阐述,藉此为现代水泥基材料的微观机理研究提供借鉴.1 试验1.1 原材料试验采用的原材料是2种P·Ⅰ水泥(华新水泥股份有限公司),其主要化学组成见表1.表1 水泥主要化学组成Table 1 Chemical compositions(by mass)of cement %Material CaO SiO2Fe2O3Al2O3MgO K2O Cement A(CA)63.90 19.60 3.79 4.49 2.71 0.86 Cement B(CB)62.60 21.35 3.31 4.673.08 0.541.2 样品制备分别制备水灰比为0.3(质量比)的2种水泥净浆,24h脱模后标准养护到3,28,120d,取样终止水化.拟进行FTIR分析的样品采用磨细后的粉末样品,测试时将其与KBr混合(二者质量比为1︰100),然后压制成薄片进行红外测试.拟进行NMR分析的样品也采用粉末样品,测试时将其置入固体探头样品转子中,并保持样品在氧化锆样品管内的稳定性.1.3 测试方法及原理FTIR测试采用美国Nicolet公司170SX型傅里叶红外光谱分析仪,其分辨率为4cm-1.红外光谱法是通过讨论产生振动光谱的各种分子振动类型,了解红外光谱中各种振动吸收峰的归属,且振动波数偏移可以反映分子结构特征的变化.譬如硅氧四面体中Si—O键的不对称伸缩振动的位移变化:一般水泥中矿物Alite和Belite的Si—O键在926cm-1附近振动,若聚合为Si—O—Si键,就迁移至970cm-1附近振动.29Si固体核磁共振谱(29Si MAS NMR谱)测试采用美国Varian公司Inova600型共振仪,其磁场强度为14.5T,魔角旋转(magic-angle spinning,MAS)转速为9kHz,固体样品转子直径为3.2mm,29Si共振频率为119.148MHz,脉冲宽度为2μs,偏转角为45°,采样时间为0.5s,循环时间为5s,扫描次数为2 500,化学位移外标物为四甲基硅烷(tetramethylsilane,TMS).核磁共振方法研究的是各种原子核周围的不同局域环境.由于原子核存在于原子、分子以及它们的各种聚集体中,不同的核外环境对核具有不同的附加内场和不同的核外相互作用,从而使得原子核发生能级跃迁时所吸收光子的频率不同,也即产生不同的核磁共振信号,因此可以通过对NMR信号的分析获得物质的结构信息.在29 Si固体核磁共振谱中,Si所处的化学环境用Qi表示,其中i(i=0~4)为每个硅氧四面体单元与相邻四面体共享氧原子的个数,因此可以通过测定Qi的相对含量分析C-S-H凝胶的结构信息.2 试验结果和讨论2.1 FTIR试验结果及分析图2为未水化水泥以及水化3,28,120d水泥浆体的FTIR图谱.图2 未水化水泥及水化3,28,120d水泥浆体的FTIR谱Fig.2 FTIR spectra of unhydrated cement and cement paste at 3,28,120dage由图2可以看出,2种水泥浆体的FTIR波谱基本相似.Si—O键的弯曲振动(包括面内弯曲振动和面外弯曲振动)和伸缩振动吸收峰分别位于400~600cm-1和900~1 000cm-1,水分子的O—H伸缩振动吸收峰位于3 430cm-1,CH的O—H伸缩振动吸收峰位于3 640cm-1,这都与目前红外振动吸收峰归属的相关研究[1,12-13]一致.由图2还可看出,2种水泥水化矿物(Alite和Belite)在925cm-1处的Si—O 伸缩振动随着水化持续均向更高波数迁移,水化3,28,120d的水泥浆体分别迁移至968,976,979cm-1(水泥 A),以及968,973,979cm-1(水泥B).向高波数的迁移说明Si—O键逐渐聚合为Si—O—Si键,C-S-H 中硅氧四面体聚合度增加,而在460cm-1和523cm-1处对应Si—O弯曲振动相对强度的变化也说明了这一点.此外,有文献[1]指出,Jennite在3 465~3 624cm-1处出现吸收带(见图3),表明矿物J的中央Ca—O层上OH为有序配位,反映了矿物J的晶体特征,而在图2中并没有出现相应的吸收带(非测试条件导致).考虑到硅酸盐水泥水化形成的C-S-H凝胶有较高的 Ca—OH 含量[2-3,9-11],而 FTIR 谱图又不存在相应吸收带,则可以说明硅酸盐水泥水化形成的C-S-H凝胶的中央Ca—O层上OH配位不如矿物J有序.由此可见,C-S-H凝胶结构呈无序特征.图3 矿物J的FTIR谱片段Fig.3 Part of FTIR spectra of jennite[1]2.2 NMR试验结果及分析图4为未水化水泥以及水化3,28,120d水泥浆体的29Si MAS NMR谱.图4 未水化水泥及水化3,28,120d水泥浆体的29Si MAS NMR谱Fig.4 29Si MAS NMR spectra of unhydrated cement and cement paste at 3,28,120dage由图4可见,2种水泥浆体水化时29 Si MAS NMR的变化规律一致,其29Si共振信号主要出现在-72×10-6,-75×10-6,-79×10-6,-82×10-6,-85×10-6处.依据目前广泛的核磁共振研究成果[3,5-7,11,14],这些信号分别归属于 Q0(矿物 Alite和Belite的硅氧四面体)、Q0H(水化硅酸根单体)、Q1(C-S-H二聚体或者高聚体中直链末端的硅氧四面体)、Q2(Al)(C-S-H 链中间与1个铝氧四面体相邻的硅氧四面体)、Q2(C-S-H 直链中间的硅氧四面体).由图4还可见:随着龄期增加,2种水泥浆体的Q0持续降低,说明熟料矿物逐渐减少;Q0H在水化28d时以峰肩形式出现,在水化120d时未消失;Q1在整个水化过程中持续增高;水化3d时出现了较弱的Q2(Al)和Q2 峰肩,水化120d 时Q2(Al)和Q2峰较28d略有提高但Q1强度仍远大于Q2(Al)和Q2,考虑到水泥和C3S水化只产生微量的三聚体[15],说明水化直到120d时C-S-H 仍以二聚体为主,这一现象在 C3S水化体系中也明显存在[15-16].而在真实的矿物T和J中,硅氧四面体具有三元重复结构,Q2峰强远远高于Q1(如图5所示),说明二聚体Q1极少.上述说明,硅酸盐水泥水化生成的C-S-H与矿物T和J在硅氧四面体聚合方面存在显著差异,其差异可解释为硅酸盐水泥浆体中因缺少大量桥四面体而使得二聚体单元大量存在.这一结论显然有别于C-S-H凝胶结构的类T或类J的观点.图5 1.4nm tobermorite和jennite的29Si MAS NMR谱Fig.5 29Si MAS NMR spectra of 1.4nm tobermorite and jennite[5]Q0H在C-S-H凝胶结构中的作用并不明确.对于Q0H在水化过程中长期存在的原因,Richardson模型[10-11]认为,Q0H出现在其模型中硅氧四面体链的链端,是C-S-H极小的颗粒尺寸导致的边缘效应所致;而笔者则认为,由于水化硅酸根单体和硅氧四面体链链端Si的化学环境不同,因此,Q0H的存在与水泥水化持续生成的水化硅酸根单体有关.3 C-S-H聚合机理及Al对C-S-H聚合的影响3.1 C-S-H聚合机理硅酸盐水泥水化初期形成的C-S-H以二聚体为主,二聚硅酸根(Si2O7)6-通过O与中央钙氧层中的Ca形成Si—O—Ca键来维持二聚体单元的电中性.二聚体的结构示意图见图6.当水泥浆体溶液达到石灰过饱和度时,氢氧化钙(CH)微晶开始析出,生长着的CH晶体吸引Ca2+造成其附近C-S-H二聚体结构中Si—O—Ca键的Ca2+缺失,造成结构中多余负电荷,导致二聚C-S-H单元质子化而产生Si—O—H.质子化后的C-S-H二聚体结构见图7.有研究者[17]提出了一种C-S-H聚合方式,这种类似硅凝胶的聚合方式如下所示:≡Si—OH+HO—Si≡—→≡Si—O—Si≡+H2O他们认为这一过程是通过Si—OH基团的脱水缩合连接相邻的C-S-H颗粒进行的,显然,这种方式并没有考虑C-S-H 中[SiO4]4-聚合的3n-1规则.本研究认为,水化硅酸根单体(见图8)与2个质子化后的C-S-H二聚体单元聚合形成了C-S-H高聚体(见图9),这种聚合方式可以解释硅氧四面体聚合的2,5,8…(3n-1)规则.因为Q0H在水化过程中仅少量存在(见图4),因此二聚体向高聚体的转变不会大量发生,故硅酸盐水泥水化120d时C-S-H仍以二聚体为主.图6 C-S-H二聚体结构示意图Fig.6 Schematic diagrams showing C-S-Hdimer图7 质子化的C-S-H二聚体结构示意图Fig.7 Schematic diagrams showing protonatedC-S-H dimer图8 水化硅酸根单体(Q0H)结构示意图Fig.8 Schematic diagrams showing hydrated monosilicate图9 五聚体结构形成过程示意图Fig.9 Diagrams illustrating the polymerization between one hydrated monosilicate and two dimers to form apentamer3.2 Al对C-S-H聚合的影响从图4可以看出,2种硅酸盐水泥的Q2(Al)在水化3d和28d时均以微小峰肩形式出现,在水化120d时较为明显,表明硅酸盐水泥水化过程中生成了含铝C-S-H.根据核磁共振基本原理,铝原子核对邻近化学配位的硅原子核的化学屏蔽作用小于硅原子核而大于氢原子核,故在-75×10-6~-79×10-6无NMR共振信号,说明不存在Q1(Al),进而说明Al不会占据二聚C-S-H以及C-S-H 的双四面体位置,而是出现在 C-S-H 的桥四面体位置.Richardson模型[10-11]的数值化假定支持了本研究的这个结论.Al[4]结构示意图见图10.Al[4]的作用类似于水化硅酸根单体,桥连质子化后的二聚C-SH形成更高聚合态的铝硅链(见图11),这就解释了Al占据C-S-H桥四面体位置的原因,即通过脱水聚合,1个四配位铝桥连2个C-S-H二聚体生成1个含铝五聚体和2个水分子.图10 四配位铝结构示意图Fig.10 Schematic diagrams showing 4-coordination Al(Al[4])图11 含铝五聚体结构形成过程示意图Fig.11 Diagrams illustrating the polymerization between Al[4]and two dimers to form an aluminouspentamerFTIR和高分辨29Si固体核磁共振技术,使得水泥基材料中最难识别的C-S-H 相清晰地呈现在人们面前,二者结合可以发现C-S-H微结构及其形成机理方面的重要信息,为从微观角度进行材料设计提供了帮助.4 结论(1)硅酸盐水泥水化生成的C-S-H凝胶与矿物T、矿物J结构在结晶性和硅氧四面体聚合度这2个方面均存在差异:水泥水化形成的C-S-H结构中的Ca—OH没有矿物J有序;C-S-H结构以二聚体为主,不存在大量类似矿物T和J的硅氧四面体三元重复结构.(2)水泥中的C-S-H 聚合不同于硅凝胶的聚合,水泥水化过程中持续生成的水化硅酸根单体Q0H与质子化后的二聚C-S-H发生聚合形成少量C-S-H长链,使得水泥水化过程中C-S-H聚合度升高,Q0H的有限存在导致这样的聚合不能大量发生.(3)C-S-H 中 Al[4]出现在桥四面体位置,其作用类似水化硅酸根单体,桥连二聚C-S-H形成更高聚合态的铝硅链.参考文献:[1] PING Y U,KIRKPATRICK R J,POE B,et al.Structure of calcium silicate hydrate(C-S-H):Near-,mid-,and far-infrared spectroscopy[J].Am Ceram Soc,1999,82(3):742-748.[2] THOMAS J J,CHEN J J,JENNINGS H M.Ca—OH bonding in the C-S-H gel phase of tricalcium silicate and white Portland cement pastes measured by inelastic neutron scattering[J].Chem Mater,2003,15(20):3813-3817.[3] CHEN J J,THOMAS J J,TAYLOR H F W,et al.Solubility andstructure of calcium silicate hydrate[J].Cem Concr Res,2004,34(9):1499-1519.[4] GRUTZEK M W.A new model for the formation of calcium silicate hydrate(C-S-H)[J].Mat Res Innovat,1999,3(3):160-170. [5] CONG Xian-dong,KIRKPATRICK R J.29Si MAS NMR study of the structure of calcium silicate hydrate[J].Advn Cem Bas Mat,1996,3(3):144-156.[6] SUN G K,YOUNG J F,KIRKPATRICK R J.The role of Al in C-S-H:NMR, XRD,and compositional results for precipitated samples[J].Cem Concr Res,2006,36(1):18-29.[7] RICHARDSON I G.The nature of C-S-H in hardened cements [J].Cem Concr Res,1999,29(8):1131-1147.[8] TAYLOR H F W.Nanostructure of C-S-H:Current status[J].Advn Cem Bas Mat,1993,1(1):38-46.[9] TAYLOR H F W.Proposed structure for calcium silicate hydrate gel [J].Am Ceram Soc,1986,69(6):464-467.[10] RICHARDSON I G,GROVES G W.Models for the composition and structure of calcium silicate hydrate(C-S-H)gel in hardened tricalcium silicate pastes[J].Cem Concr Res,1992,22(6):1001-1010. [11] RICHARDSON I G.Tobermorite/jennite-and tobermorite/calcium hydroxide-based models for the structure of C-S-H:Applicability to hardened pastes of tricalcium silicate,dicalci-um silicate,Portland cement,and blends of Portland cement with blast-furnace slag,metakaolin,or silica fume[J].Cem Concr Res,2004,34(9):1733-1777.[12] YOUSUF M,MOLLAH A,FELIX L U,et al.An X-ray diffraction (XRD) and Fourier transform infrared spectroscopic(FT-IR)characterization of the speciation of arsenic(V)in Portland cement type-V[J].Sci Total Environ,1998,224(1):57-68.[13] LILKOV V,DIMITROVA E,PETROV O E.Hydration process of cement containing fly ash and silica fume:The first 24hours[J].Cem Concr Res,1997,27(4):577-588.[14] RICHARDSON I G.The calcium silicate hydrates[J].Cem Concr Res,2008,38(2):137-158.[15] MOHAN K,TAYLOR H F W.A trimethylsilylation study of tricalcium silicate pastes[J].Cem Concr Res,1982,12(1):25-31.[16] HE Zhen,LIANG Wen-quan,WANG Lei,et al.Synthesis of C3Sby sol-gel technique and its features[J].Journal of Wuhan University of Technology:Mater Sci Ed,2010,25(1):138-141.[17] CHEN J J,THOMAS J J,JENNINGS H M.Decalcification shrinkageof cement paste[J].Cem Concr Res,2006,36(5):801-809.。
天然低共熔溶剂提取黄酮类化合物的研究进展
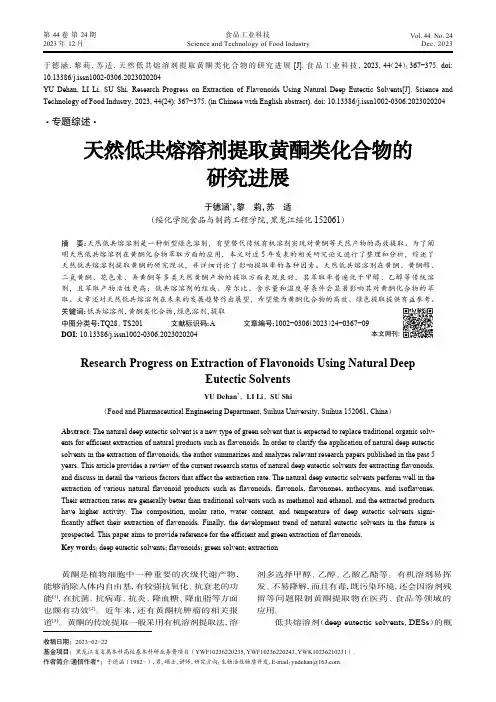
于德涵,黎莉,苏适. 天然低共熔溶剂提取黄酮类化合物的研究进展[J]. 食品工业科技,2023,44(24):367−375. doi:10.13386/j.issn1002-0306.2023020204YU Dehan, LI Li, SU Shi. Research Progress on Extraction of Flavonoids Using Natural Deep Eutectic Solvents[J]. Science and Technology of Food Industry, 2023, 44(24): 367−375. (in Chinese with English abstract). doi: 10.13386/j.issn1002-0306.2023020204· 专题综述 ·天然低共熔溶剂提取黄酮类化合物的研究进展于德涵*,黎 莉,苏 适(绥化学院食品与制药工程学院,黑龙江绥化 152061)摘 要:天然低共熔溶剂是一种新型绿色溶剂,有望替代传统有机溶剂实现对黄酮等天然产物的高效提取。
为了阐明天然低共熔溶剂在黄酮化合物萃取方面的应用,本文对近5年发表的相关研究论文进行了整理和分析,综述了天然低共熔溶剂提取黄酮的研究现状,并详细讨论了影响提取率的各种因素。
天然低共熔溶剂在黄酮、黄酮醇、二氢黄酮、花色素、异黄酮等多类天然黄酮产物的提取方面表现良好,其萃取率普遍优于甲醇、乙醇等传统溶剂,且萃取产物活性更高;低共熔溶剂的组成、摩尔比、含水量和温度等条件会显著影响其对黄酮化合物的萃取。
文章还对天然低共熔溶剂在未来的发展趋势作出展望,希望能为黄酮化合物的高效、绿色提取提供有益参考。
关键词:低共熔溶剂,黄酮类化合物,绿色溶剂,提取本文网刊: 中图分类号:TQ28、TS201 文献标识码:A 文章编号:1002−0306(2023)24−0367−09DOI: 10.13386/j.issn1002-0306.2023020204Research Progress on Extraction of Flavonoids Using Natural DeepEutectic SolventsYU Dehan *,LI Li ,SU Shi(Food and Pharmaceutical Engineering Department, Suihua University, Suihua 152061, China )Abstract :The natural deep eutectic solvent is a new type of green solvent that is expected to replace traditional organic solv-ents for efficient extraction of natural products such as flavonoids. In order to clarify the application of natural deep eutectic solvents in the extraction of flavonoids, the author summarizes and analyzes relevant research papers published in the past 5years. This article provides a review of the current research status of natural deep eutectic solvents for extracting flavonoids,and discuss in detail the various factors that affect the extraction rate. The natural deep eutectic solvents perform well in the extraction of various natural flavonoid products such as flavonoids, flavonols, flavonones, anthocyans, and isoflavones.Their extraction rates are generally better than traditional solvents such as methanol and ethanol, and the extracted products have higher activity. The composition, molar ratio, water content, and temperature of deep eutectic solvents signi-ficantly affect their extraction of flavonoids. Finally, the development trend of natural eutectic solvents in the future is prospected. This paper aims to provide reference for the efficient and green extraction of flavonoids.Key words :deep eutectic solvents ;flavonoids ;green solvent ;extraction黄酮是植物细胞中一种重要的次级代谢产物,能够消除人体内自由基,有较强抗氧化、抗衰老的功能[1],在抗菌、抗病毒、抗炎、降血糖、降血脂等方面也颇有功效[2]。
外文翻译(英文)纳米结构-Bi2S3的制备及其特性
Preparation of Nanostructures andPhotoluminescence Bi2S3ZHANG Weixin,QIU Mo,ZHANG Junjun,Y ANG Zeheng,CHEN Min (School of Chemical Engineering, Hefei University of Technology, Anhui Key Laboratory of Controllable Chemical Reaction & Material Chemical Engineering, Hefei 230009, China )Abstract: Bismuth nitrate and sodium sulfide as raw material, two-step hydrothermal method was successfully prepared at 100℃Bi2S3 orthorhombic micro ring; Youyi bismuth nitrate and thiourea as the raw material, the use of step hydrothermal synthesized at 150℃with Orthorhombic's Bi2S3 nanorods. Respectively, X-ray diffraction, field emission scanning electron microscopy, transmission electron microscopy and fluorescence spectrometry and other means of final product testing phase, morphology and properties were characterized to explore the mechanism of ring formation Bi2S3microns. The results showed that: Bi2S3micron diameter ring 1 ~ 1.5μm, external diameter of 1.5 ~ 2μm, the average size of about 100nm in the nano-grains assembled. Bi2S3 nanorods diameter of about 125nm, a length of 1 ~ 2μm. Bi2S3 micron and nano-rod Bi2S3 ring emission peak at 447nm and 470nm are located at, Bi2S3micron emission peak position of ring Bi2S3nanorods compared to the emission peak position was a blue shift.Key words:bismuth sulfide; hydrothermal method; nanostructure;photoluminescenceThe performance of nano-materials depends not only on its own structure and composition, but also the size and shape and materials are closely related, and thus the size of nano-materials, structure and morphology of control synthesis to optimize material properties, not only has important Theoretical significance but also broaden the application areas of nano-materials, which has become the field of synthetic chemistry and materials research focus of a front, causing researchers [1] wide interest. Because of its central ring has a very special hole and has many special properties. For example: Aizpurua other study found that the hole in the center gold ring has a strong effect of uniform magnetic field, which makes research in sensing and spectroscopy can be used as nano-hole resonance to support or test other smaller nano-structured materials . [2] In addition, Rothman magnetic ring and other materials found in high density magnetic storage and magnetic random access memory also has potential practical applications. [2]The vulcanized bismuth(Bi2S3) is a kind of important semiconductor material, its band gap is a 1.2~1.7 evs, give or get an electric shock in the thermal, optoelectronics and electrochemistry[3 –5] keep aspects like hydrogen,etc to have potential application worth.In recent years, Na rice the composition of the structure vulcanized bismuth caused the extensive concern of the researcher. Currently, at Na rice structure the vulcanizedbismuth contain a lot of wires that report, mainly have a Na rice[the 6], Na rice is good[7], Na rice necklace[8] and pan-like in shape[5] and rose-like in shape[9] etc. construction structure.The Li waits[5] with the chlorination bismuth is in the hydrochloric acid aqueous solution water solution income chlorination oxidizing bismuth for forerunner body, with sulfur generation An for sulfur source, in 60℃often press down to make from the diameter about the 30 nms, length for the Na rice of the 150~200 nms rod weave of average diameter for the thin pan-like in shape vulcanized bismuth of 2 μm. The thou national prosperity waits[9] with just the right amount of laurel acis the sulfur An salt(salt of 2-undecy 1-1-dithioureido-ethyl- imidazoline, SUDEI) for surface live agent, take chlorination bismuth and sulfur generation Mao An as raw material, adopt melting agent thermal legal system have the rose-like in shape spheroid(diameter about one μm) structure that is applied by the slab-like in shape vulcanized bismuth curl overlay.Also have the jot the search concerning vulcanized bismuth nanotube to report moreover.For example, is firm and uncompromising to wait[10] take the nitric acid bismuth and the vulcanized sodium as to respond raw material, adopt water thermal law to respond a 12h under 120℃and made a vulcanized bismuth nanotube.The experiment takes the nitric acid bismuth and the vulcanized sodium as raw material, under the sistuation that didn't make use of anymold plate, adopt two water thermal composition law, successfully made vulcanized bismuth micron ring.Inquired into the forming mechanism of the vulcanized bismuth micron ring.Rice for carrying on a compare with the vulcanized bismuth micron ring gaining in the structure, performance, and then adopting hot legal system of one-step water to have vulcanized bismuth Na pared the luminescence quality of these two kinds of different facial look vulcanized bismuths.1. Test1.1 The preparation of sampleThe raw material that experiment uses for the vulcanized sodium, have no water ether, nitric acid bismuth, sulfur Mao, 16 alkyl three A radicle bromines to turn An and sulfuric acid.Above the trying an agent all tries an agent for the analysis purely domestic chemistry, the experiment is used water as distilled water.Two water thermal law makes the step of Bi2S3 micron ring as follows:Square one water is hot:Call to take a 0.05 gs 16 alkyls three A radicle bromines turn An(cetyl trimethyl ammonium bromide, CTAB) to put into a 150 mL the beaker and join 40 mL distilled water, then put beaker on the magnetic force stirrer constantly the rabbling make CTAB resolve full.Call again to take the 0.2 g nitric acid bismuth to put to go into beaker, go on to mix blend certain time.Then hang a muddy liquid ofincome to transfer an inner lining the 50 mL high pressure pot gathering four fluorine ethylenes amid, place again to take out after the constant temperature 7h in 100℃ovens, natural cooling, use distilled water to wash away dirt sediments for many times, then get forerunner thing.The second treads water thermal:Will up gain a forerunner thing to put to go into prosperous have a 40 mL of in the beaker of distilled water, then put the beaker to constantly mix blend on the magnetic force stirrer, again use to move a liquid tube to move to take a little amount solution concentration to go into beaker for the 0.6 mol/L vulcanized sodium drop and go on to mix blend certain time.Hang a muddy liquid of income to transfer an inner lining the 50 mL high pressure pot gathering four fluorine ethylenes amid, place again to take out after the constant temperature 4h in 100℃ovens, natural cooling, use distilled water to wash away dirt sediments for many times.Sparse sulfuric acid dissolution:Will up gain sediments to put to go into prosperous have a 20 mL of concentration for the beaker of 2 mol/L sparse sulfuric acid solution, the indoor temperature stat after placing about the 8 hs uses distilled water, have no water ether wash away dirt sediments for many times and dry in 60℃it, then get Bi2S3 micron ring.The one-step water thermal law makes the step of the rod of the Bi2 S3 Na rice as follows:Call to take the 0.1 g nitric acid bismuth and 0.2 g sulfur Mao to put into a 150 mL the beaker and join 40 mL distilled water,then put beaker on the magnetic force stirrer constantly rabbling, receive black to hang a muddy liquid.Hang a muddy liquid of this black to take out after transfering to the apposition in the 50 mL high pressure pot in the constant temperature 14h in 150℃ovens, natural e distilled water and have no water ether to wash away dirt sediments for many times, the sample dries in 60℃, then get the Bi2S3 Na rice rod. 1.2 Outcome tokenUse D/max –xrd type the X shoot wire Yan to shoot(X-ray diffraction, XRD) instrument to carry on thing phase analysis to the sample.Take Cu K α as to radiate a source, λ =0.15418 nms, take care of the voltage as 40 kvs, take care of the current as 100 nms, scan range in 10 °~70 °.Use the accelerating voltage as JEOL of the 10 kvs 7500 B type the field firing Hitachi of scanning the electric mirror(field-emission scan-ning electron microscopy, FESEM) and the accelerating voltage 200 kvs –800 deeply shoot electron micorscope(Transmission elec-tron microscopy, TEM)the facial look and structure of the token e Hitachi F–4500 fluorescence spectrophotometers(fluorospectro-ph- otometry, PL), the excitation light source testings the fluorescence spectrum of sample under the indoor temperature for the Xe lamp.2. Result and discussion2.1 XRD of outcome is analyticalFigure 1 is two water thermal law and one-step water thermal lawincome outcome of XRD table.Figure 1 amid of table wire 1 and table wire 2 difference be thermal for two water law and one-step water thermal law income outcome of XRD table.All can the beacon change into the quadrature phase Bi2S3.(JCPDF, No.06–0333)The reaction temperature of two water thermal law responds for 100℃, one-step water thermal law carrying on under 150℃.From figure 1 amid can discover:One-step water thermal law's gaining the Yan of outcome to shoot peak intensity is higher than two water thermal the law gain outcome.Respond a temperature exaltation, the Yan of sample shoots peak enhancement, the quasi peak breadth narrows down, this instruction with respond temperature scale - up, outcome crystal exaltation for turning a degree.Fig.1 X-ray diffraction (XRD) patterns of the products preparedvia the two-step hydrothermal method and the one-step hydrothermal method2.2 The Bi2 S3 micron annular becomes mechanism analysisForming mechanism of by way of to Bi2S3 micron ring progress quest, made use of FESEM and TEM to observe square one water thermal system of the facial look and structure of the forerunner thing.Figure 2 is the FESEM and TEM photograph of Bi2S3 micron ring forerunner thing.From the figure 2 as it is thus clear that:Forerunner thing from a great deal of biscuit-like in shape circle slab composition, it unipole the diameter of the biscuit-like in shape circle slab is about 1~2 μ ms, thickness is 300~500 nms.Passing Gao Bei's FESEM photograph can observe a forerunner thing further of circular biscuit-like in shape structure.(see figure 2-b) The illustration of left bottom corner is a forerunner thing side - view in the figure 2-b of high double FESEM photograph, can discover circular biscuit from a lot of Na rice circle slab rule earth the overlay apply together but forming of several structure, Na rice circle the slab is very thin, thickness for 25~50 nm.The TEM photograph of Bi2 S3 micron ring forerunner thing further recognizes that the forerunner thing presents a solid fo rm, the diameter is about 2 μ m.(see figure 2 cs)Contrast figure 2 can discover:End outcome Bi2S3 and forerunner thing the fundamental kept consistent on the diameter and the thickness.Fig.2 FESEM and TEM photographs of the precursors of Bi2S3Figure 3 for predict according to the above-mentioned result of the possible forming process of the vulcanized bismuth micron ring diagrammatic drawing.First, Bi(NO3)3enter water solution to receive a biscuit-like in shape forerunner thing in 100℃water thermal condition.Then, the sulfur ion ahead gets rid of an outside layer of thing surface and bismuth ion the reaction forming Bi2S3 housings.Along with the progress for responding, the thickness of Bi2 S3 housingses enlarges gradually, inside the forerunner thing of the layer pit continuously diminish.Because the sulfur ion in the solution is that the quantity isn't enough, responds progress after a period of time the thickness of the Bi2 S3 housingses will because of sulfur ionic scarcity but stop enlarging, have to arrive hard forerunner like this the thing check –Bi2 S3 housing form structure.End, check the forerunner thing that hasn't responded complete to resolve with the sparse sulfuric acid aqueous solution of 2 mol/L, forminged Bi2 S3 micron ring.Fig.3 Schematic illustration for the formation of Bi2S3Microring2.3 The luminescence of the Na rice structure Bi2 S3The size, facial look and crystalline degree etc. of Na rice material will effect the luminescence quality of material to some extent.[11–12] Bi2S3 micron rings and Na rice are good to measure while stiring up the wavelength as 325 nms of fluorescence spectrum.Can discover:2 kinds of outcomes all have more apparent fluorescence luminescence peak, the Bi2S3 micron ring luminescence peak is located in a 447 nm, the luminescence peak of the Na rice rod form Bi2S3 is located in a 470 nm, the Bi2S3 micron ring luminescence peak is compared to a Na rice rod the luminescence peak of the form Bi2S3 obviously took place blue to move.This may be in order to constituting the Na rice of Bi2S3 micron ring opposite Bi2S3 Na rice rod Cu of grain and having more apparent size effect and resulting in.3. Conclusion(1) With Bi(NO3)3H2O5 and Na2SH2O are raw materials, adopt two water thermal law, make from the average size about is the Na rice bore of grain construction but beco me with 100 nms for the 1~1.5 μm andexternal diamete r for the quadrature of 1.5~2 μm crystal train Bi2S3 micron ring;Again with the Bi(NO3)35 H2O and sulfur Mao for raw material, adopt one-step water thermal law, make a diameter about the 125 nm, length for the quadratur e of 1~2 μm crystal train Bi2S3 Na rice rod.(2)The facial look of outcome as to it's the fluorescence quality contain important impact.The luminescence peak of Bi2S3micron ring and Na rice rod-like in shape Bi2S3is located in 447 nm and 470 nm respectively, Bi2 S3 micron ring's giving out light the location of peak is compared to a Na rice rod the location of luminescence peak of the form Bi2S3 obviously took place the blue move, may be because constitute the Bi2S3 micron ring of Na rice grain opposite Bi2S3 Na rice rod the Cu has more apparent size effect.Reference:[1] PENG X. Nanomechanical oscillations in a single-C60 transistor [J]. Nature, 2000, 407: 57–60.[2]HU.α-Fe2O3 nanorings prepared by a microwave-assisted hydrothermal process and their sensing properties [J]. Adv Mater, 2007, 19(17): 2324–2330.[3]KAMAT. Photoelectrochemical behavior of Bi2S3 nanoclusters and nanostructured thin films [J]. Langmuir, 1998, 14(12): 3236–3241.[4] LIUFU. Assembly of one-dimensional nanorods into Bi2S3 films with enhanced thermoelectric transport properties [J]. Appl Phys Lett, 2007, 90(11): 112106.[5] LI. Topotactic transformation of single-crystalline precursor discs into disc-like Bi2S3 nanorod networks [J]. Adv Funct Mater, 2008, 18(8): 1194–1201.[6]LI. Synthesis and electrical transport properties of single-crystal antimony sulfide nanowires [J]. J Phys Chem C, 2007, 111: 17131–17135.[7]Shu Guang Chen Hong wei Liao The preparation and token of vulcanized bismuth(Bi2 S3) Na rice rod[J]. Nonferrous metal in Hunan, 2007, 23:(6) 33 – 35.[8]LUDOVICO. Large-scale synthesis of ultrathin Bi2S3 necklace nanowires [J]. Angewandte Chem, Int Ed, 2008, 47(20): 3814–3821. [9]GU Guohua,.W ANG Wei, LüWeili, et al. Rare Met Mater Eng (in Chinese), 2007, 36: 108–111.[10]ZHU Gangqiang, LIU Peng, ZHOU Jianping, et al. Chem J Chin Univ (in Chinese). 2008, 29(2): 240–243.[11] TIAN Hongye, HE Rong, GU Hongchen. J Funct Mater (in Chinese), 2005, 36(10): 1564–1567.[12] ZENG Huidan, QIU Jianrong, GAN Fuxi, et al. J Chin Ceram Soc (in Chinese), 2003, 31(10): 974–980.。
Catalysisand-Catalyst
5
Activation Energy
Activation Energy : The energy required to overcome the reaction barrier. Usually given a symbol Ea or ∆G≠
The last step cannot occur in a Langmuir-Hinshelwood mechanism
17
Eley-Rideal mechanism
Example
The reaction
A2 + 2B = 2AB
may have the following Eley-Rideal mechanism
The Activation Energy (Ea) determines how fast a reaction occurs, the higher Activation barrier, the slower the reaction rate. The lower the Activation barrier, the faster the reaction
(2) Supported Catalyst requires a high surface area support to disperse the primary catalyst the support may also act as a co-catalyst (bi-functional) or secondary catalyst for the reaction (promoter)
AB* = AB + *
Carbon Nanotube-Quenched Fluorescent Oligonucleotides
Subscriber access provided by SHANGHAI UNIVJournal of the American Chemical Society is published by the American ChemicalSociety. 1155 Sixteenth Street N.W., Washington, DC 20036ArticleCarbon Nanotube-Quenched Fluorescent Oligonucleotides:Probes that Fluoresce upon HybridizationRonghua Yang, Jianyu Jin, Yan Chen, Na Shao, Huaizhi Kang,Zeyu Xiao, Zhiwen Tang, Yanrong Wu, Zhi Zhu, and Weihong TanJ. Am. Chem. Soc., 2008, 130 (26), 8351-8358 • DOI: 10.1021/ja800604z • Publication Date (Web): 05 June 2008Downloaded from on February 8, 2009More About This ArticleAdditional resources and features associated with this article are available within the HTML version:•Supporting Information•Links to the 3 articles that cite this article, as of the time of this article download•Access to high resolution figures•Links to articles and content related to this article•Copyright permission to reproduce figures and/or text from this articleCarbon Nanotube-Quenched Fluorescent Oligonucleotides:Probes that Fluoresce upon HybridizationRonghua Yang,*,†,‡Jianyu Jin,†Yan Chen,‡Na Shao,†Huaizhi Kang,‡Zeyu Xiao,‡Zhiwen Tang,‡Yanrong Wu,‡Zhi Zhu,‡and Weihong Tan*,‡Beijing National Laboratory for Molecular Sciences,College of Chemistry and MolecularEngineering,Peking Uni V ersity,Beijing100871,China,and Center for Research at theBio/Nano Interface,Department of Chemistry and Department of Physiology and Functional Genomics,Shands Cancer Center,UF Genetics Institute,McKnight Brain Institute,Uni V ersity of Florida,Gaines V ille,Florida32611-7200Received January24,2008;E-mail:yangrh@;tan@chem.ufl.eduAbstract:We report an effective,novel self-assembled single-wall carbon nanotube(SWNT)complex with an oligonucleotide and demonstrate its feasibility in recognizing and detecting specific DNA sequences in a single step in a homogeneous solution.The key component of this complex is the hairpin-structured fluorescent oligonucleotide that allows the SWNT to function as both a“nanoscaffold”for the oligonucleotide and a“nanoquencher”of thefluorophore.Given this functionality,this carbon nanotube complex represents a new class of universalfluorescence quenchers that are substantially different from organic quenchers and should therefore have many applications in molecular engineering and biosensor development. Competitive binding of a DNA target and SWNTs with the oligonucleotide results influorescence signal increments relative to thefluorescence without a target as well as in markedfluorescence quenching.In contrast to the common loop-and-stem configuration of molecular beacons(MBs),this novelfluorescent oligonucleotide needs only one labeledfluorophore,yet the emission can be measured with little or no background interference.This property greatly improves the signal-to-background ratio compared with those for conventional MBs,while the DNA-binding specificity is still maintained by the MB.To test the interaction mechanisms of thefluorescent oligonucleotide with SWNTs and target DNA,thermodynamic analysis and fluorescence anisotropy measurements,respectively,were applied.Our results show that MB/SWNT probes can be an excellent platform for nucleic acid studies and molecular sensing.IntroductionThe continuous development offluorogenic probes for molecular interaction studies and ultrasensitive bioanalysis is critically important to medical diagnosis,disease prevention, and drug discovery.This explains the attention given to such well-known DNA hybridization probes as Taqman,1protease probes,2and molecular beacons(MBs).3,4In general,an MB is a dual-labeled oligonucleotide probe with a hairpin-shaped structure in which the5′and3′ends are self-complementary, bringing afluorophore and a quencher into close proximity and resulting influorescence quenching of thefluorophore.3Binding of this probe to a complementary nucleic acid target creates a relatively rigid probe-target hybrid,causing disruption of the hairpin stem and thereby restoring thefluorescence of the fluorophore.The unique thermodynamics and specificity of MBs5–7in comparison with linear DNA probes have led to their widespread use in quantitative PCR,8–11protein-DNA interac-tion studies,12–14and visualization of RNA expression in living cells.15–18*Corresponding author.Phone:(352)846-2410(W.T.).†Peking University.‡University of Florida.(1)Holland,P.M.;Abramson,R.D.;Watson,R.;Gelfand,D.H.Proc.Natl.Acad.Sci.U.S.A.1991,88,7276–7280.(2)Matayoshi,E.D.;Wang,G.T.;Krafft,G.A.;Erickson,J.Science1990,247,954–958.(3)Tyagi,S.;Kramer,F.R.Nat.Biotechnol.1996,14,303–308.(4)(a)Yang,C.J.;Medley,C.D.;Tan,W.H.Curr.Pharm.Biotechnol.2005,6,445–452.(b)Marras,S.A.E.Methods Mol.Biol.2006,335, 3–16.(5)Bonnet,G.;Tyagi,S.;Libchaber,A.;Kramer,F.R.Proc.Natl.Acad.Sci.U.S.A.1999,96,6171–6176.(6)Tsourkas,A.;Behlke,M.A.;Rose,S.D.;Bao,G.Nucleic Acids Res.2003,31,1319–1330.(7)Bonnet,G.;Krichevsky,O.;Libchaber,A.Proc.Natl.Acad.Sci.U.S.A.1998,95,8602–8606.(8)Fang,Y.;Wu,W.-H.;Pepper,J.L.;Larsen,J.L.;Marras,S.A.E;Nelson,E.A.;Epperson,W.B.;Christopher-Hennings,J.J.Clin.Microbiol.2002,40,287–291.(9)Poddar,S.K.Mol.Cell.Probes2002,14,25–32.(10)Roy,S.;Kabir,M.;Mondal,D.;Ali,I.K.;Petri,W.A.,Jr.;Haque,R.J.Clin.Microbiol.2005,43,2168–2172.(11)Feldman,S.H.;Bowman,b Anim.(NY)2007,36(9),43–50.(12)Li,J.W.J.;Fang,X.H.;Schuster,S.M.;Tan,W.H.Angew.Chem.,Int.Ed.2000,39,1049–1052.(13)Li,J.W.J.;Fang,X.H.;Tan,mun.2002,292,31–40.(14)Orru,G.;Ferrando,M.L.;Meloni,M.;Liciardi,M.;Savini,G.;DeSantis,P.J.Virol.Methods2006,137,34–42.(15)Fang,X.H.;Mi,Y.M.;Li,J.W.J.;Beck,T.;Schuster,S.;Tan,W.H.Cell Biochem.Biophys.2002,37,71–81.(16)Bratu,D.P.;Cha,B.J.;Mhlanga,M.M.;Kramer,F.R.;Tyagi,S.Proc.Natl.Acad.Sci.U.S.A.2003,100,13308–13313.(17)Mhlanga,M.M.;Vargas,D.Y.;Fung,C.W.;Kramer,F.R.;Tyagi,S.Nucleic Acids Res.2005,33,1902–1912.Published on Web06/05/200810.1021/ja800604z CCC:$40.75 2008American Chemical Society J.AM.CHEM.SOC.2008,130,8351–835898351While MBs have been employed in a broad spectrum of applications,they have also demonstrated significantflaws.For instance,in principle,thefluorophore should be quenched completely by the quencher in the stem-closed form.In reality, however,the residualfluorescence usually varies,which greatly limits detection sensitivity.In addition,MBs are prone to false-positive signals as a result of endogenous nuclease degradation and nonspecific binding by DNA-or RNA-binding proteins. Finally,synthesizing an MB is a complicated task.Specifically, the quality of the synthesis and purification of the probe affect the increment offluorescence intensity upon hybridization for a given target.Efforts to solve these problems have included the following strategies:introducing novel signaling schemes,19–22 exploring nanocomposites,23–25synthesizing the probe molecules with nuclease-resistant backbones or locked nucleic-acid bases,26–29and making better quenchers using rational molecular design coupled with sophisticated synthesis.30–33In general, however,effective solutions to the problems enumerated above are limited,and this has driven the search for new methods and materials.These new types of analytical tools for life science and biotechnology have been created by combining the highly specific recognition ability of biomolecules with the unique structural character of inorganic nanomaterials such as nanoc-rystals,nanotubes,and nanowires.34,35In particulary,carbon nanotubes are molecular wires that have become the leading building blocks for nanomaterials and have shown great potential in electronics,optics,mechanics,and biosensing.36–39The interactions of single-wall carbon nanotubes(SWNTs)with biological molecules have been intensively studied in recent years.SWNTs that are covalently or noncovalently attached by nucleic acids40–42or proteins44–46have been shown to be effective for interaction studies40separation of nanotubes,41and in applications as biosensors42–44and drug transporters.45 Single-stranded DNA(ssDNA)has recently been demon-strated to interact noncovalently with SWNTs.40,41The ssDNA molecules form stable complexes with individual SWNTs, wrapping around them by means ofπ-stacking interactions between the nucleotide bases and the SWNT sidewalls.Double-stranded DNA(dsDNA)has also been proposed to interact with SWNTs,47but its affinity is significantly weaker than that of ssDNA.This difference in the binding interactions of carbon nanotubes with ssDNA and dsDNA has provided the basis for their use in molecular recognition and detection of DNA.48–55 Most of these applications have been prompted by changes in electrochemical properties common to SWNTs,48–53but a few are based on absorption and near-infraredfluorescence of the carbon nanotubes.54,55Recently,and more relevant to the purpose of this study, scattered examples of noncovalent interactions between SWNTs and organicfluorophores orfluorophore-labeled biomolecules have been reported.38,56,57Photophysical studies have found that SWNTs can act collectively as quenchers for thefluorophores.57(18)Santangelo,P.;Nitin,N.;Laconte,L.;Woolums,A.;Bao,G.J.Virol.2006,80,682–688.(19)Chen,L.H.;McBranch,D.W.;Wang,H.L.;Helgeson,R.;Wudl,F.;Whitten,D.G.Proc.Natl.Acad.Sci.U.S.A.1999,96,12287–12292.(20)Tyagi,S.;Marras,S.A.E.;Kramer,F.R.Nat.Biotechnol.2000,18,1191–1196.(21)Du,H.;Disney,M.D.;Miller,B.L.;Krauss,T.D.J.Am.Chem.Soc.2003,125,4012–4013.(22)Stoermer,R.L.;Cederquist,K.B.;McFarland,S.K.;Sha,M.Y.;Penn,S.G.;Keating,C.D.J.Am.Chem.Soc.2006,128,16892–16930.(23)Dubertret,B.;Calame,M.;Libchaber,A.J.Nat.Biotechnol.2001,19,365–370.(24)Seferos,D.S.;Giljohann,D.A.;Hill,H.D.;Prigodich,A.E.;Mirkin,C.A.J.Am.Chem.Soc.2007,129,15477–15479.(25)Maxwell,D.J.;Taylor,J.R.;Nie,S.M.J.Am.Chem.Soc.2002,124,9606–9612.(26)Braasch,D.A.;Corey,D.R.Chem.Biol.2001,8,1–7.(27)Tsourkas,A.;Behlke,M.;Bao,G.Nucleic Acids Res.2002,30,5168–5174.(28)Kuhn,H.;Demidov,V.V.;Coull,J.M.;Fiandaca,M.J.;Gildea,B.D.;Frank-Kamenetskii,M.D.J.Am.Chem.Soc.2002,124,1097–1103.(29)Wang,L.;Yang,C.J.;Medley,C.D.;Benner,S.A.;Tan,W.H.J.Am.Chem.Soc.2005,127,15664–15665.(30)Xia,W.;Whitten,D.;McBranch,D.U.S.Patent2005030579,2005.(31)Cook,R.M.;Lyttle,M.;Dick,D.U.S.Patent2001-US15082,2001.(32)May,J.P.;Brown,L.J.;Rudloff,I.;Brown,mun.2003,8,970–971.(33)Yang,C.J.;Lin,H.;Tan,W.H.J.Am.Chem.Soc.2005,127,12772–12773.(34)LaVan,D.A.;Lynn,D.M.;Langer,R.Nat.Re V.Drug Disco V ery2002,1,77–84.(35)Niemeyer,C.M.Angew.Chem,Int.Ed.2001,40,4128–4158.(36)Dresselhaus,M.S.;Dresselhaus,G.;Eklund,P. C.Science ofFullerenes and Carbon Nanotubes;Academic Press:San Diego,1996;pp1-985.(37)Tasis,D.;Tagmatarchis,N.;Bianco,A.;Prato,M.Chem.Re V.2006,106,1105–1136.(38)Britz,D.A.;Khlobystov,A.N.Chem.Soc.Re V.2006,35,637–659.(39)Valca´rcel,M.;Ca´rdenas,S.;Simonet,B.M.Anal.Chem.2007,79,4788–4797.(40)Zhang,M.;Jagota,A.;Semke,E.D.;Bruce,A.;Diner,B.A.;Mclean,R.S.;Lustig,S.R.;Richardson,R.E.;Tassi,N.G.Nat.Mater.2003, 2,338–342.(41)Wang,S.;Humphreys,E.S.;Chung,S.-Y.;Delduco,D.F.;Lustig,S.R.;Wang,H.;Parker,K.N.;Rizzo,N.W.;Subramoney,S.;Chiang, Y.-M.;Jagota,A.Nat.Mater.2003,2,196–199.(42)Tang,X.W.;Bansaruntip,S.;Nakayama,N.;Yenilmez,E.;Chang,Y.I.;Wang,Q.Nano Lett.2006,6,1632–1636.(43)Chen,R.J.;Bangsaruntip,S.;Drouvalakis,K.A.;Kam,N.W.S.;Shim,M.;Li,M.Y.;Kim,W.;Utz,P.J.;Dai,H.J.Proc.Natl.Acad.Sci.U.S.A.2003,100,4984–4989.(44)So,H.M.;Won,K.;Kim,Y.H.;Kim,B.K.;Ryu,B.H.;Na,P.S.;Kim,H.;Lee,J.O.J.Am.Chem.Soc.2005,127,11906–11907.(45)Shim,M.;Shi Kam,N.W.;Dai,H.J.J.Am.Chem.Soc.2005,127,6021–6026.(46)Pantarotto,D.;Partidos,C.D.;Hoebeke,J.;Brown,F.;Kramer,E.;Briand,J.P.;Muller,S.;Prato,M.;Bianco,A.Chem.Biol.2003,10, 961–966.(47)Franchini,M.;Veneri,D.Ann.Hematol.2005,84,347–352.(48)Li,J.;Ng,H.T.;Cassell,A.;Fan,W.;Chen,H.;Ye,Q.;Koehne,J.;Han,J.;Meyyappan,M.Nano Lett.2003,3,597–602.(49)Davis,J.J.;Coleman,K.S.;Azamian,B.R.;Bagshaw,C.B.;Green,M.L.H.Chem.s Eur.J.2003,9,3732–3739.(50)Wang,J.;Liu,G.;Jan,M.R.J.Am.Chem.Soc.2004,126,3010–3011.(51)So,H.M.;Won,K.;Kim,Y.H.;Kim,B.K.;Ryu,B.H.;Na,P.S.;Kim,H.;Lee,J.O.J.Am.Chem.Soc.2005,127,11906–11907.(52)Staii,C.,Jr.Nano Lett.2005,5,1774–1778.(53)Hahm,J.;Lieber,C.Nano Lett.2004,4,51–54.(54)Star,A.;Tu,E.;Niemann,J.;Gabriel,J.P.;Joiner,C.S.;Valcke,C.Proc.Natl.Acad.Sci.U.S.A.2006,104,921–926.(55)Jeng,E.S.;Moll,A.E.;Roy,A.C.;Gastala,J.B.;Strano,M.S.Nano Lett.2006,6,371–375.(56)(a)Li,H.P.;Zhou,B.;Lin,Y.;Gu,L.R.;Wang,W.;Fernando,K.A.S.;Kumar,S.;Allard,L.;Sun,Y.P.J.Am.Chem.Soc.2004, 126,1014–1015.(b)Nakayama-Ratchford,N.;Bangsaruntip,S.;Sun, X.M.;Welsher,K.;Di,H.J.J.Am.Chem.Soc.2007,129,2448–2449.(c)Boul,P.J.;Cho,D.G.;Rahman,G.M.A.;Marquez,M.;Ou,P.Z.;Kadish,K.M.;Guldi,D.M.;Jonathan,L.;Sessler,J.L.J.Am.Chem.Soc.2007,129,5683–5687.(57)(a)Lu,Q.;Freedman,K.O.;Rao,R.;Lee,J.;Larcom,L.L.;Rao,A.M.;Ke,P.C.J.Appl.Phys.2004,96,6772–6775.(b)Jeng,E.S.;Moll,A.E.;Roy,A.C.;Gastala,J.B.;Strano,M.S.Nano Lett.2006, 6,371–375.(c)Kim,N.W.S.;O′Connell,M.;Wisdom,J.A.;Dai,H.J.Proc.Natl.Acad.Sci.U.S.A.2005,102,11600–11605.(e)Lin,S.J.;Keskar,G.;Wu,Y.N.;Wang,X.;Mount,A.S.;Klaine,S.J.;Moore,J.M.;Rao,A.M.;Ke,P.C.Appl.Phys.Lett.2006,89, 143118.8352J.AM.CHEM.SOC.9VOL.130,NO.26,2008A R T I C L E S Yang et al.Both energy-transfer and electron-transfer processes are con-sidered to be major deactivation pathways for excitedfluoro-phores on nanotube surfaces.While these results provide strong evidence that such quenching approaches might provide a basis forfluorescence sensing,we are unaware of any studies which have examined SWNTs from the perspective offluorescence restoration.37,39In this work,therefore,we explored the use of a self-assembled quenched complex offluorescent ssDNA and SWNTs as an efficient MB that canfluorescently detect single-nucleotide variations in DNA in homogeneous solution.The key features of this design are as follows.First,as noted above, ssDNA molecules wrap around individual SWNTs by means ofπ-stacking interactions between the nucleotide bases and the SWNT sidewalls.Next,because the SWNTs act as both a “nanoscaffold”for the ssDNA and a“nanoquencher”of the fluorophore,only one end of the ssDNA must be labeled with afluorophore.Under these conditions,the ssDNA molecules self-organize on the surface of the carbon nanotubes,completely quenching thefluorophore.Finally,in the presence of a target, competitive binding of the target and the carbon nanotubes with the ssDNA suppresses thefluorescence quenching,allowing fluorescence-signal enhancement that is large relative to that without a target.This combination of properties results in fluorescence enhancement that is sensitive and specific to the perfectly complementary ssDNA.Furthermore,our novel design, which is based on a simple,cost-effective synthesis,was shown to have a large signal-to-background ratio,high thermostability, and exceptional DNA-binding selectivity.Therefore,from the standpoints of design and engineering,production,and overall function,self-assembled ssDNA-SWNT complexes such as the one studied here can easily replace conventional MBs. Experimental SectionGeneral Procedures.All of the DNA synthesis reagents were purchased from Glen Research.All of the DNA sequences were synthesized using an ABI3400DNA/RNA synthesizer.Fluorescein CPG was used for the synthesis offluorescent oligonucleotides. Fluorescence measurements were performed using a Hitachi F-4500fluorescence spectrofluorometer.Fluorescence anisotropy measure-ments were conducted using a Fluorolog-3model FL3-22spec-trofluorometer(HORIBA Jobin Yvon,Edison,NJ)with a200µL quartz cuvette.Transmission electron microscopy(TEM)was performed using a transmission microscope(Hitachi H-700). Samples for TEM analysis were prepared by pipetting5-25µL of the colloidal solutions onto standard holey carbon-coated copper grids.The grids were dried in air for>12h before they were loaded into the vacuum chamber of the electron microscope.The TEM samples were not subjected to heavy-metal staining or other treatments.Choice of Probe and Target DNA.In this work,a hairpin-structured(HP)oligonucleotide containing a19-base loop and a 6-mer stem was chosen as the recognition element(Table1).The MB1was designed by attachingfluorescein(FAM)and4-(4′-(dimethylamino)phenylazo)benzoic acid(Dabcyl)58to the3′and 5′ends,respectively,of the ssDNA strand.To examine the effect of SWNTs on thefluorescence quenching,the ssDNA was labeled only with FAM at the3′end in the HP probe2.The target ssDNA molecules4and5were19bases long;4was perfectly comple-mentary(pc)to the bases in the loop,while5contained a single-base mismatch(sm)with the loop.Probe3,a linear(LN)oligonucleotide labeled with FAM at the 3′end,was also designed in order to examine the effect of the hairpin structure onfluorescence quenching and target-binding selectivity.As shown in Table1,this oligonucleotide was31bases long,and the19bases in the middle of the strand were identical to the19bases in the loop of the HP probes.However,it did not have the complementary stem-forming bases on either end and thus could not form a hairpin structure.Fluorescence-Quenching and Hybridization Assays.The working solution containing thefluorescent oligonucleotide was obtained by dilution of the stock solution to a concentration of50 nM using phosphate-buffered saline(137mM NaCl,2.5mM Mg2+, 10mM Na2HPO4,and2.0mM KH2PO4,pH7.4).The as-grown SWNTs,purchased from Carbon Nanotechnologies,Inc.,were sonicated in DMF for5h to give a homogeneous black solution. An aliquot of the SWNT suspension[<3%(v/v)]was added to a phosphate buffer containing thefluorescent oligonucleotide and allowed to incubate for5-10min.A6-fold molar excess of complementary target4was then added to the nanotube-conjugate mixture.After this mixture was allowed to hybridize for∼3h at room temperature,the upper70%of the clear solution was received. The pellet,which contained impurities,aggregates,and undispersed SWNTs,was removed by ultracentrifugation,and the supernatant was collected.The control solution without target was obtained by addition of the same volume of water to the nanotube complex solution.The solubilized SWNTs by the ssDNA strands were mostly individual tubes and small bundles as revealed by transmission electron microscopy.59In order to compare the molecular recogni-tion ability of the nanotube-quenched complex with that of the conventional MB,similar titrations were done with the MB which had Dabcyl as the quencher.Kinetics and Thermal Profiles.To study the kinetics and time dependence of thefluorescence quenching of thefluorescent oligonucleotides by the carbon nanotubes,fluorescence spectra of solutions containing2and SWNTs in the absence or presence of4 were acquired at time intervals of20min,and their peak intensities at520nm were plotted as a function of time.For thermodynamic and temperature-dependent studies,thefluorescence of solutions containing2and SWNTs in the presence or absence of4was measured as a function of temperature.Results and DiscussionFluorescence Quenching and Hybridization Assay.Earlier studies have shown that afluorophore bound to the surface of carbon nanotubes is in fact quenched by them.38,56Therefore, when afluorophore is covalently linked to a biomolecule,the strong binding affinity of the biomolecule for carbon nanotubes is expected to offer a better means of producing highly efficient quenching of thefluorophore.57To confirm thesefindings to our satisfaction,we tested three different nucleic-acid detection methods,based on(i)the conventional MB1,(ii)the self-assembled carbon-nanotube complex of2(2-SWNT),and(iii) the self-assembled carbon-nanotube complex of3(3-SWNT). We obtained enhancements of thefluorescence emission of1-3 generated by the target DNA in the absence and the presence of SWNTs and evaluated the results in terms of the signal-to-(58)Marras,S.A.E.;Kramer,F.R.;Tyagi,S.Nucleic Acids Res.2002,30,e122.(59)See the Supporting Information.Table1.Designs of Probes and Target Oligonucleotidestype sequenceFAM-labeled MB(1)a5′-Dabcyl-CCTAGCTCTAAATCACTATGGTCGCGCTAGG-FAM-3′FAM-labeled HP(2)b5′-CCTAGCTCTAAATCACTATGGTCGCGCTAGG-FAM-3′FAM-labeled LN(3)c5′-CCTAGCTCTAAATCACTATGGTCGCCGATCC-FAM-3′pc-ssDNA(4)d5′-GCGACCATAGTGATTTAGA-3′sm-ssDNA(5)e5′-GCGACCATA C TGATTTAGA-3′a Molecular beacon.b Hairpin-structured probe.c Linear probe.d Per-fectly complementary target.e Single-base-mismatched target.J.AM.CHEM.SOC.9VOL.130,NO.26,20088353 Carbon Nanotube-Quenched Fluorescent Oligonucleotides A R T I C L E Sbackground ratio (S/B),defined as S/B )(F hybrid -F buffer )/(F probe -F buffer ),where F probe ,F buffer ,and F hybrid are the fluorescence intensities of the probe without target,the plain buffer solution,and the probe -target hybrid,respectively.In the absence of a target,the background fluorescence signals of 1-3in the phosphate buffer were first studied (Figure 1A).As expected,the background fluorescence observed from 1was weakest as a result of the formation of hairpin structure,which brings the fluorophore and the quencher into close proximity.For the other fluorescent oligonucleotides,the background fluorescence from 2was weaker than that from the ssDNA 3,perhaps as a result of quenching of the FAM fluorescence by the nearby guanine bases in 2.60,61The dotted lines in Figure 1A show the fluorescence emission spectra of 1-3in the presence of SWNTs.Upon excitation at the maximal absorption wavelength of FAM,all of the self-assembled nanotube complexes exhibited decreases in fluorescence intensity relative to that observed for the free fluorescent oligonucleotides under the same conditions.Interestingly,we noted that further fluorescence quenching by the SWNTs was observed even for the MB 1,indicating that the FAM fluorescence in the hairpin structure was not completely quenched by Dabcyl.In a recent study of noncovalent interactions of SWNTs with fluorescein derivatives,56b 67%quenching by SWNTs was observed.However,in our experiment,more than 98%quenching was observed for concentrations of 2ranging from 50to 200nM.The phenomena observed here provide evidence for tight binding of ssDNA on SWNTs.Specifically,the present nanotube-quenching approaches were found to be highly efficient in probing biomolecular interactions.Figure 1B shows the fluorescence emission spectra of free 1-3and their self-assembled SWNT complexes in the presence of the pc-ssDNA target petitive hybridization of 4and SWNTs with the fluorescent oligonucleotide suppresses fluo-rescence quenching of FAM,whose fluorescence was enhanced in comparison with that in the absence of target.There was a rather large variation in S/B in these assays because of the different background signals of the probes.The experimental results are summarized in Figure 2.In the absence of carbon nanotubes,the fluorescence intensity of 1was increased by addition of 4,but for the other fluorescent oligonucleotides,such enhancements of fluorescence intensity were not obvious.The S/Bs generated by the 6-fold excess of 4were 5.6,1.4,and 1.1for 1,2,and 3,respectively.The stronger background fluores-cences from 2and 3led to smaller S/Bs compared with the results of the MB assay.In contrast,the presence of SWNTs greatly reduced the background signals for all of the fluorescent oligonucleotides and thus led to large S/Bs.For example,the S/Bs for 1-3generated by the 6-fold excess of 4in the presence of SWNTs were 13.7,15.4,and 16.2,respectively,which is a significant improvement compared to the S/Bs in the absence of SWNTs.This comparison clearly demonstrates that the carbon nanotubes greatly improved the S/Bs and,consequently,the analytical sensitivities of the fluorogenic molecular probes.Figure 3shows the typical fluorescence emission response of 2-SWNT to increasing concentrations of 4.A dramatic increase in the FAM fluorescence intensity was observed as the DNA concentration increased from 15.0to 750nM.The detection limit (taken to be 3times the standard deviation in the blank solution)was 4.0nM,which is 8-fold lower than that of 1.Moreover,we observed that reducing the concentration of the DNA probe resulted in a lower detection limit.These results(60)Kurata,S.;Kanagawa,T.;Yamada,K.;Torimura,M.;Yokomaku,T.;Kamagata,Y.;Kurane,R.Nucleic Acids Res.2001,29,e34.(61)Dohno,C.;Saito,I.ChemBioChem 2005,6,1075–1081.Figure 1.Changes in the fluorescence emissions of 1-3in the phosphatebuffer caused by carbon nanotubes and/or the pc-ssDNA target 4.(A)Fluorescence emission spectra of solutions of 1,2,and 3in the absence (solid lines)and presence (dotted lines)of SWNTs.(B)Fluorescence emission spectra of solutions 1,2,and 3containing a 6-fold excess of 4in the absence (solid lines)and the presence (dotted lines)of SWNTs.The concentrations of 1-3were 50nM,and the excitation wavelength was 480nm.Figure parisons of the signal-to-background ratio (S/B)of thefluorescent oligonucleotides generated by a 6-fold excess of the pc-ssDNA target 4in the absence (gray bars)and presence (black bars)of SWNTs.The concentrations of 1-3were 50nM,and the excitation and emission wavelengths were 480and 520nm,respectively.Figure 3.Fluorescence emission spectra of 2-SWNT (50nM,λex )480nm)in the presence of different concentrations of 4.Inset:the fluorescence intensity ratio F /F 0(where F 0and F are the fluorescence intensities of 2-SWNT in the absence and presence,respectively,of 4)plotted against the logarithm of the concentration of 4.8354J.AM.CHEM.SOC.9VOL.130,NO.26,2008A R T I C L E S Yang et al.suggest that the proposed approach is potentially appropriate for quantification of nucleic acid content in physiological fields.Several reported MB sequences were synthesized without quencher.This significantly improved the S/B compared to values reported for the regular MBs,demonstrating that the present approach provides a universal fluorescent probe for bioanalysis.The quenching efficiencies of self-assembled nanotube complexes and gold nanoparticles were also compared.Because of their exceptional quenching capabilities,gold nanoparticles have been successfully used to construct fluorescent probes.23–25In the classic work of Dubertret’s group,for example,single-base-mismatch detection and efficient quenching (up to 99.96%under favorable conditions)were achieved by replacement of Dabcyl with 1.4-nm gold clusters (nanogold)in the MB.23However,their nanogold clusters are too small to develop surface plasmon resonances,and the gold -DNA linkage is unstable under the temperature cycling conditions of PCR.Moreover,the tedious processes involved in preparation of the nanoparticles and covalent labeling of the DNA with the nanoparticles hinder the application of gold clusters as a common approach for bioanalysis.While the present self-assembled SWNT complex has high quenching efficiency and single-base-mismatch detection ability equal to gold nanoparticles (see below),our design offers additional advantages,including simplicity of preparation and manipulation as well as greater stability.DNA Detection Specificity.A significant advantage of MBs stems from the high degree of specificity with which they can recognize target sequences.3,23Notwithstanding this performance,the self-assembled nanotube complex shows the same ability to discriminate between the perfect target and the mismatched one,thus outperforming MBs.This assess-ment is based on the basic competition between unimolecular hairpin formation and bimolecular probe -target hybridiza-tion.Our results showed that addition of a low concentration of a noncomplementary DNA had little effect on the fluorescence of either 1or 2-SWNT,confirming the high specificity of the hairpin structure.However,a high concen-tration of the noncomplementary DNA results in a large background signal for 2-SWNT due to competitive binding of the DNA and 2with the carbon nanotubes.The pc-ssDNA target 4and the sm-ssDNA target 5were then used to compare the DNA detection specificities of 1and 2-SWNT.Figure 4displays fluorescence emission spectra of 1(50nm)in the presence of 4or 5(100nm).Both targets increased the fluorescence emission of 1,and the fluorescence enhance-ment by the sm target 5was 82%of that by the pc target 4.For 2-SWNT (Figure 4inset),the enhancement by 5was only 64%of that by 4.These results reveal that the ability of 2-SWNT to detect a single-base mismatch is slightly greater than that of 1.To illustrate the DNA binding specificity more clearly,we introduced a selectivity coefficient,R ,defined as R )(S/B)i ·j /(S/B)i ·j ′,where (S/B)i ·j is the S/B value for the DNA probe i in the presence of DNA target j and (S/B)i ·j ′is that for the same DNA probe in the presence of target j ′.The selectivity of each probe for the pc-DNA target 4was used as the standard (R )1).A selectivity coefficient of 0.764of 1for 5over 4was obtained,while the analogous selectivity coefficient of 2-SWNT for 5over 4was R )0.472.These selectivity coefficients show that the sm-recognition ability of a hairpin-DNA probe can be improved using carbon nanotubes.To further characterize the binding specificity of 2-SWNT for 4,the competitive complex was also analyzed in the presence of biologically related substrates.The addition of 4to a mixture containing 2-SWNT and DNA (100nM),protein (bovine serum albumin,1.0µg/mL),and amino acids [histidine,cysteine,glutamic acid,and aspartic acid (each 10µM)]gave fluorescence response curves almost superim-posable on the one obtained exclusively in presence of 4,59although the background signal displayed a small increase in the mixture.These results clearly indicate that 2-SWNT is not sensitive to other targets.The probe containing the linear DNA strand further illustrates the importance of the relationship between carbon nanotubes and selectivity.The selectivity coefficient of 3-SWNT for 5over 4was 0.833,which is slightly smaller than that of MBs;however,it is higher than the coefficient of linear DNA probes that cannot discriminate sm targets.The contrasting results clearly demonstrate that the carbon nanotubes are promising building blocks for DNA binding specificity.To account for this outcome,we reasoned that the oligonucleotide is initially bound to the nanotube and that the target DNA must then compete with the nanotube for the bound oligonucleotide.Under these conditions,only the perfectly complementary DNA,rather than the mismatched DNA,could displace the nanotube from the assembled complex and form the DNA -DNA hybridization product.Kinetics and Thermodynamics.The kinetic and thermody-namic properties of carbon-nanotube binding and subsequent DNA hybridization of the fluorescent oligonucleotides are fundamentally different from those of conventional MBs.Adsorption of ssDNA on the carbon nanotube surface is slow at room temperature.Figure 5shows fluorescence quenching of 2by SWNTs in the phosphate buffer as a function of time.The curve exhibits a rapid reduction of fluorescence intensity in the first hour followed by a slower decrease over the next 2-3h.We believe that the surface effect of the carbon nanotubes and the charge properties of the ssDNA may be the main contributors to the small adsorption rate.In the presence of 4,competitive binding of 4and SWNTs with 2reduces adsorption of 2on the nanotube surface,which hinders fluorescence quenching.However,DNA hybridization in the presence of SWNTs is also slower than free DNA hybridization without carbon nanotubes at room temperature.The best S/B was obtained at 3h,when the DNA -SWNT complexes had reacted with their target DNA (Figure 4inset).Figure 4.Fluorescence spectra in the presence of the pc-ssDNA target 4(red curves),the sm-ssDNA target 5(green curves),and no target (black curves),demonstrating the abilities of 1and 2-SWNT (inset)to distinguish perfectly complementary and single-base-mismatched DNA targets.The concentrations of 1and 2were 50nM,and the target concentrations were 100nM.The excitation wavelength was 480nm.J.AM.CHEM.SOC.9VOL.130,NO.26,20088355Carbon Nanotube-Quenched Fluorescent Oligonucleotides A R T I C L E S。
Raman and IR studies on adsorption behavior of adhesive monomers in a metal primer for Au Ag Cu and
Raman and IR studies on adsorption behavior of adhesive monomers in a metal primer for Au, Ag, Cu, and Cr surfacesMasako Suzuki,1 Masato Yamamoto,1 Akihiro Fujishima,2 Takashi Miyazaki,2 Hisashi Hisamitsu,3 Katsunori Kojima,4 Yoshinori Kadoma4 1 Department of Chemistry, College of Arts and Sciences, Showa University, 1-5-8 Hatanodai, Shinagawa-ku, Tokyo, Japan 142-8555 2 Department of Oral Biomaterials and Technology, Showa University School of Dentistry, 1-5-8 Hatanodai, Shinagawa-ku, Tokyo, Japan 142-8555 3 Department of Operative Dentistry, Showa University School of Dentistry, 2-1-1 Kitasenzoku, Ohta-ku, Tokyo, Japan 145-8515 4 Department of Applied Functional Molecules, Division of Biofunctional Molecules, Institute of Biomaterials and Bioengineering, Tokyo Medical and Dental University, 2-3-10 Kanda-surugadai, Chiyoda-ku, Tokyo, Japan 101-0062Received 20 July 2001; revised 2 January 2002; accepted 22 January 2002Abstract: 6-[N-(4-vinylbenzyl)propylamino]-1,3,5-triazine2,4-dithione (VBATDT) and 10-methacryloyloxydecyl dihydrogen phosphate (M10P) are functional monomers used for the surface treatment of dental alloys. The aim of our study was to clarify the role of a commercial metal primer containing both the monomers in adhesion between resin and various dental metals on a molecular level. We used surfaceenhanced Raman scattering (SERS) and infrared reflection absorption (IRA) spectroscopy. An SERS measurement was performed with a 647 nm laser line for a mixture of aqueous Au colloid and the primer. IRA spectra were taken for cast films of the primer on Au, Ag, Cu, and Cr surfaces as a function of rinse time, and for self-assembled monolayer (SAM) films from dilute mixed solution of VBATDT andM10P. These spectra indicate that VBATDT in the primer is mainly chemisorbed on Au, Ag, and Cu surfaces with respect to thickness, whereas only M10P is adsorbed on Cr. We also examined the tensile bond strengths between resin and Au, Ag, Cu, and Cr plates treated by VBATDT, with and without M10P, and found that VBATDT effectively promotes the bond strength between resin and the metals except for Cr, whereas M10P is effective only for Cr. These adhesion characteristics are consistent with the chemisorbed species on each metal surface as shown in the spectroscopic evidence. © 2002 Wiley Periodicals, Inc. J Biomed Mater Res 62: 37–45, 2002 Key words: infrared spectrum; Raman spectrum; adhesive primer for metal; dental alloy; adsorption structureINTRODUCTION In adhesive dentistry, surface modification of dental precious alloys has been studied extensively to obtain durable adhesion by resins.1–4 Surface treatment with a primer containing adhesive monomers prior to the application of resin is one such modification. Several kinds of adhesive primers for metal4 have been developed and are clinically demonstrated as a simple and effective method.5 6-[N-(4-vinylbenzyl)propylamino]1,3,5-triazine-2,4-dithione (VBATDT), 10-methacCorrespondence to: Masako Suzuki; e-mail:suzukima@cas. showa-u.ac.jp© 2002 Wiley Periodicals, Inc.ryloyloxydecyl dihydrogen phosphate (M10P), and 6-methacryloyloxyhexyl 2-thiouracil-5-carboxylate (MTU-6) are typical adhesive monomers contained in commercial primers for metal, such as V-primer (Sun Medical Co., Japan), Cesead opaque primer (Kuraray Co., Osaka, Japan), and METALTITE (Tokuyama Co., Tokyo, Japan). Our previous spectroscopic studies6–8 were undertaken to clarify the adhesion mechanisms of such systems on the basis of the molecular structural information about adhesive monomers directly attached to metal surface. Both infrared reflection absorption (IRA) 9 and surface-enhanced Raman scattering (SERS)9,10 techniques are established as powerful tools to analyze the adsorption structure, chemical bond, and molecular orientation of adsorbed species on38SUZUKI ET AL.metal surfaces. Our IRA study6 of the adsorbed species of M10P on evaporated Ag substrate revealed that M10P is dissociatively adsorbed on Ag surface, and an SERS study7 of the adsorbed species of VBATDT on aqueous Au colloid indicated that VBATDT is chemisorbed via sulfur atoms to Au surfaces by thione to thiol-type tautomerization. Ohno et al.11 reported the X-ray photoelectron spectroscopy (XPS) study on the adsorption structure of VBATDT on an Ag–Pd alloy. On the other hand, a newly developed commercial primer containing both VBATDT and M10P in acetone solution (Alloy primer, hereafter called A-primer; Kuraray Co., Japan) has demonstrated effectiveness for both precious and nonprecious metals.12 The chemical structures of VBATDT (thione and thiol types) and M10P are shown in Figure 1. Our aim in this article is to demonstrate molecular behaviors of VBATDT and M10P when these two types of monomers coexist in the vicinity of Au, Ag, Cu, or Cr surfaces, and to elucidate the roles of both monomers in A-primer in adhesion between resin and metals with the use of SERS and IRA techniques. IRA and SERS spectra usually give complementary structural information,9 and their combination for identical samples is helpful for more reliable interpretation of the vibrational spectra of the adsorbed systems. In addition to these spectral analyses, the tensile bond strength between resin and metal (Au, Ag, Cu, or Cr) is examined on the surfaces pretreated by primers containing VBATDT with and without M10P. The results are interpreted successfully by their adsorption behaviors obtained from spectroscopic evidence.Figure 1. Chemical structures of (a) VBATDT (including the tautomer) and (b) M10P. All samples for Raman and SERS measurements were contained in 1 mL glass cells. For SERS of A-primer, 2 L of A-primer was added to 500 L of aqueous colloidal Au in a glass cell. For SERS of VBATDT, 5 L of 1 × 10⁻² mol/L methanol solution of VBATDT was added to 500 L aqueous colloidal Au in a glass cell, where the final molarity of VBATDT was 9.9 × 10⁻⁵ mol/L. The color of each colloid changed from red-violet to blue-violet immediately after the addition of A-primer or VBATDT solution; then, the SERS measurement was performed. Au, Ag, or Cu substrates for IR and IRA measurement were obtained by evaporating Au, Ag, or Cu on a glass slide (10 × 26 mm) with a thickness of more than 200 nm, with a diffusion oil-pumped system (VPC-410, ULVAC) at 1 × 10⁻³ Pa. Cr substrate (5 × 20 mm) for a cast film was purchased from NILACO (Tokyo, Japan). All the metal substrates were rinsed with acetone and used under atmospheric pressure. Various self-assembled monolayers15 (SAMs) for IRA measurements were obtained by dipping the substrate for 1 min in either diluted A-primer (200 L of A-primer diluted by 50 mL acetone) or mixed solutions of VBATDT and M10P in acetone, the total molarity of which was adjusted to be 6.8 × 10⁻⁵ mol/L, and then rinsing the substrate with acetone for 1 min. The molarity ratio of M10P and VBATDT in the mixed solution was set to 0:1, 1:9, 2:5, 1:1, 5:2, 9:1, and 1:0. A cast film was prepared by casting 100 L A-primer on Au, Ag, or Cu substrate (10 × 26 mm), and 38 L on Cr substrate (5 × 20 mm), followed by evaporation of the solvent. Rinse effect on the IRA spectrum of the cast film was examined by a repeated dip in acetone and the consecutive IRA measurement. Rinse time (total dipping time) was set to 0, 2, 7, 15, 30, 60, and 300 s.MATERIALS AND METHODS Spectroscopic measurements MaterialsA-primer, which contains M10P and VBATDT in acetone, was used as received. The total weight percentage of the solutes was estimated at about 1 wt %. Spectroscopic-grade acetone (Wako, Osaka, Japan) and special-grade methanol (Tokyo Kasei Co., Tokyo, Japan) were used without further purification. VBATDT and M10P were synthesized as previously reported.4,13 HAuCl4 3H2O and trisodium citrate dihydrate (special grade, Tokyo Kasei Co., Tokyo, Japan) were used as received. Water was pretreated by a reverse osmosis system (MILLI-RO4) and purified via an ultrapure water system (MILLI-Q, Millipore Co., Inc., Berford, MA, USA).Spectral measurementsRaman and SERS spectra were obtained by a Raman spectrophotometer (NR1100, JASCO, Tokyo, Japan) equipped with a cooled photomultiplier (C31034A-02, RCA, Lancaster, PA, USA). A 647.1-nm line from a Kr ion laser (INNOVA 70 spectrum, Coherent Inc., CA, USA) was used to illuminate the sample through the bottom of the cell, with an output of 200 mW. The scattered light at right angles to the incidentSample preparationAqueous Au colloid was prepared according to the Graber et al.14 method, as described in a previous article.7ADSORPTION OF MONOMERS ON DENTAL METALS39beam was collimated and projected to the entrance slit of a double monochromator. The spectral slit width was 5 cm−1. IR and IRA spectra were taken by a Fourier transform infrared (FTIR) spectrophotometer (FTIR7300, JASCO, Tokyo, Japan) at room temperature. The IR spectrum of M10P was measured by a liquid film method with KBr plates, whereas the IR spectrum of VBATDT or A-primer was measured for evaporated residue of the acetone solution on KBr plates. For IRA measurements of cast films or SAMs, we used a polarization reflection apparatus (PR-500, JASCO) and p-polarized light to illuminate the sample with an incident angle of 80°.left in air for 1 h to allow adequate cure of the resin. The bonded specimens were then thermocycled 2000 times in water at temperatures of 4 and 60°C. Tensile bond strength measurements were made on 5 specimens for each metal with a universal testing machine at a crosshead speed of 2 mm/min.RESULTS SERS spectrum of a mixture of A-primer and aqueous Au colloid To identify the monomers in A-primer, the IR spectra of M10P, VBATDT, and the residue of A-primer after evaporation of acetone were measured, as shown in Figure 2(a, b, and c, respectively). All the peaks observed in Figure 2(c) are ascribable either to those of M10P [Fig. 2(a)] or of VBATDT [Fig. 2(b)] in the bulk states. This verifies that A-primer contains both M10P and VBATDT as its solutes. In Figure 3(a and b), the SERS spectrum of the mixture of A-primer (2 L) and Au colloid (500 L), and that of the mixture of VBATDT (5 L of 1 × 10⁻² mol/L methanol solution) and Au colloid (500 L) are illustrated, respectively. The Raman spectrum of solid VBATDT, which takes a thione-type structure,7 is also shown [Fig. 3(c)] for comparison. The former spec-Tensile bond strength measurementMethyl methacrylate (MMA) was purified by distillation. Poly(methyl methacrylate), (PMMA) powder and an initiator, tri-n-butylborane oxide (TBBO), were obtained from Sun Medical Co., Ltd. (Kyoto, Japan) as a dental adhesive resin, Super-Bond C & B. Tensile bond strength between resin and metal adherends treated with the solutions was examined in the following manner. The metal specimens used as adherends were Au, Ag, Cu, and Cr. Agents for the surface treatment were prepared by dissolving VBATDT and/or M10P in acetone. The agent was applied to the surface of cylindrically shaped adherends polished to a mirror-like finish and allowed to stand for 1 day. The specimens were washed with acetone to remove excess monomer and allowed to dry before bonding. Two specimens of each metal were butt-jointed together with MMA–PMMA/TBBO resin, and the specimens wereFigure 2. IR spectra of M10P, VBATDT, and A-primer: (a) M10P (liquid), (b) VBATDT (solid), (c) residue of evaporated A-primer (solid).Figure 3. SERS spectra of A-primer and VBATDT on Au, and Raman spectrum of VBATDT: (a) SERS spectrum of the mixture of A-primer (2 L) and Au colloid (500 L); (b) SERS spectrum of the mixture of VBATDT (5 L of 1 × 10⁻² mol/L methanol solution) and Au colloid (500 L); (c) Raman spectrum of VBATDT (solid).40SUZUKI ET AL.trum [Fig. 3(a)] was found to be almost identical to the latter [Fig. 3(b)] and does not exhibit extra peaks characteristic of M10P. Furthermore, both SERS spectra [Fig. 3(a,b)] are markedly different from the Raman spectrum of solid VBATDT [Fig. 3(c)]. Especially, the most intense peak at 458 cm−1 due to the C=S stretching observed in Figure 3(c) disappears completely in Figure 3(a,b), whereas an intense peak at 1561 cm−1 in Figure 3(a) and that at 1562 cm−1 in Figure 3(b) newly appear. These facts suggest that the adsorbed species of A-primer is almost identical to that of VBATDT on Au surface.IRA spectra of cast films and rinse effect of A-primer on Au, Ag, Cu, and Cr Figure 4 shows the IRA spectral changes of a cast film of A-primer on an Au substrate as a function of rinse times 0, 2, and 7 s, and 5 min in acetone. The IRA spectrum of the cast film before rinsing (0 s) is almost identical to the IR spectrum of the residue of A-primer after evaporation of acetone [Fig. 2(c)]. The value of the absorbance for the intense peak at 1602 cm−1 (Fig. 4, 0 s) is 0.35. This indicates that the cast film exists mostly in the bulk state. However, the absorbance of IRA peaks as a whole decreases with rinse time. After 7 s or more, the IRA exhibits a quite different pattern, with a new, strong peak around 1560 cm−1, as well as weak peaks at 1436, 1352, 1209, 1170, and 1070 cm−1, and remains unchanged in intensity. The absorbance of the peak at 1559 cm−1 after a 5-min rinse is about 0.005. It is noteworthy that the wavenumber of theFigure 5. IRA spectral changes of a cast film of A-primer on evaporated Ag substrate as a function of rinse time: 2 and 7 s, and 5 min.new, strong peak (around 1560 cm−1) after rinsing is close to that of the new, strong peak (1561 cm−1) in the SERS spectrum of A-primer on Au colloid [Fig. 3(a)]. Figures 5 and 6 illustrate the IRA spectral changes of a cast film of A-primer on Ag and Cu substrates, respectively, as a function of rinse times of 2 s, 7 s, and 5 min. The IRA spectra for Ag and Cu before rinsing (not shown) indicate bulk-like spectral patterns and absorbance values similar to those for Au. During the course of rinse, the IRA peaks due to bulk layers on Ag and Cu decreased in intensity. On the other hand, new spectral patterns, with the most prominent peak at 1556 cm−1 for Ag and 1553 cm−1 for Cu, with several weak peaks at 1537 (shoulder), 1485, 1208, 1164, and 1064 cm−1 for Ag, and at 1536 (shoulder), 1484, 1212, 1164, 1127, and 1064 cm−1 for Cu, appear and remain unchanged in their absorbance value after the 5-minFigure 4. IRA spectral changes of a cast film of A-primer on evaporated Au substrate as a function of rinse time: 0, 2, and 7 s, and 5 min.Figure 6. IRA spectral changes of a cast film of A-primer on evaporated Cu substrate as a function of rinse time: 2 and 7 s, and 5 min.ADSORPTION OF MONOMERS ON DENTAL METALS41rinse. These spectral changes are similar to those in the case of Au, whereas the two new peaks around 1537and 1485 cm−1 are added for both Ag and Cu. The most remarkable difference among IRA spectra on Au, Ag, and Cu is the final absorbance value of the main peaks around 1560 cm−1: 0.005, 0.011, and 0.036, respectively. These values suggest that final thickness of individual films after rinse depends on metal species. Figure 7 shows the IRA spectral changes of Aprimer film cast on a Cr substrate as a function of rinse times 2 s, 7 s, and 5 min. The IRA spectrum before rinsing was similar to that of the cast film on Au substrate before rinsing (Fig. 4, 0 s). Although the absorbance of the IRA spectrum decreased during the rinse, no prominent peaks around 1560 cm−1 were detected as in the case of Au, Ag, and Cu, and weak peaks at 1727, 1174, and 828 cm−1 were observed after the 5-min rinse.IRA spectra of SAMs on Au, Ag, and Cu from mixed solutions of M10P and VBATDT in acetone To understand the adsorption behaviors of M10P and VBATDT on various metals in more detail, IRA spectra of SAMs prepared from dilute mixed solution of both monomers were measured. The IRA spectral change of SAMs on Au from mixed solution of M10P and VBATDT in acetone as a function of the molarity ratio (M10P:VBATDT = 1:0, 9:1, 1:1, and 0:1, with total molarity of 6.8 × 10⁻⁵ mol/ L) are illustrated in Figure 8. All the IRA spectra for mixed solutions (9:1, 1:1) are similar to the IRA spectra of SAMs from acetone solution of pure VBATDT (0:1) and exhibit no peaks due to M10P. Only the IRA spectrum of SAMs from a dilute solution of pure M10P (1:0) shows the CH2 stretching peaks at 2923 and 2867Figure 8. IRA spectral changes of a SAM on evaporated Au substrate from mixed solution of M10P and VBATDT in acetone as a function of the molarity ratio M10P:VBATDT = 1:0, 9:1, 1:1, 0:1 (total molarity: 6.8 × 10⁻⁵ mol/L).cm−1 because of M10P. Figure 9(a) shows the IRA spectrum of a cast film of M10P on Au substrate without rinse, and Figure 9(b) shows the IRA spectrum of the same substrate after being dipped for 1 min in a dilute solution of VBATDT in acetone (6.8 × 10⁻⁵ mol/ L). Near coincidence between the spectra in Figures 9(b) and 8 (0:1) leads us to conclude that M10P once adsorbed on Au [Fig. 9(a)] is replaced completely by the adsorbed species of VBATDT [Fig. 9(b)]. In addition, Figure 9(c) shows the IRA spectrum of SAM prepared by dipping an Au substrate for 1 min in diluted A-primer (100 L of A-primer diluted by 25 mL acetone), with a 1-min rinse time. We found that the IRA of a SAM from the diluted A-primer [Fig. 9(c)] is quite similar to that of a SAM from a dilute solution of pure VBATDT [Fig. 9 (0:1)]. Figures 10 and 11 illustrate the IRA spectral changes of SAMs on Ag and Cu, respectively, from dilute mixed solution of M10P and VBATDT in acetone as a function of the molarity ratio (M10P:VBATDT = 1:0, 9:1, and 0:1 for Ag, and 1:0, 5:2, 2:5, and 0:1 for Cu, with total molarity of 6.8 × 10⁻⁵ mol/L). Tensile bond strengthFigure 7. IRA spectral changes of a cast film of A-primer on Cr substrate as a function of rinse time: 2 and 7 s, and 5 min.Tensile bond strength between MMA–PMMA/ TBBO resin and Au, Ag, Cu, and Cr plates treated by42SUZUKI ET AL.Figure 9. IRA spectral changes of a cast film of M10P on evaporated Au substrate (a) before and (b) after being dipped in VBATDT solution (6.8 × 10⁻⁵ mol/L in acetone), and an IRA spectrum of SAM on evaporated Au substrate from diluted A-primer (100 L of A-primer diluted by 25 mL acetone).Figure 11. IRA spectral changes of a SAM on evaporated Cu substrate from mixed dilute solution of M10P and VBATDT in acetone as a function of the molarity ratio M10P:VBATDT = 1:0, 5:2, 2:5, 0:1 (total molarity: 6.8 × 10⁻⁵ mol/L).acetone solution of 0.5 wt % of VBATDT was examined. The result was compared to that obtained when the metal plates were treated by mixed acetone solution of 0.5 wt % VBATDT and 0.2 wt % M10P, as summarized in Table I. Surface treatment with two types of agents significantly enhanced the bond strengths to precious and nonprecious metals compared to the strength without surface treatment, except in the case of Cr treated with VBATDT only. Although all Cr specimens treated with VBATDT were fractured during thermal cycling, other specimens showed excellent bond strengths without failure by thermal cycling. The introduction of M10P into aTABLE I The Effect of Addition of M10P Into Treatment Solution Containing VBATDT on Tensile Bond Strength of MMA–PMMA/TBBO ResinTensile Bond Strength (MPa) After 2000 Thermal Cyclings Metal Au Ag Cu Cr 0.5 wt % VBATDT/Acetone 25.7 (3.2) 27.3 (5.1) 30.2 (10.7) —* 0.5 wt % VBATDT + 0.2 wt % M10P/Acetone 25.2 (3.6) 39.7 (2.6) 31.1 (10.0) 34.2 (9.7)Figure 10. IRA spectral changes of a SAM on evaporated Ag substrate from mixed dilute solution of M10P and VBATDT in acetone as a function of the molarity ratio M10P:VBATDT = 1:0, 9:1, 5:2, 0:1 (total molarity: 6.8 × 10⁻⁵ mol/L).*All specimens were fractured during thermal cycling. Standard deviations in parentheses.ADSORPTION OF MONOMERS ON DENTAL METALS43surface treatment agent did not statistically affect bond strengths to Au and Cu. The addition of M10P distinctly improved the adhesive behavior of the resin to Cr, resulting in cohesive failures of resin after tensile tests. Although a combined treatment with VBATDT and M10P yielded statistically superior bond strengths to Ag compared with the case in the absence of M10P, fractured surfaces of Ag after tensile tests demonstrated cohesive failures of resin layer in both cases.of nonempirical vibrational analysis, and the results will be reported elsewhere. Ag and Cu substrates Competitive adsorption of M10P and VBATDT on Ag and Cu substrates shows a marked difference from that on Au substrate. The IRA spectrum for Ag [Fig. 10 (M10P:VBATDT = 1:0)] exhibits twin peaks at 2928 and 2863 cm−1 because of the CH2 stretchings of M10P. The IRA spectrum for Cu [Fig. 11 (1:0)] shows characteristic peaks at 1726, 1641, 1324, 1172, and 1020 cm−1, as well as the twin peaks at 2935 and 2855 cm−1 because of M10P. On the other hand, the IRA spectra for Ag [Fig. 10 (0:1)] and Cu [Fig. 11 (0:1)] exhibit the intense peaks at 1560 and 1553 cm−1, respectively, because of triazine dithiol–type ring stretchings of adsorbed species of VBATDT. These facts indicate that VBATDT and M10P are individually adsorbed on Ag or Cu. In addition, an IRA peak at 983 cm−1 in Figure 10 (1:0), and at 1089 cm−1 in Figure 11 (1:0), are probably assigned to the PO32− symmetric and antisymmetric stretchings, respectively, of RO-PO32− (M10P) in the dissociated form, as discussed in a previous article.6 This implies that M10P is adsorbed dissociatively on both Ag and Cu surfaces with different molecular orientations. We next discuss the molecular behavior when these two types of monomers coexist. In the case of Ag substrates (Fig. 10), a strong peak around 1560 cm−1 because of VBATDT was observed in the IRA for 5:2 and 9:1, whereas two weak peaks around 2923 and 2866 cm−1 because of the CH2 stretchings of M10P were observed in the IRA spectrum for 9:1. This suggests that VBATDT is advantageously adsorbed on Ag, whereas M10P may be adsorbed on Ag only with the high molarity ratio (9:1) from dilute solution. In the case of Cu substrates (Fig. 11), a strong peak around 1560 cm−1, as well as several weak peaks because of VBATDT, was observed in the IRA for 5:2 and 2:5. On the other hand, a number of peaks around 1726, 1324, 1172, 1089, and 1020 cm−1, characteristic of M10P, were detected in the IRA spectrum for 2:5 and 5:2. This fact indicates that coadsorption of VBATDT and M10P occurs in the wider range of molarity ratio compared to the case of Ag surface. The relative intensity of the IRA peaks as a result of VBATDT and M10P seems to depend simply on the molarity ratio in the mixed solution. This suggests that VBATDT is not preferential to M10P in adsorption on Cu surface from dilute mixed solution in acetone. Consequently, the adsorption behavior of VBATDT and M10P was found to depend on metal species and the molarity ratio in the coexistence of both monomers in dilute solution (total molarity: 6.8 × 10⁻⁵ mol/L), as discussed above. According to XPS study16 of evapo-DISCUSSION Adsorption from dilute solution Au substrate The present SERS and IRA spectra provide us with new information about adsorption behaviors of monomers in A-primer on Au surface. The SERS spectrum of the mixture of A-primer and Au colloid [Fig. 3(a)] is similar to that of the mixture of dilute VBATDT solution and Au colloid [Fig. 3(b)], whereas the IRA spectrum of SAM from diluted A-primer on Au [Fig. 9(c)] is quite similar to that from diluted solution of VBATDT on Au [Fig. 8 (M10P:VBATDT = 0:1)]. The IRA spectra in Figure 9(a,b), on the other hand, indicate that a cast film of M10P formed on Au surface is easily replaced by VBATDT in dilute acetone solution. All these SERS and IRA data demonstrate that (1) only VBATDT is adsorbed selectively on Au surface, and (2) M10P, in the presence of VBATDT, is unable to be adsorbed on Au surface as a result of competitive adsorption, and behaves like a mere solvent, although M10P is adsorbed on Au in the absence of VBATDT. Because the SERS spectrum of diluted A-primer on Au colloid [Fig. 3(a)] exhibits the intense peaks at 1630 cm−1 (C=C stretching) and 1611 cm−1 (benzene ring stretching), and misses the intense peak around 458 cm−1 (C=S stretching), the adsorbed species is considered to keep vinylbenzyl group and to have no C=S groups. Furthermore, a new intense peak at 1561 cm−1 is observed in the SERS spectrum [Fig. 3(a)], whereas a new intense peak at 1556 cm−1 is observed in IRA [Fig. 8 (0:1)]. Both peaks are presumably caused by a triazine dithiol-type ring stretching newly formed under thione to thiol tautomerization of VBATDT as mentioned in the previous article.7 The absorbance intensity of the IRA peaks around 1560 cm−1 was found to be saturated around 0.005 [Fig. 8 (0:1), Fig. 9(b and c)]. This suggests that the adsorbed species form a monolayer attached to the Au surface, with its sulfur atoms of triazine dithiol-type ring structure. Detailed assignment of this peak is now in progress on the basis44SUZUKI ET AL.rated metal films, no oxide layer is formed on Au, whereas oxide layers with thickness less than 5 nm are formed on Ag and Cu. It is thus reasonable that the PO32− group of M10P is more attracted to the oxide layers of Ag and Cu with ionic interaction than to Au.Adsorption from A-primer As mentioned before, most parts of the cast films of A-primer formed on Au, Ag, Cu, and Cr surfaces are in the bulk state with the same order of thickness under this experimental condition. However, in the course of rinsing in acetone, remarkable IRA spectral changes are observed for all those films, and after a more than 15 s rinse, the IRA spectra remain unchanged. The IRA spectra of cast films on Au, Ag, and Cu after a 5-min rinse are quite different in their absorbance intensities, although the spectral features are almost similar (Figs. 4, 5, and 6). The absorbance values of the most intense peak around 1560 cm−1 on Au, Ag, and Cu surfaces are estimated to be 0.005, 0.011, and 0.036, respectively. These values indicate that average thickness ratios of films on Au, Ag, and Cu after rinsing is about 1:2:7, respectively. In the case of Au surface, the near coincidence of the IRA spectrum of the rinsed cast film [Fig. 4 (5 min)] and that of a SAM from VBATDT dilute solution [Fig. 8 (0:1)] suggests that only the first monolayer composed of VBATDT adsorbates in the cast film remains after rinsing. Because the rinsed films on Au, Ag, and Cu substrates have resisted dissolution by acetone, the VBATDT molecules must be bonded chemically to metal surfaces as well as to adjacent molecules. Polymerization of adjacent VBATDT molecules with S−S bonds reported by Mori et al.17 may occur and form a threedimensional network. Several additional peaks around 1485 and 1537 cm−1, which appear new after rinsing for Ag (Fig. 5) and Cu (Fig. 6) but not Au (Fig. 4) may thus be ascribable to these structures. Ohno et al11 suggested the formation of a chelate compound between VBATDT and Cu extracted from the Ag–Pd alloy surface. We will report a detailed vibrational analysis in the near future. Contrary to that of Au, Ag, and Cu, the IRA spectrum of the cast film on Cr surface after rinsing [Fig. 7 (5 min)] yields no peaks around 1560 cm−1, characteristic of VBATDT adsorbates, but gives weak peaks at 1727 and 1174 cm−1, characteristic of M10P [Fig. 2(a)]. Considering the absorbance value of these peaks (∼0.001),4 it is likely that a monolayer or submonolayer of M10P, instead of VBATDT, is formed on Cr surface. It is interesting to compare competitive adsorption behaviors of VBATDT and M10P on Au, Ag, and Cu from A-primer (total molarity: ∼2 × 10⁻² mol/L) tothose from dilute solution (total molarity: 6.8 × 10⁻⁵ mol/L; molarity ratio: M10P:VBATDT = 1:0 ∼ 0:1). Only VBATDT is adsorbed selectively on Au to form a monolayer regardless of its concentration. On Ag, VBATDT is preferentially adsorbed to form a monolayer from dilute solution. When casted with Aprimer, VBATDT forms a chemisorbed film twice as thick as the monolayer. On Cu, both VBATDT and M10P are coadsorbed from dilute solution, whereas only VBATDT forms a chemisorbed film from Aprimer with a thickness several times greater than that of the monolayer on Au. M10P is not detected in the IRA spectra of rinsed cast films on Ag and Cu. Such a significant difference must arise from initial conditions, when the monomers in each solution come in contact with metal surface, such as frequency of collision between molecules and surface, between molecules, as well as from the stabilization energy of chemical interaction between VBATDT, M10P, and metal. Thus, initial concentration is likely to affect the molecular structure of the film formed on individual metal surfaces.Adsorbed species on Au, Ag, Cu, and Cr surfaces, and the adhesion effect As mentioned in the Results section, combined treatment with VBATDT and M10P statistically affects bond strength for Ag compared with the absence of M10P, and did not affect Au and Cu. However, fractured surfaces of Ag after tensile tests demonstrated cohesive failures of resin layer in both cases. This implies that the values of bond strength obtained for Ag did not depend on the nature of the resin–Ag adhesion interface. Thus, there is a distinct possibility that the effectiveness of the two agents was comparable at the adhesion interface of Ag. Therefore, tensile bond strengths between resin and Au, Ag, and Cu plates were considerable with VBATDT, and the addition of M10P was practically ineffective, whereas the bond strength for Cr was weak, and the addition of M10P improved its strength remarkably. The adhesion characteristics are consistent with the spectroscopic result that the chemisorbed layer in cast films on Au, Ag, and Cu substrates is formed solely by VBATDT, whereas the adsorbed layer on Cr substrate is formed only by M10P. VBATDT or M10P thus adsorbed to each metal may be copolymerized by their C=C groups with resin monomers later applied. They provide a strong and durable adhesion between resin and corresponding metal. This is why A-primer containing VBATDT and M10P promotes bond strength between resin and various kinds of dental alloys, including precious and nonprecious metals. We have demonstrated by SERS and IRA studies。
- 1、下载文档前请自行甄别文档内容的完整性,平台不提供额外的编辑、内容补充、找答案等附加服务。
- 2、"仅部分预览"的文档,不可在线预览部分如存在完整性等问题,可反馈申请退款(可完整预览的文档不适用该条件!)。
- 3、如文档侵犯您的权益,请联系客服反馈,我们会尽快为您处理(人工客服工作时间:9:00-18:30)。
Dimensional change and elastic behavior of hardenedPortland cement paste, Ca-montmorillonite and 1.4nm tobermorite: a comparative studyBeaudoin, J.J.; Mitchell, L.; Raki, L.NRCC-46433A version of this document is published in / Une version de ce document se trouve dans:Advances in Cement and Concrete, Engineering Conferences International,Colorado, U.S.A., August 10-14, 2003, pp. 201-209http://irc.nrc-cnrc.gc.ca/ircpubsDIMENSIONAL CHANGE AND ELASTIC BEHAVIOR OF HARDENED PORTLAND CEMENT PASTE,Ca-MONTMORILLONITE AND1.4 nm TOBERMORITE: A COMPARATIVE STUDYJ.J. Beaudoin, L. Mitchell and L. RakiInstitute for Research in ConstructionNational Research CouncilOttawa, Ontario, Canada K1A 0R6T: 1-613-993-6749; F: 1-613-954-5984; E: jim.beaudoin@nrc-cnrc.gc.ca ABSTRACTThe role of water in hardened Portland cement paste (hpc) is germane to an understanding of the nature of nanostructure – property relationships. The irreversible dimensional changes of hpc that occur on wetting and drying are dissimilar to those observed for other silicate minerals of interest to cement science. This irreversibility is also observed for the modulus of elasticity parameter. Length change, mass change and modulus of elasticity isotherms (including 1st and 2nd drying-wetting cycles) were determined for specimens of hpc, montmorillonite and 1.4 nm tobermorite. All exhibit significant irreversible behavior. Similarities and differences in the nature and character of the three types of isotherms are discussed. Inferences are made with respect to the nanostructural nature of hpc and its dimensional response in aqueous media. It is apparent that hpc has unique characteristics that are responsible for stability.INTRODUCTIONThe volume stability and performance of cement-based materials are known to be affected by the response of the C-S-H in aggressive environments, Beaudoin et al. (1). This may have an impact on the micro and nanostructural integrity of the binder in concrete and its durability. An improved understanding of the nature of C-S-H in hydrated cement products, the energetics of its interaction with water and the corresponding changes in engineering characteristics may lead to new technologies for enhanced service-life of concrete structures.Models of C-S-H nanostructure, generally derived from an eclectic body of physico-chemical evidence, have been useful but not definitive in explaining durability phenomena, Taylor (2). The evolution of these models has provided an appreciationof the moisture sensitivity of cement hydrates. For example the layer models proposed by Feldman (3) and Taylor (4) can account for the large primary and secondary hysteresis associated with water isotherms (mass and length change). Feldman (5) clearly demonstrated that there is no unique value of fundamental engineering parameters over the entire humidity range and that sorbed water has structural properties. It is apparent that changes (up to 100%) in the elastic response of a material due to differences in the equilibrium state of water can affect the distribution of internal strain in a heterogeneous binder such as hardened cement paste.A study was designed to further investigate the irreversible nature of volume change in cement systems (undergoing several drying-wetting cycles). Two other model layer silicate systems – montmorillonite and 1.4 nm tobermorite – were utilized to establish similarities and differences in nanostructural performance. Differences in the effect of moisture on the engineering behavior of these systems are interpreted in nanostructural terms. The relevance of the results in terms of durability is discussed. STRUCTURE AND PROPERTIES OF LAYERED C-S-H ANALOGSThe understanding of the structure of C-S-H in hydrated Portland cement has evolved from the structure of 1.4 and 1.1 nm tobermorite, Brunauer (6). An idealized structure for 1.1 nm tobermorite is presented in Figure 1(a). Later, Taylor suggested that the C-S-H in hydrated cement contains elements of structure derived from both 1.4 nm tobermorite and jennite (4). He observed that a Ca/Si ratio similar to that occurring in cement paste could be derived from a mixture of the two structures. Other hypotheses for lime-rich tobermorites include: omission of “bridging” silica tetrahedra; structures based on H2SiO42- group; replacement of regions of dreierketten by hydroxyl ions which form part of the central CaO2 layers. However evidence that in C-S-H (gel), after lengthy periods of hydration, considerable amounts of orthosilicate and dimer silicate chains exist, suggests the possibility of a simplified structure (as proposed by Feldman) including silica in many states of polymerization together with hydroxyl groups and Ca2+ ions on the surfaces of the sheets, Beaudoin (7).There are structural similarities between the structure of Ca-montmorillonite and the more crystalline C-S-H (II) described by Taylor (4). Figure 1(b) is an idealized representation of Ca-montmorillonite. In the tetrahedral sheet, Si is sometimes replaced by trivalent Al. In the octahedral sheet, there may be replacement of trivalent aluminum by divalent Mg without complete filling of the third vacant octahedral position. A deficit of positive charge results. This is compensated by the adsorption on the layer surfaces of cations which are too large to be accommodated in the interior of the lattice. These ions can be easily exchanged in the presence of water. Contact with water results in penetration of water molecules between the unit layers. The basal spacing expands to values in the range of 1.25 – 2.00 nm depending on the type of cation.Figure 1 Diagrams depicting the idealized structures of (a) 1.1 nm Tobermorite and (b) Ca-MontmorilloniteFour layers of water molecules may be intercalated. It is known that montmorillonite clays experience substantial interlayer swelling, Grim (8). The exact volume change mechanism has not been resolved. It may involve hydration energetics or certain geometric arrangements of the water molecules in the water layers. The argument for inclusion of Ca-montmorillonite in this study is that further understanding of similarities and differences of the title systems should contribute to the long-term objective of correlating volume change and durability with the structure of C-S-H in Portland cement products.EXPERIMENTALMaterialsNormal Portland cement was used. The chemical composition (in %) is as follows: SiO2 (21.6); Al2O3 (5.2); Fe2O3 (0.3); CaO (66.8); MgO (0.9); SO3 (2.9); Na2O (0.03); K2O (0.12). The 1.4 nm tobermorite was synthesized following the method described by Hara et.al. (9) using lime and amorphous silica (at Ca/Si = 1.00) suspensions at 60°C subsequent to an initial treatment at 140°C. No other phases were detected by X-ray diffraction. Surface area was about 45.0 m2/g.Ca-montmorillonite samples were obtained from a commercial supplier. The surface area was determined to be 14.6 m2/g. The material was ground and passed through a 100 mesh sieve.Specimen FabricationThe modulus of elasticity measurements for cement paste were made with paste prepared at water-cement ratio = 0.25. The paste was hydrated for several years prior to fabrication of the test specimens. Specially designed, ‘T’-shaped specimens 25.4 mm long were cut from paste cylinders. They had a cross-section, 7.00 mm deep with a flange width of 12.70 mm and flange and web thicknesses of 1.27 mm.Specimens for the 1.4 nm tobermorite and Ca-montmorillonite modulus of elasticity measurements were made from powders compacted in the form of discs, 31.75 mm in diameter x 1.00 mm thick. Porosity values for the paste, 1.4 nm tobermorite and Ca-montmorillonite are 4, 11 and 51% respectively.Sorption MeasurementsMass and length change isotherms were performed in a high-vacuum apparatus. Samples were mounted in individual tubes on quartz spirals of the McBain-Bakr type that gave values of mass change to a sensitivity of 3.0 x 10⁻⁸ kg. Length change was measured in separate cells with samples mounted on modified Tuckerman optical extensometers. The sensitivity of these devices is 1 x 10⁻⁶ mm/mm. It was established prior that vacuum degassing at 85% for 3 h (cement paste) produced the same result for the non-evaporable water as the conventional ‘d-drying’ procedure, Feldman (5).Modulus of Elasticity MeasurementsThe modulus of elasticity values for cement paste were determined in compression. The ‘T’-shaped specimens were mounted on a miniature fixed frame linking the specimens to the load cell and to the modified Tuckerman optical extensometers used for the length change measurements. Details of the loading system are provided elsewhere, Tamtsia and Beaudoin (10).The modulus values for the 1.4 nm tobermorite and Ca-montmorillonite were determined using a loading device designed for the disc specimens, Sereda et.al. (11). Load-deflection curves (flexural mode) were used for the calculations.RESULTS AND DISCUSSIONThe mass, length and modulus of elasticity isotherms for cement paste, 1.4 nm tobermorite and Ca-montmorillonite are described and compared.Mass Change IsothermsThe isotherms are depicted in Figure 2(a) – 2(c). All isotherms exhibit large primary and secondary hysteresis and the existence of scanning loops. The isotherm for Ca-montmorillonite was obtained up to an RH value of 69% as the sample did not retain structural integrity beyond this point. The character of all the isotherms is similar suggesting that the irreversible effects of intercalation of the adsorbate are manifested in a similar way in the three systems. It is apparent that there is no unique equilibrium position at low humidities (e.g. 11% RH) for each layer system. It can be inferred from this that the susceptibility of C-S-H-based binders (and indeed other layer silicates) to deleterious processes is dependent on drying-wetting history.Figure 2Mass Change Isotherms (water adsorbate) at 25°C of (a) Cement Paste, w/c = 0.25; (b) 1.4 nm Tobermorite and (c) Ca-MontmorilloniteLength Change IsothermsThe isotherms are plotted in Figure 3(a) – 3(c). They all exhibit similar characteristics of irreversibility evident in the mass change versus humidity curves. The nature of the length change curves and in particular the scanning loops are strikingly similar for the three systems. The volume change processes due to uptake of water would appear to be mechanistically similar. The absence of uniqueness at any given humidity suggests that volume stability is sorption path dependent.Modulus of Elasticity IsothermsThe isotherms are plotted in Figure 4(a) – 4(c). The role of water in the nanostructure of the three systems is more clearly understood on examination of the humidity effects on the elastic stiffness of these materials. The results are discussed for each system separately. It is noted that differences in the absolute values of the modulus of elasticity would be expected as the porosity values of the compacts are substantially different. Our focus is on the characteristics of the isotherms themselves and comparisons are made on that basis.Figure 3 Length Change Isotherms (water adsorbate) at 25°C of (a) Cement Paste, w/c = 0.25; (b) 1.4 nm Tobermorite and (c) Ca-Montmorillonite(i) Portland cement paste: The large hysteresis observed on first drying andrewetting has been previously observed by Sereda et.al. (Figure 4(a)) (11).The only difference was the mode of the applied stress i.e. flexural asopposed to compressive in this work. Significant stiffening occurs onwetting at higher humidities. Loss of stiffening occurs on drying at lowerhumidities as incremental amounts of the remaining interlayer water areremoved. Second drying is similar to first drying. However secondrewetting exhibits a significant reduction in stiffening up to about 50% RHafter which the value of the modulus gradually returns to its original valueat high humidities. Second drying delays the re-intercalation of water(possibly due to a higher degree of structural collapse).tobermorite: The dependence of the modulus of elasticity on (ii) 1.4nmrelative humidity (Figure 4(b)) has similar features to that for Portlandcement paste. Intercalation of water into the structure has a stiffeningeffect that is maintained on drying to low humidities. This observationwould be compatible with Taylor’s (4) description of the C-S-H phases inhydrated Portland cement as possibly a mixture of tobermorite and jennite.It also reinforces the view that C-S-H products in hydrated Portlandcement systems behave as layered materials. The intercalate takes onstructural characteristics. Estimates indicate that the intercalate inhydrated Portland cement occupies one molecular layer, Feldman (12).The intercalate in 1.4 nm tobermorite also occupies about one molecularlayer. The energetics favors a modification of the structural properties ofthe solid.(iii) Ca-montmorillonite: The elastic response as a function of humidity is significantly different to that for hydrated Portland cement paste and 1.4nm tobermorite (Figure 4(c)). Sorption of moisture results in a significantdecrease in stiffness. It is known that up to four layers of water moleculescan reside in the interlayer space. This has a weakening effect on the solidas separation distances increase. Any structural effect of the intercalate isnegated. It is also evident that hysteresis occurs over the entire humidityrange. The energetics of intercalation and de-intercalation is a function ofdrying history and compatible with observations for the hydrated Portlandcement paste i.e. second drying causes additional decreases in stiffness.Stiffness in the dry state is recoverable. It is also evident that there is nounique equilibrium position, e.g. at 11% RH the modulus can vary bymore than 50% depending on drying-wetting history.Figure 4 Modulus of Elasticity Isotherms (water adsorbate) at 25°C of (a) Cement Paste, w/c = 0.25; (b) 1.4 nm Tobermorite and (c) Ca-MontmorilloniteVolume Stability and Engineering PerformanceIt is apparent that volume stability and engineering performance are linked in similar ways for all three of the layer systems investigated. Differences lie in the extent to which the intercalate imparts structural modification to the solid. These modifications will influence the energetics of processes associated with durability e.g. dissolution, microcracking and mass transport. The dependence of the physico-mechanical characteristics of C-S-H and other layered minerals on moisture content is non-linear and non-unique. This underlies the importance of drying-wetting history on the durability of concrete in aggressive environments.A comparison of the sorption characteristics of the three systems studied suggests that the durability of concrete in aggressive environments can be influenced by the ‘layered’ nature of the C-S-H binder.CONCLUSIONS1. There are striking similarities in the sorption behavior of Portland cement paste,1.4 nm tobermorite and Ca-montmorillonite. Mass, length and modulus ofelasticity exhibit hysteresis over the entire humidity range for these systems.2. The response of the modulus of elasticity property as a function of humidity isnon-linear and non-unique. For example, the equilibrium values are dependent on drying-wetting history.3. Structural stiffening of the layered systems (as a function of humidity) can occur.It is dependent on the number of layers of intercalate present in the material. Ca-montmorillonite however actually undergoes a decrease in stiffness on wetting due to multilayer intercalation and a weakening of the material.4. Similarities in the irreversible nature of the energetics of intercalation and de-intercalation in the three title systems suggest that the C-S-H solids in hydrated Portland cement products are compatible with structural models described by Feldman and Taylor.5. The changing nature of the C-S-H solids in concrete is likely to influenceprocesses affecting durability. These include dissolution, microcracking and mass transport.REFERENCES(1) Beaudoin, J.J., Catinaud, S., Marchand, J. and Sato, T. (2002). “Volumestability of hydrated Portland cement phases exposed to aggressive solutions.”L’industria italiana del Cemento, No. 782, 954-966.(2) Taylor, H.F.W. (1990). “Hardened cement pastes: models of structure.” 246-254, in Cement Chemistry, Academic Press, pp 475, London.(3) Feldman, R.F. and Sereda, P.J. (1970). “A new model for hydrated Portlandcement and its practical implications.” Engineering Journal, 53 (8-9), 53-59. (4) Taylor, H.F.W. (1990). “Structural models for C-S-H gel.” 142-152 in CementChemistry, Academic Press, pp 475, London.(5) Feldman, R.F. (1968). “Sorption and Length-Change Scanning Isotherms ofMethanol and Water on Hydrated Portland Cement.” Paper III-23, Proc. Fifth Int. Symp. On the Chemistry of Cement, Tokyo, Vol. 3, 53-66.(6) Brunauer, S. (1962). “Tobermorite gel – The heart of concrete.” AmericanScientist, 50 (1), 210-229.(7) Beaudoin, J.J. (1999). “Why engineers need materials science.” Concrete Int.,21 (8), 86-89.(8) Grim, R.E. (1962). “Applied Clay Mineralogy.” McGraw-Hill, New York, pp422.(9) Hara, N., Chan, C.F., and Mitsuda, T. (1978). “Formation of 14Å tobermorite.”Cem. Concr. Res., 8, 113-116.(10) Tamtsia, B.T. and Beaudoin, J.J. (2000). “Basic Creep of hardened cementpaste: A re-examination of the role of water.” Cem. Concr. Res. 30, 1465-1475.(11) Sereda, P.J., Feldman, R.F. and Swenson, E.G. (1966). “Effect of sorbed wateron some mechanical properties of hydrated Portland cement pastes and compacts.” Symp. Struct. Of Port. Cem. Paste and Concr., High. Res. Board, Spec. Rept. 90, 58-73.(12) Feldman, R.F. (1980). “Application of the helium inflow technique formeasuring surface area and hydraulic radius of hydrated Portland cement”.Cem. Concr. Res., 10 (5), 657-664.KEY WORDS: dimensional change, modulus of elasticity, Portland cement paste, Ca-montmorillonite, 1.4 nm tobermorite, nanostructure, durability。