Blue and red photoluminescence from
《发光学报》成为美国《EI》收录源期刊

《发光 学 报》成 为 美国 《EI)收 录源 期刊
2010年 3月 25日,《发光学报》接到 EI中国信息部通知 :从 2010年第 1期起正式被《EI》(《工程索 引 》)收录 为刊源 。
EI作 为世界 领先 的应 用科学 和工 程 学在 线 信 息服 务 提供 者 ,是 全世 界 最早 的工 程 文摘 来 源 ,一 直 致力 于为科 学研 究者 和工 程技术 人员 提供最 专业 、最 实用 的在线 数据 、知识 等信 息服 务 和支 持 。《发 光 学报 》被 EI收 录 ,对加 强我 国发 光学研 究领 域及论 文作 者开 展更广 泛 的 国内外 交流 ,提升 我 国技术人 员 学术 声誉 具有 积极 的促 进作 用 。
cence properties[J].Chem.Commun.,2009(34):5118-5120. [22]W ang Xiaohui,Qu Konggang,Xu Bailu,et a1.Microwave assisted one—step green synthesis of cell—permeable muhicolor
[25]Dong Jianhui,Shan Yun.Field emission proper ty of carbon nanotubes/diamond composite[J].Chin. Lumin.(发 光学 报 ),2010,31(4):595—598 (in Chinese).
[26]Eda G,Chhowalla M.Chemically derived graphene oxide:Towards large—area thin—film electronics and optoelectronics 『J].4dv.Mater.,2010,22(22):2392-2415.
2012年高考英语备考:英语作文范文—五颜六色的珊瑚礁

2012年高考英语备考:英语作文范文—五颜六色的珊瑚礁导读:本文2012年高考英语备考:英语作文范文—五颜六色的珊瑚礁,仅供参考,如果能帮助到您,欢迎点评和分享。
高中英语作文:五颜六色的珊瑚礁(Colorful coral reefs)Gaze at the vivid yellows, blues, and psychedelic swirls of a single emperor angelfish and you'll sense the whimsy of evolution. Go on to explore its home in lush coral reefs and you'll soon hit sensory overload, assaulted by colors and patterns that range from sublime to garish. Coral reefs are unquestionably the world's most colorful places. But why?瞧瞧那“皇帝神仙鱼”(emperor angelfish)身上鲜艳的黄与蓝,还有迷幻般的漩涡,你就能感受到生物进化的无奇不有了。
继续走进它所栖息的繁茂的珊瑚礁,你会马上觉得感官超出负荷:由庄重到花俏的各式各样色彩与图案从四面围攻而来。
珊瑚礁无疑是世上色彩最丰富的地方,但为什么会这样?For reasons known only to nature, color explodes across coral reefs, making them Earth's most vivid landscapes. Here in the shallows of a Fijian reef, brilliant soft corals wave in reds, pinks, and yellows as schools of fairy basslets flash orange and violethues. The basslets' different colors aid in species identification, mate recognition, and even camouflage as individuals mass against the kaleidoscope of the reef. What humans see lighted by a photographer's bright strobe may look altogether different in natural light through the eyes of reef creatures. Scientists are now beginning to learn how wavelengths of light (and therefore color) change through water at different distances, and—more important—how fish see colors and what messages they might communicate.出于只有大自然才明白的理由,色彩在珊瑚礁各处蓬发,让它们成为地球上最明艳的景观。
碳量子点自上而下制备方法专利技术综述
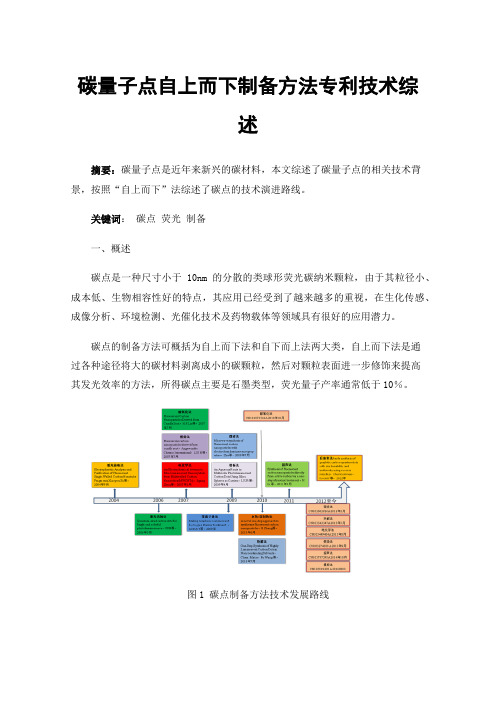
碳量子点自上而下制备方法专利技术综述摘要:碳量子点是近年来新兴的碳材料,本文综述了碳量子点的相关技术背景,按照“自上而下”法综述了碳点的技术演进路线。
关键词:碳点荧光制备一、概述碳点是一种尺寸小于10nm的分散的类球形荧光碳纳米颗粒,由于其粒径小、成本低、生物相容性好的特点,其应用已经受到了越来越多的重视,在生化传感、成像分析、环境检测、光催化技术及药物载体等领域具有很好的应用潜力。
碳点的制备方法可概括为自上而下法和自下而上法两大类,自上而下法是通过各种途径将大的碳材料剥离成小的碳颗粒,然后对颗粒表面进一步修饰来提高其发光效率的方法,所得碳点主要是石墨类型,荧光量子产率通常低于10%。
图1 碳点制备方法技术发展路线从图1可以看出,南卡罗来纳大学于2004年通过弧光放电首次发现了碳点,在之后的几年内其他碳点的制备方法应运而生。
二、碳点自上而下法技术路线演进图2“自上而下”法专利技术路线演进自2004年xu在弧光放电实验中发现碳点后,引发了材料领域的对碳点的高度兴趣,继而在2006年和2007年又相继出现激光消蚀法和电化学法制备碳点,这几种方法都属于“自上而下”法制备碳点的常用方法。
专利CN106904594A是以甲苯为碳源,采用电弧放电一步法制备白光碳量子点荧光发光材料;专利CN103449404A在碱性条件下以小分子醇类为碳源,含有醇类的电解液中制备了碳点,此法产率较高、操作简单,上述两篇都为自上而下法制备碳点的代表性专利。
2.1弧光放电法电弧放电法是最初发现荧光碳点的方法,2004年Xu等[1]用凝胶电泳法分离纯化电弧放电法合成的单壁碳纳米管悬浮液时,发现悬浮液在凝胶电泳作用下能分成三部分,速度最快的那部分在350nm紫外灯下有荧光信号,进一步采用电泳法可依次分离出发射蓝绿色,黄色和橘红色荧光的三种荧光纳米材料,从而发现了可以发射荧光的新型碳纳米材料 CDs 虽然该方法制得的CDs荧光性能较好,但是其产率低,仅占悬浮液的10wt%,同时纯化过程复杂,不利于产物的收集。
异质结构-NaGdF_(4)Yb,Er纳米棒负载在金属有机框架上以调节上转换光致发光
第40卷第2期2021年4月红外与毫米波学报J.Infrared Millim.Waves Vol.40,No.2 April,2021文章编号:1001-9014(2021)02-0166-06DOI:10.11972/j.issn.1001-9014.2021.02.005The heterostructure NaGdF4:Yb,Er nanorods loaded on metal-organicframeworks for tuning upconversion photoluminescenceLIU Yi,JIAO Ji-Qing*,LYU Bai-Ze,WANG Jiu-Xing(College of Materials Science and Engineering,National Center of International Joint Research for Hybrid Materials Technology,National Base of International Sci.&Tech.Cooperation,Qingdao University,Qingdao266071,China)Abstract:Multi-component heterostructure nanocomposites can not only inherit the original properties of eachcomponent,but also induce new chemical and electronic properties through the interaction between the compo⁃nents.The heterostructure zeolitic imidazolate framework/NaGdF4:Yb,Er(ZIF-67/NaGdF4:Yb,Er)was pre⁃pared by a stepwise synthesis strategy.And it avoided agglomeration and quenching of upconversion(UC)nanoparticles,and displayed better stability.In the heterostructure nanocomposites,ZIF-67is employed as an en⁃ergy transmission platform under980nm pared to pure NaGdF4:Yb,Er nanorods,the UC photo⁃luminescence of heterostructure ZIF-67/NaGdF4:Yb,Er is tuned from green to red owing to the synergistic effect of each component.Key words:heterostructure,controllable synthesis,nanocomposite,luminescence,upconversionPACS:42异质结构—NaGdF4:Yb,Er纳米棒负载在金属有机框架上以调节上转换光致发光刘毅,焦吉庆*,吕柏泽,王久兴(青岛大学材料科学与工程学院国家杂化材料技术国际联合研究中心国际科学技术合作国家基地,山东青岛266071)摘要:多组分异质结构纳米复合材料不仅可以继承每个组分原有的性能,而且还可以通过组分之间的相互作用诱导出新的化学、电子性能。
寻找色彩的尽头英文作文

寻找色彩的尽头英文作文英文:As I search for the end of color, I am reminded of the many shades and hues that exist in our world. From the vibrant red of a rose to the deep blue of the ocean, colors surround us in every aspect of our lives. But is theretruly an end to color? Can we ever truly see every shade and variation?I believe that the answer is no. Color is infinite and ever-changing. Just when we think we have seen every shade of green, a new one appears before our eyes. It is this constant evolution of color that makes it so fascinating and beautiful.One example of this is the sky. We often think of the sky as simply blue, but in reality, it is a constantly shifting canvas of colors. From the pink and orange hues of a sunrise to the deep purples and blues of a sunset, thesky is a perfect example of the endless possibilities of color.Another example is the world of fashion. Each season brings new color trends and combinations, showing us that there is always something new to discover in the world of color.So while I may never reach the end of color, I am excited to continue exploring and discovering the infinite possibilities that it holds.中文:寻找色彩的尽头,我想起了世界上存在的许多色调和色彩。
英语教学分类图库-颜色 Colors

Primary colors
Red, yellow, and blue They cannot be created by combining other colors
Tertiary colors
Resulting from mixing a primary and a secondary color, such as red range or blue green
and danger
Crimson: A deep, rich red color, often used to
describe the color of red wine or velvet
"The Scarlet Letter."
Ruby: A deep red color named after the precise gem, often associated with
Green vocabulary and expression
Green The color of nature and life, often associated with envy, jealousy, and money
Lime A bright green color, named after the city frost, often used to describe a fresh and vibrant shade
Color selection in home decoration
Color schemes in interior design
Examining how color schemes are used in interior design to create a desired wood or atmosphere, such as call and relaxation or vibration and energy
红花需得绿叶衬英语作文
红花需得绿叶衬英语作文Beauty Enhanced by Contrast: The Symbiosis of Scarlet and Verdant.The realm of nature teems with an intricate tapestry of colors, each hue playing a vital role in the delicate dance of life. Among the kaleidoscope of shades, the vibrant crimson of the red flower stands out with unparalleled allure. Yet, its beauty is not isolated but rather amplified by the presence of its verdant companion—the green leaf.In the garden of life, red and green form a harmonious contrast, each element enhancing the other's radiance. The deep scarlet petals of the rose, soft and velvety to the touch, would appear less striking without the backdrop of its emerald leaves. The glossy green foliage provides arich canvas against which the crimson blooms dance, capturing the eye's attention and igniting a sense of awe.The interplay between red and green is not merely aesthetic but also symbolic. Red, often associated with passion, love, and energy, represents the fire that burns within us. Green, on the other hand, embodies growth, renewal, and tranquility. Together, they reflect theduality of life—the passionate flame and the serene haven that nurtures it.Beyond the garden, the symbiotic relationship between red and green manifests itself in countless other ways. In the vibrant plumage of birds, the scarlet feathers of cardinals and tanagers contrast with the olive wings that carry them aloft. In the watery depths, the crimson fins of goldfish and betta fish dance amidst the lush green of aquatic plants.The human experience is also enriched by the interplay of red and green. In the fashion world, designers harness the power of contrast to create striking ensembles. A scarlet dress, paired with emerald accessories, commands attention and exudes sophistication. In the realm of art, painters and sculptors have long recognized the potency ofthis chromatic pairing, using it to evoke emotions and convey profound messages.Psychologically, the colors red and green have distinct effects on our perceptions and behaviors. Red is known to stimulate the senses, increase heart rate, and promote arousal. Green, conversely, has a calming effect, reduces stress levels, and fosters relaxation. The combination of these colors creates a dynamic tension that keeps us both engaged and at ease.In the digital realm, the interplay of red and green has become a cornerstone of user interface design. Traffic lights, for instance, utilize the contrast between red (stop) and green (go) to regulate the flow of vehicles, ensuring safety and efficiency. Similarly, websites and mobile applications often employ a red, green, and yellow color scheme to guide users through tasks and providevisual cues.The symbiotic relationship between red and green is a testament to the power of contrast. It is in the interplayof opposing elements that true beauty and harmony emerge. The vibrant crimson of the red flower would be diminished without the presence of the verdant leaf, just as the passions of life would lose their intensity without the solace of tranquility.As we navigate the complexities of our world, may we draw inspiration from the symbiotic relationship between red and green. Let us embrace the contrast that life presents, understanding that it is through the interplay of opposing forces that we find balance, growth, and enduring beauty.。
(每日一读)高考英语考前突破 阅读理解能力 文化教育 毕加索《蓝色房间》下发现一隐藏画作素材

毕加索《蓝色房间》下发现一隐藏画作A hidden painting has been found by scient i sts beneath the brush strok es of The Blue Room, a 1901 Picasso artwork.人们在毕加索1901年画作《蓝色房间》下发现一隐藏画作。
Art experts and conservators at The Phillips Collection in Washington used infrared technology on the masterpiece, revealing a bow-tied man with his face res ting on his hand.Picasso created both works in Paris during his famous blue period."It's really one of tho se moments that really ma kes what you do special," said conservator Patricia Favero.Acknowledged as one of the 20th Century's greatest artists, Pablo Picasso focused on monochromatic(单色的) pain tings in shades of blue and blue-green during his blue period from 1900 to 1904.The Blue Room has been the subject of exploration since 2008 by experts from the Phillips Collection, National Gallery of Art, Cornell University and Delaware's Winterthur Museum.Improved infrared i magery al lowed them to see a man wearing a jacket and bow tie, resting his bearded face on his hand with three rings on his fingers.When the i mage was turned on its side, it revealed a portrait of a man.Technical analysis confirmed the hidden portrait was likely to have been painted just before The Blue Room.Favero added that, having found the second image back in 2008, they then wanted to know who the man was."We're still working on answering that question," she said.Curator Susan Behrends Frank told press agency AP: "When he [Picasso] had an idea, you know, he just had to get it down and realise it," explaining that the ar tist had quickly painted over another completed picture when the inspiration took him."He could no t afford to acquire new canvasses every time he had an idea that he wanted to pursue. He worked sometimes on cardboard because canvas was so much more expensive.''The Blue Room has been part o f the Phillips Collection since 1927.Conservators suspected back in 1954 it may have had another painting below its surface, as brushstrokes did not match the composition of a woman bathing in Picasso's studio.But it was not until the 1990s that an X-ray revealed a "fuzzy imag e" of something under the main image.Research on The Blue Room will continue and curators have planned a 2017 exhibition focusing on the painting and the portrait beneath it. It is also part of a tour to South Korea in 2015.This is not th e first time a hidden image has been fou nd beneath a Picasso artwork.A technical analysis of La Vie at the Cleveland Museum of Art revealed he had reworked the painting's composition, while a moustached man was found beneath the painting Woman Ironing at Manhattan's Guggenheim Museum.。
- 1、下载文档前请自行甄别文档内容的完整性,平台不提供额外的编辑、内容补充、找答案等附加服务。
- 2、"仅部分预览"的文档,不可在线预览部分如存在完整性等问题,可反馈申请退款(可完整预览的文档不适用该条件!)。
- 3、如文档侵犯您的权益,请联系客服反馈,我们会尽快为您处理(人工客服工作时间:9:00-18:30)。
Home Search Collections Journals About Contact us My IOPscienceBlue and red photoluminescence from Al2O3:Ce3+:Mn2+ films deposited by spray pyrolysisThis article has been downloaded from IOPscience. Please scroll down to see the full text article.2005 J. Phys.: Condens. Matter 17 3647(/0953-8984/17/23/016)View the table of contents for this issue, or go to the journal homepage for moreDownload details:IP Address: 219.246.49.75The article was downloaded on 26/08/2011 at 01:50Please note that terms and conditions apply.I NSTITUTE OF P HYSICS P UBLISHING J OURNAL OF P HYSICS:C ONDENSED M ATTER J.Phys.:Condens.Matter17(2005)3647–3656doi:10.1088/0953-8984/17/23/016Blue and red photoluminescence fromAl2O3:Ce3+:Mn2+films deposited by spray pyrolysis R Mart´ınez-Mart´ınez1,M Garc´ıa-Hip´o lito1,F Ramos-Brito2,J L Hern´a ndez-Pozos3,U Caldi˜no3and C Falcony41Instituto de Investigaci´o n en Materiales,Universidad Nacional Aut´o noma de M´e xico,PO Box20-364,01000M´e xico,DF,Mexico2Facultad de Ciencias F´ısico Matem´a ticas,UA de C,PO Box60-C,Campo Redondo,25280Saltillo,Coahuila,Mexico3Departamento de F´ısica,Universidad Aut´o noma Metropolitana-Iztapalapa,PO Box55-534,09340M´e xico,DF,Mexico4Centro de Investigaciones y Estudios Avanzados del IPN,Departamento de F´ısica,PO Box14-7400,7000M´e xico,DF,MexicoReceived14October2004,infinal form8March2005Published27May2005Online at /JPhysCM/17/3647AbstractAl2O3:Ce3+:Mn2+films deposited by the spray pyrolysis technique show blueand red emissions under ultraviolet light excitation.The blue emission is dueto the de-excitation of Ce3+ions from their excited state5d to the split groundstate2F.The usually weak red emission attributed to3d→3d de-excitation ofMn2+is enhanced through an efficient energy transfer from Ce3+to Mn2+ions.The most probable mechanism of Ce3+→Mn2+energy transfer is found to beelectric dipole–quadrupole interaction.The quantum efficiency of this transferwas estimated as being near to100%,which makes thesefilms interestingphosphors for the design of luminescent layers inflat-panel displays with two-colour emission.1.IntroductionAluminium oxide thinfilms have received considerable attention in recent years due to their possible applications as dielectric layers in various kinds of microelectronic devices[1,2]. In particular,thesefilms present high radiation resistance,high thermal conductivity, high chemical stability and low permeability to alkali impurities.These properties make them excellent candidates for applications as gate oxides in metal–oxide–semiconductor structures,e.g.as dielectricfilms in chemical sensors,passivation layers and hard coatings on several substrates[3,4].Moreover,Al2O3can be an important component in thinfilm electroluminescent devices because of its wide energy band gap,and as an optical active layer inflat-panel displays[5],which require thinfilms with good luminescent properties and chemical stability.Wide band gap materials incorporating rare earth(RE)ions,such as Eu3+[6],Tb3+[7,8]and Ce3+[9],which emit through excitation–relaxation processes within their own energy levels,have turned out to be of great interest for these applications[10]. 0953-8984/05/233647+10$30.00©2005IOP Publishing Ltd Printed in the UK36473648R Mart´ınez-Mart´ınez et al Flat-panel display applications require good quality materials emitting the three basic colours (blue,green and red).Efficient blue emitting material has been difficult to obtain,so at thepresent there continues an intensive research drive to resolve this problem[11].Recently, efficient blue emission was achieved in CeCl3doped aluminium oxidefilms deposited byspray pyrolysis under specific deposition conditions(substrate temperature during deposition, amount of cerium mixed in the spraying solution andfilm stoichiometry)[9].Spray pyrolysis is a low cost deposition technique suitable for large area deposition of thinfilms[12,13].Onthe other hand,red emission can be achieved by co-doping thefilm with ions emitting in this range of wavelengths,such as Mn2+.In fact,although the Mn2+d→d absorption transitions are forbidden by spin and parity for electric dipole radiation absorption,such ions can beefficiently sensitized by RE ions such as Ce3+[14,15].Because it is important tofind efficient blue and red emitting materials for the design of luminescent layers inflat-panel displays,inthe present work the Ce3+-sensitized Mn2+luminescence in Al2O3:Ce3+:Mn2+films prepared by the spray pyrolysis technique is analysed.To our knowledge,this is thefirst work on Mn2+ luminescence sensitized by Ce3+ions in Al2O3films.2.Experimental procedureAl2O3films doped with Ce3+and/or Mn2+ions were prepared using the spray pyrolysis technique[16].In this technique a solution with appropriate reactive materials is sprayedthrough a spraying nozzle over a hot substrate at atmospheric pressure.The spraying solution was a0.07M solution of Al2Cl3·6H2O dissolved in de-ionized water(18M cm−1),and CeCl3and MnCl2(Aldrich Chemical Co.)were added as doping materials.The spray wasproduced by means of an ultrasonic generator at a frequency of0.8MHz.Filtered air was used as the transport gas,at aflow rate of10l min−1.The solution was sprayed at a rate of 1ml min−1.Corning7059glass slides were used as substrates.The substrate temperature during thefilm deposition was300◦C.The time of synthesis was6min for afilm thickness of about5µm,as measured with a profilometer,Sloan Dektak IIA.The surface roughness of thefilms,as measured by the profilometer,turned out to be0.66±0.03µm.The crystalline structure of the sample was analysed by x-ray diffractometry(XRD)using a1.540Å(Cu Kα) Siemens D5000diffractometer,which was operated at30keV.The chemical composition of thefilms was measured using energy dispersive spectroscopy (EDS)with a Leica Cambridge Electron Microscope model Stereoscan440equipped with a beryllium window x-ray detector.Luminescence spectra were obtained with a Perkin-Elmer LS-50B spectrometer.Emission spectra after254nm excitation were recorded using an UV mercury lamp,8W model UVGL-25,so that the sample luminescence could be detected by means of an opticalfibre coupled to the spectrometer operated in the bioluminescence mode.Lifetime data of the Mn2+emission and time resolved spectra were obtained with this spectrometer operated in the phosphorescence mode.Lifetime measurements of the Ce3+emission were carried out by exciting the sample at355nm with10ns pulses of a Lumonics HY-1200third-harmonic Nd:YAG laser.The samplefluorescence was monitored by a0.5M Spex monochromator and a Hamamatsu R636photomultiplier tube,and then processed by a Hewlett-Packard model54201A digitizing oscilloscope.All measurements were carried out at room temperature.3.Results3.1.EDS measurementsThe chemical composition values measured from EDS spectra for thefilms deposited with solution concentrations of5and10at.%of CeCl3and1,3and5at.%of MnCl2(with respectBlue and red photoluminescence from Al 2O 3:Ce 3+:Mn 2+films deposited by spray pyrolysis36491020304050607080902θ (degrees)X R D I n t e n s i t y (a . u .)Figure 1.X-ray diffraction pattern of the AOC5M1doubly doped film.Table 1.Chemical composition of the films as measured by EDS.Solution concentration (at.%)Chemical composition (at.%)Sample CeCl 3MnCl 2O Al Cl Ce Mn AOC55055.4934.48 6.65 3.380AOC1010047.8838.279.04 4.810AOC5M15157.7233.27 6.11 2.720.18AOC10M110157.9031.367.55 3.060.21AOC10M310350.5037.107.54 4.010.85AOM5562.7432.544.420.30to the Al content)are listed in table 1.The films will be referred to hereafter in terms of their solution concentration as AOC5,AOC10,AOC5M1,AOC10M1,AOC10M3and AOM5.It was found that the relative amount of chlorine in the films increases as the amount of CeCl 3and MnCl 2in the starting solution increases.This can be attributed to the production of residual chlorines during the solvent evaporation process,since the chemical reaction on the substrate surface on adding,for example,CeCl 3and MnCl 2might be [6]2AlCl 3+CeCl 3+MnCl 2+3H 2O →Al 2O 3:Ce 3+:Mn 2++6HCl ↑+n Cl 2↑.3.2.XRD measurementsThe crystalline structure of the samples was monitored by XRD.All samples studied exhibited a very broad band without any indication of crystallinity,typical for amorphous materials.Figure 1displays the diffraction pattern of the AOC5M1doubly doped film,from which such a very broad band associated with a non-crystalline state can be observed.The Ce 3+(Al 3+)and Mn 2+(Al 3+)substitution can,in principle,induce a substantial rearrangement of the nearest environment,which adjusts the space necessary to incorporate the Ce 3+(1.03Å)and Mn 2+(0.80Å)ions larger than the Al 3+ion (0.51Å)[17,18],and the divalent manganese charge compensation might be attained by residual chlorines.3.3.LuminescenceThe emission spectrum displayed by cerium singly doped films excited with ultraviolet light at 320nm consists of a blue broad band,which is associated with strong inhomogeneous3650R Mart´ınez-Mart´ınez etalWAVELENGTH (nm)E M I T T E D I N T E N S I T Y (a . u .)Figure 2.Excitation and emission spectra of the AOC5M1doubly doped film.The excitationspectra were taken at λem =400nm (solid thin curve)and 600nm (dashed curve).The emission spectra (solid thick curves)were obtained under excitation at 320nm.The excitation spectrum taken at 600nm and the Mn 2+emission spectrum were recorded with a delay time of 0.1ms.The inset shows the normalized Ce 3+emission spectra for the AOC5and AOC10films.broadening due to the amorphous structure of the films.The peak of this emission appears at 380nm in AOC5and it shifts toward larger wavelengths (390nm)in AOC10as can be appreciated from the AOC5and AOC10normalized emission spectra portrayed in the inset of figure 2.This behaviour of the blue emission is similar to the previously reported emission in aluminium oxide films doped with similar cerium concentrations [9]in the sense that it seems to be composed of two overlapping peaks.The relative intensity of these peaks depends on the amount of cerium in the film,so the lower energy peak becomes dominant as the cerium concentration is increased [9].Thus,the blue emission can be attributed to the de-excitation of Ce 3+ions from the 2D 3/2excited state to the split ground state,into their 2F 5/2and 2F 7/2components.In addition to the blue emission of Ce 3+ions,a red emission could be obtained by co-doping the film with Mn 2+ions.Figure 2shows excitation and emission spectra of the AOC5M1doubly doped film.The emission spectrum,obtained under excitation at 320nm,consists of the blue broad band characteristic of Ce 3+ions,peaking at ∼380nm,and a red broad band peaking at ∼600nm.The shape of the blue band is very similar to that observed in the AOC5singly doped film excited with the same wavelength.The red emission was observed by recording the spectrum 0.1ms after the excitation pulse,so that it becomes quite resolved from the Ce 3+blue emission.This red emission was observed only after the film was simultaneously doped with MnCl 2and,therefore,it can be attributed to the Mn 2+4T 1g (G )→6A 1g (S )transition.On the other hand,the excitation spectra were taken at 400nm (cerium emission)and 600nm (manganese emission).The excitation spectrum corresponding to the Ce 3+emission consists of two broad bands centred at ∼257and 320nm (solid thin curve in figure 2).This spectrum is analogous as the one monitored at the same wavelength (λem =400nm)for the AOC5singly doped film.The higher energy band (257nm)is similar to that observed in cerium chloride powder [9]and,therefore,it can be attributed to CeCl 3aggregates formed in the film.The 320nm excitation band is similar to that previously observed for cerium doped aluminiumBlue and red photoluminescence from Al 2O 3:Ce 3+:Mn 2+films deposited by spray pyrolysis3651WAVELENGTH (nm)E M I T T E D I N T E N S I T Y (a . u .)Figure 3.Excitation and Mn 2+emission spectra of the AOC5M1and AOM5films recorded with a delay time of 0.1ms.The excitation spectra were taken at λem =600nm and the emission spectra were obtained under excitation at 320nm.oxide films [9]and,hence,it can be associated with transitions from the 4f to the 5d electronic energy levels of Ce 3+ions.The excitation spectrum of the red emission,recorded with a delay time of 0.1ms,not only contains the 6A 1g (S )→4T 1g (G ),6A 1g (S )→4T 2g (G )and 6A 1g (S )→4A 1g ,4E g (G )Mn 2+absorption transitions,but also the 320nm Ce 3+absorption band.For comparison,figure 3shows the excitation spectra of the red emission taken at 600nm,as well as the Mn 2+emission spectra after excitation at 320nm,displayed by the AOC5M1and AOM5films.In the doubly doped film the Ce 3+4f →5d excitation band stands out from the 6A 1g (S )→4T 1g (P ),4E g (D )and 4T 2g (D )Mn 2+transitions and a notable enhancement of the Mn 2+emission is observed,in spite of its quite low manganese concentration (0.18at.%).On the other hand,in the AOM5singly doped film the quite weak manganese emission becomes partially overlapped by the high background under the Mn 2+spectrum.3.4.Lifetime measurementsLifetime measurements performed on the Ce 3+emission observed in the films containing cerium were carried out monitoring the emission at 400nm after 355nm laser pulsed excitation.In the absence of Mn 2+ions the Ce 3+emission decay is exactly simple exponential,whereas in the presence of Mn 2+ions the decay is non-exponential,so it could be fitted to a double-exponential decay,with a time constant at long times close to the value obtained without transfer.The results obtained are listed in table 2.As an example,the Ce 3+emission decay curves and their fitting through exponential functions for the AOC10and AOC10M3films excited at 355nm are portrayed in figure 4.On the other hand,from lifetime measurements carried out on the Mn 2+emission at 600nm under 320nm excitation an exponential emission decay with a lifetime value of 1.7±0.3and 1.3±0.2ms in the AOC5M1and AOC10M3films,respectively,could be corroborated.This great difference between the Ce 3+and Mn 2+emission decay times allowed us to resolve the Mn 2+emission from the Ce 3+emission after 320nm excitation using time resolved spectroscopy.3652R Mart´ınez-Mart´ınez et alFilmλexc(nm)λem(nm)τCe(µs)τMn(ms)AOC5355400 2.4AOC10355400 2.6AOC5M1320600 1.73554000.1a2.6AOC10M3320600 1.33554000.4a2.9a Double-exponential decay.4.DiscussionThe presence of the320nm Ce3+absorption band in the excitation spectrum of the Mn2+ emission,the enhancement of the Mn2+emission after320nm excitation in AOC5M1withBlue and red photoluminescence from Al 2O 3:Ce 3+:Mn 2+films deposited by spray pyrolysis3653WAVELENGTH (nm)E M I T T E D I N T E N S I T Y (a . u .)Figure 5.Overlap region of Mn 2+absorption (dashed curve)and Ce 3+emission (solid curves).The inset shows the normalized line-shape functions.The Mn 2+absorption spectrum was taken from the AOM5excitation spectrum displayed in figure 3.respect to that observed in AOM5and the non-exponentialnature of the Ce 3+emission decay in the presence of Mn 2+provide clear evidence that energy transfer from Ce 3+to Mn 2+ions occurs in the doubly doped film.This process is expected to occur taking into account that the cerium emission overlaps the Mn 2+6A 1g (S )→4T 1g (G ),6A 1g (S )→4T 2g (G ),6A 1g (S )→4A 1g ,4E g (G ),6A 1g (S )→4T 2g (D ),6A 1g (S )→4E g (D )and 6A 1g (S )→4T 1g (P )absorption (excitation)transitions,as it can be appreciated from the normalized spectra portrayed in figure 5.The fact that the excitation spectrum of the Ce 3+emission in AOC5M1is the same as that obtained in AOC5indicates the absence of back energy transfer.Although it is not possible to know the actual nature of the Ce 3+–Mn 2+interaction producing the energy transfer from Ce 3+to Mn 2+ions,it is expected that a short range interaction mechanism might be taking place for such ions.The short lifetime measured for the Ce 3+emission proves that the 4f →5d absorption transition of the Ce 3+ions is electric dipole allowed.On the other hand,the long lifetime measured for the Mn 2+emission reveals the forbidden nature of the 3d →3d transitions.Therefore,it is expected that the Ce 3+→Mn 2+energy transfer could occur via an electric dipole–quadrupole interaction mechanism.The transfer rate W DQsa for the electric dipole–quadrupole interaction between sensitizer (Ce 3+)and activator (Mn 2+)ions is related to the electric dipole–dipole transfer probability W DDsathrough the following relationship [19]:W DQ sa=f q f d λCe R sa2W DD sa ,(1)3654R Mart´ınez-Mart´ınez et alTable 3.Calculated rates and quantum efficiencies of Ce 3+→Mn 2+energy transfer using electricmultipolar interaction mechanisms (dipole–dipole and dipole–quadrupole)and Ce 3+intrinsicradiative decay rates (1/τoCe )in the AOC5M1and AOC10M3films.Film 1/τo Ce (s −1)W DD sa(s −1)W DQsa (s −1)ηDD (%)ηDQ (%)AOC5M14.2×1051.0×1058.6×10719.499.5AOC10M33.8×1051.6×1051.5×10829.499.7where λCe is the wavelength position of the cerium emission,R sa is the interaction distance between the Ce 3+and Mn 2+ions involved in the energy transfer,f q (∼10−10)and f d (∼10−7)are the oscillator strengths of the Mn 2+ion electric quadrupole and dipole transitions,respectively.The expression for W DDsais [19]W DDsa =3¯h 4c 44πn 4τoCe 1R sa6Q Mn ,(2)where n is the refractive index of the host medium,τoCe is the Ce 3+ion intrinsic lifetime inthe absence of Mn 2+ions,Q Mn is the oscillator strength of the Mn 2+absorption transitions,which are in resonance with the Ce 3+emission transition,and = [F Ce (E )F Mn (E )/E 4]d E is the spectral overlap integral of the normalized line-shape functions of the Ce 3+emission F Ce (E )and Mn 2+absorption F Mn (E ),E being the transfer energy.The remaining symbols in equation (2)have their usual meaning.Because the optical absorption spectrum of Mn 2+ions was hardly detectable,due to the forbidden nature of their transitions,even at very high resolution conditions of the optical spectrophotometer,the manganese integrated absorption coefficient was estimated using the relationship Q Mn =4.8×10⁻²⁰eV m 2·f d ,derived by Blasse [20].The overlap integral was calculated using the functions F Ce (E )and F Mn (E )in the overlap region,which are shown in the inset of figure 5.The function F Mn (E )was obtained from the excitation spectrum of the 600nm Mn 2+emission displayed by the AOM5film (figure 3).Thus, was found to be 4.3×10⁻³and 6.4×10⁻³eV −5for AOC5M1and AOC10M3,respectively.Therefore,in AOC10M3the overlap between the Ce 3+emission and Mn 2+excitation line functions is greatly improved because the Ce 3+emission moves further to the lower energy side.The energy transfer rates W DQ saand W DDsa found from equations (1)and (2)for the AOC5M1and AOC10M3films,in which the Ce 3+–Mn 2+spacing can be taken as R sa ≈4.1and 4.0Å,respectively,are given in table 3.The Ce 3+intrinsic radiative decay rates (1/τoCe)for both films are also included in the table for comparison.The R sa interaction distances were roughly estimated from the Ce 3+and Mn 2+amounts determined by EDS for each film assuming a uniform ion distribution.As expected,an electric dipole–quadrupole interaction mechanismis quite a lot more probable than the electric dipole–dipole one.In fact,the W DDsatransfer rate is lower than the Ce 3+intrinsic radiative decay rate.It can also be noted that for AOC10M3the transfer rates are higher than for AOC5M1as a consequence of the better overlap between the Ce 3+emission and Mn 2+absorption (excitation).The R osacritical interaction distance between Ce 3+and Mn 2+ions for energy transfer,that is,the distance at which the energy transfer rate is equal to the Ce 3+ion intrinsic decayrate (W DQ sa τoCe =1),was estimated from equations (1)and (2),using the values found for and that estimated for Q Mn .These distances turned out to be ∼8Å(8.0Åin AOC5M1and8.4Åin AOC10M3).Therefore,the R sa distance (∼4Å)is smaller than the R osa distance.From this finding along with the fact that the overlap of the normalized Ce 3+emission and Mn 2+absorption (excitation)is quite good and similar to those found in other systems [14,15],an efficient Ce 3+→Mn 2+energy transfer can be expected.Blue and red photoluminescence from Al 2O 3:Ce 3+:Mn 2+films deposited by spray pyrolysis3655E M I T T E D I N T E N S I T Y (a . u .)1/τCe(3)andW sa =1/τCe −1/τo Ce,(4)we have [21,22]η=W sa τoCe1+W sa τo Ce.(5)So the quantum efficiency of energy transfer for an electric dipole–dipole or dipole–quadrupoleinteraction mechanism can be evaluated from equation (5).The values of ηobtained for the AOC5M1and AOC10M3films are listed in table 3.A quantum yield near to 1is obtained for an electric dipole–quadrupole interaction,which indicates that the Mn 2+red emission can be sensitized by Ce 3+ions with efficiency near to 100%.This quite high efficiency is evidenced by the strong reduction of the Ce 3+emission intensity in the presence of manganese (figure 4).In fact,such an intensity reduction is even more evident for doubly doped films excited at 254nm with an UV mercury lamp.Figure 6portrays emission spectra recorded for the AOC10,AOC10M1and AOC10M3films excited at 254nm.In addition to the red emission being observed on co-doping the film with manganese,the Ce 3+emission in the AOC10M1and AOC10M3films becomes partially and completely quenched,respectively.Thus,the emissions observed from the AOC10M1and AOC10M3films excited with the short wavelength line (254nm)of an UV mercury lamp appear eye red–blue and eye red only,respectively.3656R Mart´ınez-Mart´ınez et al5.Summary and conclusionsA blue–red emission phosphor under ultraviolet light excitation can be manufactured with Al2O3:Ce3+:Mn2+films deposited by the spray pyrolysis technique.These emissions have been attributed to the5d→4f de-excitation of Ce3+ions(blue emission)and3d→3d de-excitation of Mn2+ions(red emission).The intense blue emission is a broad band including the two transitions from the5d-excited state to the2F5/2and2F7/2components of the ground state.This luminescence feature has an advantage for display techniques,which require a purer blue emission.The weak red emission observed in the AOM5manganese singly doped film is found to be quite enhanced through an efficient energy transfer from Ce3+to Mn2+ions in the AOC5M1doubly dopedfilm.The spectroscopic data obtained suggest that the energy transfer occurs through a short range interaction mechanism.An electric dipole–quadrupole interaction seems to be the most probable mechanism occurring in the Ce3+–Mn2+complexes. The quantum yield of energy transfer was estimated as being near to100%,which makes these Al2O3:Ce3+:Mn2+films interesting phosphors for the design of luminescent layers inflat-panel displays emitting simultaneously in two of the three basic colours(blue and red). AcknowledgmentsThe work was supported by CONACyT under projects No43016-F and No G37858-E.The authors thank J Guzm´a n and L Ba˜n os for technical support in EDS and XRD measurements. Also,the technical assistance of J Garc´ıa-Coronel,M Guerrero,A Soto,M Flores and A Lira is acknowledged.R Mart´ınez gratefully acknowledges the CONACyT grant No163802.The authors are grateful to the referees for the critical reading of the manuscript and for their useful suggestions.References[1]Aguilar-Frutis M,Garc´ıa M and Falcony C1998Appl.Phys.Lett.721700[2]Kolodzey J,Chowdhury E,Adam T,Qui G,Rau I,Olowolafe J,Suehle J and Chen Y2000IEEE Trans.Electron.Devices47121[3]Gustin K M and Gordon R G1988J.Electron.Mater.17509[4]Saraie J and Ngan S1990Japan.J.Appl.Phys.1291877[5]Tannas E L1985Flat Panel Displays and CRT(New York:Van Nostrand-Reinhold)[6]Mart´ınez E,Garc´ıa M,Ramos-Brito F,´Alvarez-Fregoso O,L´o pez S,Granados S,Ch´a vez-Ram´ırez J,Mart´ınez R M and Falcony C2000Phys.Status Solidi b220677[7]Falcony C,Ort´ız A,Dom´ınguez J M,Far´ıas M H,Cota-Araiza L and Soto G1992J.Electrochem.Soc.139267[8]Esparza-Garc´ıa A E,Garc´ıa-Hip´o lito M,Aguilar-Frutis M A and Falcony C2003J.Electrochem.Soc.150H53[9]Falcony C,Garc´ıa M,Ortiz A,Miranda O,Gradilla I,Soto G,Costa-Araiza L,Farias M H and Alonso J C1994J.Electrochem.Soc.1412860[10]Benalloul P and Benoit J1991Luminescence—Phenomena,Materials and Devices ed R P Rao(Commack,NY:Nova Science)[11]Depp S W and Howard W E1993Sci.Am.26640[12]Jergel M,Conde-Gallardo A,Garc´ıa M and Falcony C1998Appl.Phys.Lett.721700[13]Ortiz A,Garc´ıa M,S´a nchez A and Falcony C1989J.Electrochem.Soc.1361232[14]Caldi˜n o U G2003J.Phys.:Condens.Matter153821[15]Caldi˜n o U G2003J.Phys.:Condens.Matter157127[16]Langlet M and Joubert J C1992Chemistry of Advanced Materials ed C N R Rao(Oxford:IV-PAC-Blackwell)pp55–79[17]Low W and Suss J T1960Phys.Rev.119132[18]Kaplyanskii A A,Kulinkin A B,Kutsenko A B,Feofilov S P,Zakharchenya R I and Vasilevskaya T N1998Phys.Solid State401310[19]Dexter D L1953J.Chem.Phys.21836[20]Blasse G1969Philips Res.Rep.24131[21]Kumar G A,Biju P R,Jose G and Unnikrishnan N V1999Mater.Chem.Phys.60247[22]Paulose P I,Jose G,Thomas V,Unnikrishnan N V and Warrier M K R2003J.Phys.Chem.Solids64841。