Phase Diagrams from Topological Transitions The Hubbard Chain with Correlated Hopping
量子多体系统的理论模型
量子多体系统的理论模型引言量子力学是描述微观物质行为的基本理论。
在量子力学中,描述一个系统的基本单位是量子态,而量子多体系统则是由多个量子态组成的系统。
由于量子多体系统的复杂性,需要借助一些理论模型来描述和研究。
本文将介绍一些常见的量子多体系统的理论模型,包括自旋链模型、玻色-爱因斯坦凝聚模型和费米气体模型等。
通过对这些模型的研究,我们可以深入了解量子多体系统的行为和性质。
自旋链模型自旋链模型是描述自旋之间相互作用的量子多体系统的模型。
在自旋链模型中,每个粒子可以处于自旋向上或向下的两种状态。
粒子之间通过自旋-自旋相互作用产生相互作用。
常见的自旋链模型包括Ising模型和Heisenberg模型。
Ising模型Ising模型是最简单的自旋链模型之一。
在一维Ising模型中,每个自旋可以取向上(+1)或向下(-1)。
自旋之间通过简单的相邻自旋相互作用来影响彼此的取向。
可以使用以下哈密顿量来描述一维Ising模型:$$H = -J\\sum_{i=1}^{N}s_is_{i+1}$$其中,J为相邻自旋之间的交换耦合常数,s i为第i个自旋的取向。
Heisenberg模型Heisenberg模型是描述自旋间相互作用的模型,与Ising模型不同的是,Heisenberg模型中的自旋可以沿任意方向取向。
常见的一维Heisenberg模型可以使用以下哈密顿量来描述:$$H = \\sum_{i=1}^{N} J\\mathbf{S}_i \\cdot \\mathbf{S}_{i+1}$$其中,$\\mathbf{S}_i$为第i个自旋的自旋算符,J为自旋间的交换耦合常数。
玻色-爱因斯坦凝聚模型玻色-爱因斯坦凝聚是一种量子多体系统的现象,它描述了玻色子统计的粒子在低温下向基态排列的行为。
玻色-爱因斯坦凝聚模型可以使用用薛定谔方程来描述:$$i\\hbar\\frac{\\partial}{\\partial t}\\Psi(\\mathbf{r},t) = -\\frac{\\hbar^2}{2m}\ abla^2\\Psi(\\mathbf{r},t) +V(\\mathbf{r})\\Psi(\\mathbf{r},t) +g|\\Psi(\\mathbf{r},t)|^2\\Psi(\\mathbf{r},t)$$其中,$\\Psi(\\mathbf{r},t)$是波函数,m是粒子的质量,$V(\\mathbf{r})$是外势场,g是粒子之间的相互作用常数。
读懂相图的方法

WAYS TO UNDERSTAND T-X PHASE DIAGRAMS浙江大学材料科学与工程系张昶Summary:Phase diagrams, especially T-x phase diagrams, is useful in showing the physical changes that mixtures undergo when the temperature or their composition is changed. But to understand a phase diagram is not easy, especially when several kinds of substances exist and they are not stable. In this article we summarize the points, lines and regions that may appear in a phase diagram, and then come up with rules to understand T-x phase diagrams. This article is not a research paper, but a learning paper. It is helpful in the process of learning and reviewing the chapter of phase diagram.Keywords: points, lines, regions, laws, rules, examplesChapter One: Geometry ElementsIn this chapter we discuss geometry elements that may appear in a phase diagram. We should remember their characteristics and the substances, phases in the regions so that we can find and understand them easily in a real phase diagram.1-1Points1-1-1 AzeotropesDeviations from ideal solutions sometimesresult in azeotropes, which can be divided intohigh-boiling azeotropes and low-boilingazeotropes according to whether there is ahighest boiling point of the mixture.It’s easy to recognize the two lines in theleft pictures with regard to the temperature.The one above is gas-phase line and the otherone is liquid-phase line. Hence the regionabove both of them is gas-phase region (P=1)and the one below them is liquid-phase region(P=1) and the one between them is the regionwhere the both phases exist (P=2).The characteristic of an azeotrope is that itis the place where two slim ellipses meet.Notice thatthe two ellipses always turn towards the sameside.*If we replace ‘g ’ by ‘l ’, and ‘l ’ by ‘s ’ in the phase diagrams above, we can also get a solid-solid phase diagram whose solids are completely miscible. There will be a highest constant melting point or a lowest constant melting point as well.1-1-2 EutecticsEutectic is the lowest melting point of a eutectic composition. Now we discuss the congruent melting. Look at the picture below. Line JKL is the bond line of different regions. It means a limit, but not the condition of the whole system. The horizontal line through F is a three-phase line. So the region above line JKL is liquid- phase region (P=1).The region between the two lines is the twophase region which can be labeled ‘liquid+Bi ’or ‘liquid+Cd ’ (P=2). The region below thethree-phase line is solid-phase region. We canalso divide the region into two parts due to theformation of the eutectic mixture Cd BiE . Let ’s draw a vertical line through K. That ’s the puresubstance line of Cd BiE . On the left of it lies the Cd Bi E +Bi region and Cd BiE +Cd region on the right. Thesymbol of the a eutecticis1-1-3 Incongruent Melting PointsThe melting of an instable solid solution at a certaintemperature results in the formation of an incongruent meltingpoint. The left part below the line refers to the condition thatboth solid solution I and liquid exist (P=2). The right partrefers to the condition that both solid solution I and solidsolution II exist (P=2). The middle part refers to the conditionthat only solid solution I exist (P=1).1-2 L ines1-2-1 Pure Substance LinePure substance line is a vertical line. It means only one composition exists on this line. According to the phase law: 1*+=Φ+C f . Because only the temperature ischangeable, *f=1. Because the line exists in one region, Φ=1. So we come to the conclusion that C=1. We can only find this line in solid phase.There are two kinds of pure substance lines, now we’ll introduce them below..1-2-1-1 Stable Pure Substance LinesThe first one is stable pure substance line which has got acurved line on it and they look like an umbrella. The freezingpoint is depressed because other substances are added in.1-2-1-2 Instable Pure Substance LinesThe second one is instable pure substance line which has got ahorizontal line on it and they look like a letter ‘T’.Because the substance is instable, it is decomposed into liquidand another kind of solid above a certain temperature.1-2-3 Three-Phase LinesAny horizontal line is a three-phase line. According to thephase law:1*+f. Because the temperature is fixed,+C=Φ*f=0. Because there are two compositions, C=2. So we come to the conclusion that Φ=3.Eutectic line, incongruent melting line are both three-phase lines.*We don’t discuss eutectic lines and incongruent melting lines in this section because they have been discussed in 1-1 as points.1-3 Regions1-3-1 Partially Miscible LiquidsThere are three kinds of regions in the phase diagrams ofpartially miscible liquids: regions with an upper criticaltemperature, regions with a lower critical temperature, regionswith both an upper critical temperature and a lower criticaltemperature. But only the first one is common.The characteristic of the regions is that they are in a closed curve like cap. What’s more, the number of phases in the cap-shaped region is two and the number of phases in the outside region is one.1-3-2 Partially Miscible SolidsThere are two kinds of regions in the phase diagram of partially miscible solids: regions with eutectics, regions with incongruent melting points. The substances and phases in different regions have been discussed in 1-1-2 and 1-1-3, so we don’t write them again. We should remember the basic shapes of the two phase diagram by heart.Chapter Two: Laws and RulesIn this chapter we introduce rules and laws to help understand phase diagrams. It’s OK to understand phase diagrams only with the geometry elements in chapter 1, but with these rules we can solve the problems more easily.2-1 A region of only one kind solid solution is usually not surrounded by a three-phase line.2-2 A region of miscible solutions is usually not surrounded by a three-phase line.2-3 Neighboring phase region law: If we minus the number of phases of a region by the number of phases of a neighboring region, the result will be either 1 or -1 (We regard the pure-substance line as a one-phase region and the three-phase line as a three-phase region).2-4 The region between two one-phase regions is a two-phase region where both the substances in the two one-phase regions exist.Interpretation:(1)*2-1, 2-2 and 2-3 are just special cases of Palatnik and Landau’s rule, you can see the full expression of it in the reference essay [6].(2)2-4 is a deduction of 2-3.(3)With these two rules we can easily find one-phase regions in phase diagrams. After we have determined the one-phase regions with 2-1, 2-2 and three-phase lines (regions) with 1-1-3, we can determine the left two-phase regions due to 2-3.(4)Substances in two-phase regions sometimes can be determined by 2-4.Chapter Three: Steps and Examples3-1 STEPS: Now we introduce the basic steps to understand a phase diagram based on the geometry elements and laws discussed above.(1)Recognize the obvious regions such as liquid or gas regions.(2)Find regions that are not surrounded by three-phase lines, they are probably one-phase regions according to 2-1 and 2-2. Then find vertical lines that refer to pure substance lines according to 1-2-1. Then label the two-phase region between two one-phase regions according to 2-3 and 2-4.(3)Find geometry elements in the phase diagram. If the two components are the similar to those that are discussed in chapter one, then imitate them to label the regions.*Step 2 and 3 can be swapped, but do as the steps introduced above will be more convenient.3-2-1 Example 1: Label the regions of the phase diagram below. State what substances exist in each region. Label each substance in each region as solid, liquid or gas.Analysis:In this example we don’t use the rules in chapter 2.First, it ’s easy to know that region 1 is liquid.Second, we can find that AB is an instable pure substance line according to 1-2-1-2. Then we know the instable substance is Z, which is made from A and B. According to 2-4, we know that the substances in region 2 to 4 can be determined by the bonds. So, region 2 is X(s) +l, region 3 is Z(s) +l, region 4 is X(s) +l.Third, we can find those region 6 to 10 are the regions of solid solutions with incongruent melting points according to 1-3-2. So we can just copy the substances and phases of the second picture in 1-3-2. Region 6 is )(s β, region 7 is )(s β+l, region 8 is )(s α+l, region 9 is )(s α, region 10 is )()(s s βα+.3-3-2 Example 2: Label the regions of the phase diagram below. State what substances exist in each region. Label each substance in each region as solid, liquid, or gas. Region 7 and region 11 is already known.Analysis :There are some unfamiliar regions in the phase diagram so we should make use of the rules and laws in chapter 2.First, it ’s easy to understand that region 1 is liquid.Second, according to 2-4, we can find that region 5 is )(s α+l, region 6 is )(s β+l, region 8 is )()(s s βα+, region 9 and 10 are )(s β+ l. (We may also determine region 9 to 11 by H, a lowest constant melting point.)Third, according to 1-2-1-1 and 1-1-2, we find BC is the stable pure substance line of C and A is a eutectic of pure X and pure Z (compound of X and Y). So we copy the substances and phases in 1-1-2. Region 2 is X(s) + l, region 3 is Z(s) + l, region 4 is X(s) + Z(s).*Now we can find that it’s easier to understand the phase diagrams with the laws and rules introduced in chapter 2.Reference Books and Essays:[1]《物理化学学习指导》南大第五版 高等教育出版社 p235-p243[2]《Atkins ’ Physical Chemistry 影印版》, 高等教育出版社[3]《材料科学基础》 二元相图分析 上海交通大学出版社[4]工程材料课程课件 2.2合金的结晶 某石油大学[5]《固体物理》 黄昆著 第八章 相图 高等教育出版社[6]恒压相图中紧邻相区及其边界的关系 吉林大学化学系 赵慕愚。
Ternary_Phase_Diagrams
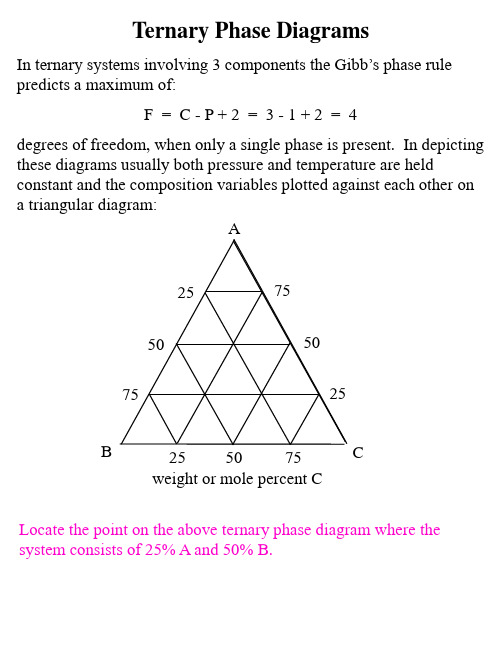
When the system is at an overall composition described by point j in the evaporative sequence: What mass of water remains in the syer has evaporated?
What is the mass of the liquid solution of composition b that remains?
How many grams of KCl and NaCl remain dissolved in this liquid?
How many grams of solid KCl and solid NaCl have precipitated from the solution
The mass of KCl that has precipitated by the time the system has reached point e can be calculated by applying the lever law to a tie line (line gf) that passes through point e and intersects the pure solid KCl corner: mKCl (s) = mtotal (ef / gf) = (mH2O remaining + mKCl + mNaCl ) (ef / gf) = (32 g + 20 g + 10 g) (10 / 152) = 4 grams What is the composition of the liquid solution that is in equilibrium with this 4 grams of precipitated pure solid KCl? When the system has reached point h in the evaporative sequence, it is saturated in NaCl as well as KCl and pure solid NaCl will begin to precipitate from solution. How many degrees of freedom are present at point h? What are the 3 phases that are in equilibrium at point h and what are their compositions? By the time the system composition has reached point j, substantial pure solid NaCl has precipitated from the solution, as well as more pure solid KCl. The solution composition remains fixed at b. When the system has overall composition j, the masses of liquid of composition b and solid mixture that has precipitated can be calculated from a the tie line constructed through segment bj that intesects the pure solid KCl pure solid NaCl axis at point k. Once the mass of the solid mixture at point k is known, another application of the lever law along the tie line that extends along the pure solid KCl pure solid NaCl axis and passes through point k can be used to calculate the masses of pure solid KCl and NaCl that have precipitated from the solution and comprise the solid mixture at point k.
chapter4-phase diagrams相图双语

Chapter Outline
4.1 Definition and basic concepts 4.2 Binary alloy phase diagram 4.3 Isomorphous phase diagram 4.4 Eutectic phase diagram 4.5 Peritectic phase diagram 4.6 Intermetallic Compounds
PREVIOUS
NEXT
RETURN OUTLINE
RETURN
10/43
4.2 Binary alloy phase diagram
constant pressure (fixed parameter). Three independent variables: T, P, compositions The binary eutectic phase diagram explains the chemical behavior of two immiscible (unmixable) crystals from a completely miscible (mixable) melt.
3、mark critical points, and connect start and finish points of sodification 4、label various phase regions
a
PREVIOUS NEXT RETURN OUTLINE
b
RETURN 9/43
1085
Tie lines and phase compositions for a Cu-40% Ni alloy at several temperatures
晶体学基础-球面投影

22:14
11
晶体投影要解决的问题? -晶向(面)间关系的表达
1.晶面的夹角
P1与P2面的夹角-- OP1与OP2夹角φ: 过P1,P2与球心O做一大圆, P1P2的弧度。
Байду номын сангаас
22:14
13
(三)乌氏网(Wulff net)
刻度球的
极射赤平投影面 度量
22:14
15
乌氏网的应用
两极点之间角度测量
22:14
16
♣在投影图上任一个极点对应的密勒指数的确定:
一个晶面在空间的取向可以由它的法线与三个晶轴 [100]、[010]及[001]的夹角确定。
h:k:l=acosρ:bcosσ:ccosτ
注意: 量度两个极点间的角度,
是过两个极点的经线来量度。
计算机绘制任意投影面的标准极图。
22:14
17
晶体结构对称性:
材料科学基础
Fundamentals of Materials Science
晶体学基础-球面投影
22:14
0 绪论
材料科学与工艺 的基础理论
第1章 原子结构与结合键
Atomic Structure and binding bond
第2章 晶体学基础 Basis of Crystallography 第3章 晶体结构 Crystal Structure 第4章 晶体缺陷 Crystal defects 第5章 非晶体与准晶结构 Amorphous and
Quasicrystal Structure
第6章 相图 Phase Diagram 第7章 固体扩散 Solid Diffusion 第8章 凝固与结晶 Solidification and Crystallization 第9章 烧结与聚合 Sintering and Polymerization 第10章 固态 相变 Solid Phase Transformation
第四章-非线性信号的特征和表示法

第二节 混沌特征及其定量描述 (Chaotic Characteristics and Its
Quantitative Description)
一、混沌(chaos)
❖ 信息是客观事物的运动状态和存在方式的描 述。信息熵(entropy,物理学家严济慈将之 译成“熵”,隐含了Entropy的物理意义和计 算要点)从信息论的角度描述信息的复杂性, 用以表示信息(由信号携载)的复杂程度。
❖ 从混沌运动的轨道发散性出发,提出了量度 运动状态复杂性的公式,称为里雅普诺夫指 数。
第一节 分形体和分维数
(Fractal and Fractal Dimension)
一、分形体(Fractal)
❖ 具有非整数维的结构叫做分形体。就是说真实空间都充 满分形(fractal)特征,即现实世界是一个分形的世界。 维数大于1小于2的结构,是一个比直线复杂而又未完全 填充平面的一种结构。维数大于2小于3的结构,是一个 比平面复杂而又未完全分形的例子有科赫雪花 (Koch snowflake)和康托尘土 (Kongtor dust)。
二、分维数(fractal dimension)
❖ 量度分形体的这种结构复杂性的量叫分维数。 计算其自相似复杂性的分数维叫相似维。
❖ 下面以科赫雪花为例,说明如何计算相似维 及相似维量度其自相似复杂性的能力。图4-3 是用与图4-1同一个1/3的生成子生成的三种 不同的结构。
二、复杂度(Complexity)
❖ 复杂度就是复杂性的数字量度,或称为数学 模型。从非线性出发提出了一些数学模型; 从随机性出发也提出了一些数学模型。 除了前面已经介绍过的分维数外,再举几个 具体的量度复杂性的例子:近似熵和信息熵, 李雅普诺夫指数和混沌度。
PhaseDiagram

Chapter 8
3
8.2 Gibbs Phase Rule
Gibbs' phase rule describes the possible # of degrees of freedom (F) in a closed system at equilibrium, in terms of the number of separate phases (P) and the number of chemical components (C) in the system (derived from thermodynamic principles by Josiah W. Gibbs in the 1870s) F+P=C+2
Chapter 8
10
Lever Rule (cont.)
Chapter 8
11
Q.: A Cu-Ni alloy contains 47 wt % Cu and 53% of Ni and is at 1300oC. Use Fig.8.5 and answer the following: A. What is the weight percent of Cu in the liquid and solid phases at this temperature? B. What weight percent of this alloy is liquid and what weight percent is solid?
Chapter 8
9
8.5 The Lever Rule
The weight percentages of the phases in any 2 phase region can be calculated by using the lever rule Consider the binary equilibrium phase diagram of elements A and B that are completely soluble in each other
PhaseDiagram
Co
Mass fraction of B
Let x be the alloy composition of interest, its mass fraction of B (in A) is Cο Let T be the temperature of interest ⇒ at T alloy x consists of a mixture of liquid (with CL - mass fraction of B in liquid) and solid (CS - mass fraction of B in solid phase)
Chapter 8
12
8.6 Nonequilibrium Solidification of Alloys
⇐ constructed by using very slow cooling conditions
Atomic diffusion is slow in solid state; as-cast microstructures show “core structures” caused by regions of different chemical composition
Fig.8.10, Smith
Chapter 8 Phase Diagrams
A phase in a material is a region that differ in its microstructure and or composition from another region
Al2CuMg
H2O(solid, ice) in H2O (liquid) ⇒ 2 phases • homogeneous in crystal structure and atomic arrangement • have same chemical and physical properties throughout • have a definite interface and able to be mechanically separated from its surroundings
- 1、下载文档前请自行甄别文档内容的完整性,平台不提供额外的编辑、内容补充、找答案等附加服务。
- 2、"仅部分预览"的文档,不可在线预览部分如存在完整性等问题,可反馈申请退款(可完整预览的文档不适用该条件!)。
- 3、如文档侵犯您的权益,请联系客服反馈,我们会尽快为您处理(人工客服工作时间:9:00-18:30)。
a r X i v :c o n d -m a t /9903213v 1 12 M a r 1999Phase Diagrams from Topological Transitions:The Hubbard Chain with Correlated HoppingA.A.Aligia a ,K.Hallberg a ,C.D.Batista a ,and G.Ortiz baComisi´o n Nacional de Energ´ıa At´o mica,Centro At´o mico Bariloche and Instituto Balseiro,8400S.C.de Bariloche,ArgentinabTheoretical Division,Los Alamos National Laboratory,Los Alamos,NM 87545(Received February 1,2008)The quantum phase diagram of the Hubbard chain with correlated hopping is accurately determined through jumps in πin the charge and spin Berry phases.The nature of each thermodynamic phase,and the existence of charge and spin gaps,is confirmed by calculating correlation functions and other fundamental quantities using numerical methods,and symmetry arguments.Remarkably we find striking similarities between the stable phases for moderate on-site Coulomb repulsion:spin Peierls,spin-density-wave and triplet superconductor,and those measured in (TMTSF)2X.The search for electronic mechanisms of superconduc-tivity and the study of superconducting and Mott phase transitions are among the most interesting subjects of the physics of strongly correlated systems.In few cases,exact results have helped to elucidate the nature of these transitions [1–3].In general one has to rely on numerical calculations of finite systems for which quantities like the Drude weight D c (which should vanish for an insulator in the thermodynamic limit [4]),or any other correlation function,vary smoothly at the transition.Consequently,for instance,the boundaries between a charge-density-wave (CDW)or spin-density-wave (SDW)insulators and metallic phases in half-filled generalized Hubbard models were difficult to establish [5,6].The Berry phase is a general geometrical concept which finds realizations in various physical problems [7].It is the anholonomy associated to the parallel transport of a vector state in a certain parameter space.In condensed matter,the charge Berry phase γc is a measure of the macroscopic electric polarization in band or Mott insula-tors [8]while the spin Berry phase γs represents its spin polarization [9,10].In systems with inversion symmetry γc and γs can attain only two values:0or π(mod(2π)).Thus,if two thermodynamic phases differ in the topolog-ical vector γ=(γc ,γs )this sharp difference allows us to unambiguously identify the transition point even in finite systems.This “order parameter”was recently used to de-tect metallic,insulator and metal-insulator transitions in one-dimensional lattice fermion models [9,10].In this Letter we determine the quantum phase dia-gram of the Hubbard chain with correlated hopping at half-filling using topological transitions.The phase di-agram is very rich showing two metallic and two insu-lating thermodynamic phases each characterized by one of the four possible values of the topological vector γ.One of the metallic phases corresponds to a Tomonaga-Luttinger liquid with dominant triplet superconducting correlations at large distances (TS).This is interesting since there is experimental evidence indicating that the Bechgaard salts (TMTSF)2ClO 4and (TMTSF)PF 6un-der pressure are TS [11–13].Furthermore,the insulat-ing SDW and spin gapped spin-Peierls phase observed in (TMTSF)PF 6as the pressure is lowered [14]are also present in the model phase diagram.The effective model Hamiltonian is:[3]H = i,j σ(c †iσc jσ+h.c.){t AA (1−n i ¯σ)(1−n j ¯σ)+t BB n i ¯σn j ¯σ+t AB [n i ¯σ(1−n j ¯σ)+n j ¯σ(1−n i ¯σ)]}+U i (n i ↑−12).(1)H contains the most general form of hopping term de-scribing the low energy physics of a broad class of sys-tem Hamiltonians in which four states per effective siteare retained.In particular,the Hamiltonian H in Eq.(1)has been derived and studied for transition met-als,organic molecules and compounds [2],intermedi-ate valence systems,cuprates and other superconduc-tors [15].In the continuum limit,the only relevant in-teractions at half-filling are U and t AA +t BB −2t AB [16].Therefore,we restrict the present study to the electron-hole symmetric case (t AA =t BB =1)which has spin and pseudospin SU(2)symmetries,the latterwith generators η+= i (−1)i c †i ↑c †i ↓,η−=(η+)†,and ηz =1changes in the Berry phase by:∆P↑±∆P↓=e∆γc,s/2π(mod(e))[8–10].Thus,a phase transition will be de-tected by a jump inπofγc(γs)if and only if both ther-modynamic phases differ in P↑+P↓(P↑−P↓)by e/2 (mod(e)).For example,if one of the phases is a CDW with maximum order parameter(CDWM)and the other a N´e el state(N),one is transformed into the other trans-porting half of the charges(those with a given spin)one lattice parameter.In addition,as explained below,in the present model topological transitions inγc andγs indicate the opening of the charge and spin gap∆c,∆s. Wefind that the minimum of the GS energy as a func-tion offluxes,E g(φ↑,φ↓),corresponds to the so-called closed shell conditions(CSC):if the number of sites(as-sumed even)is L=2(mod(4)),then K=φσ=0,while for L multiple of four K=φσ=π(which is equivalent to taking antiperiodic boundary conditions and¯K=0inthecor-atspintwo topological transitions occur in the model,correspond-ing to a jump in eitherγc orγs.We have determined those transitions in rings of length L=6,8,10,12using the Lanczos method.The results extrapolated with a cu-bic polynomial in1/L are represented in Fig.1.In con-trast to other physical quantities which show largefinite-size effects,particularly near t AB=0[6],the topolog-ical transitions converge rapidly to the thermodynamic limit(for example,for t AB=0.05,γc jumps at U=3.451, 3.681,3.788,and3.846for L=6−12,and the ex-trapolated value is U=3.932).The numerical conver-gence becomes problematic for smaller t AB values.At t AB=0the transition points are determined from the exact solution[3]as those values of U where∆c and∆s open.Those critical values are U c,s=±4and match smoothly with the rest of the curves in Fig.1.It is easy to see that under CT the geometrical phases transform asγc←→γs+π[9].Thus,as seen in Fig.1,a jump in γc at U c(full line)implies a jump inγs at−U c(dashed line),and vice versa.In the case where all particles are localized one can easily determine the value of γasγc,s=Im ln z c,sL,where z c,s L= g|e i2πofdospin excitations form a subset of all charge excitations. In our case the charge velocity v c and∆c(computed as usual infinite systems L≤12[19])coincide with their pseudospin counterparts vηand∆η(computed from v s and∆s for opposite U)[21].This is consistent with the exact solution for t AB=0where the charge excitations of lowest energy are pseudospin ones[3].In addition, the charge-charge and spin-spin correlation functions are interchanged as U changes sign(see below).The open-ing of∆c whereγc jumps from0toπis also consistent with calculations of z c L,D c,superconducting correlation functions,Kρand central charge c.For t AB>1,∆c opens more slowly and the detection of the transition becomes more difficult.However,as shown in Fig.3,D c and z c L display a similar behavior near the jump inγc (U c=-1.702)as in the quarter-filled infinite U extended Hubbard model as a function of the nearest-neighbor re-pulsion V[18],where a metal-insulator transition takes place at V=2t.At large|U|the only relevant energy scale is4t2AB/|U|and therefore,D c increases with U for large negative U.Near U c there is a drastic change of behavior of D c and z L vs U,and for U>U c,the extrap-olated values suggest a tendency to reach the insulating values(D c=0,z c L=1),in the thermodynamic limit.z c L always decreases(increases)with L at the left(right)of U c.This is thefirst accurate(DMRG)calculation of z c L in a system of more than16sites.In order to further characterize each thermodynamic we use symmetry arguments and the following cor-functions(CF)(see Fig.4):χt(s)(d)=12(n0↑+n0↓−1)(n d↑+n d↓−1)χbsdw(d)=1All CF decay exponen-tially.To understand the nature of this insulating GS let us analyze the limit t AB→∞,where effectively there is a sequence of spin and pseudospin dimers.Each dimer is the ground state of the model for two sites and two par-ticles.Including the dimer-dimer interaction in second-order perturbation theory the resulting GS energy per site is e≈−1.0625t AB(e DMRG=−1.0808t AB).The energy difference between the two lowest singlet states (with¯K=0and¯K=π)decays nearly exponentially with L,indicating a breaking of the translational sym-metry in the thermodynamic limit.b) γ=(π,π),∆c=0,∆s=0.The system forms a Luther-Emery liquid withχs andχc CF decaying as1/d (neglecting logarithmic corrections.)d) γ=(0,π),∆c=0,∆s=0.metry arguments,for U =0,all CF except χt =χbsdw show the same 1/d 2decay (apparently without logarith-mic corrections).Renormalization group arguments [22]show that when ∆s =0,χt should decay more slowly than χs ,and therefore dominate for small |U |.As U in-creases,χt decays more rapidly,while the opposite hap-pens with χsz .Near the opening of ∆c (at U c ≈2.05for tdistance d as a function of d for t AB =0.6:nearest-neighbor triplet |χt (d )|=|χbsdw (d )|(squares)and singlet χs (d )(cir-cles)pair CF,on-site pair and charge CF |χos (d )|=|χc (d )|(downward triangles),and spin CF χsz (d )(upward triangles).See Eq.(4).In conclusion,we have constructed the quantum phase diagram of Eq.(1)from topological considerations.Each thermodynamic phase is associated to a topological vec-tor,and changes in that quantity signal the transition point.A key finding is the identification of a triplet superconducting phase degenerate with a bond-located SDW for t AB <1and small |U |.Taking into account the slight dimerization in (TMTSF)2X compounds,an effective Hamiltonian similar to Eq.(1)can be real-ized,where only four low-energy states per unit cell are kept.Assuming that additional interactions stabilize the TS with respect to the BSDW it is remarkable that,forU >0,as t AB is decreased a similar sequence of quantum phase transitions takes place as pressure is applied [14].This general approach can be extended to spatial dimen-sions higher than one [8],and applied to more general models which do not necessarily have SU(2)pseudospin symmetry [9].One of us (A.A.A.)thanks J.Voit and L.Arrachea for discussions.We acknowledge computer time at Max-Planck Institute f¨u r Physik Komplexer Systeme.K.H.and C.D.B.are supported by CONICET,while G.O.is supported by the US Depart-of Energy.。