Differentical Resistivity Geophysics 1996 Jan-Feb
航空瞬变电磁全时域全空域快速成像
第45卷 第4期2023年7月物探化探计算技术COMPUTINGTECHNIQUESFORGEOPHYSICALANDGEOCHEMICALEXPLORATIONVol.45 No.4Jul.2023收稿日期:2022 04 19基金项目:陕西省教育厅科学研究计划项目(22JK0526)第一作者:郑建波(1990-),女,硕士,讲师,主要从事电磁勘探方法研究,E mail:zhengjianbobo1990@163.com。
文章编号:1001 1749(2023)04 0478 06航空瞬变电磁全时域全空域快速成像郑建波,李美艳(西安外事学院工学院,西安 710077)摘 要:航空瞬变电磁法以其快速高效的优势已获得广泛应用,然而航空瞬变电磁采样密集,数据量巨大。
为了实现航空瞬变电磁观测数据的快速解释,开展航空瞬变电磁快速成像算法研究。
利用反函数定理建立成像迭代格式,并在成像过程中考虑发射源高度和观测时间的影响,进而实现航空瞬变电磁全时域全空域快速成像。
这里首先给出了全时域全空域成像理论和实现方法,然后对航空瞬变电磁装置进行了介绍,最后建立了典型采空区模型,利用开发的航空瞬变电磁全时域全空域视电阻率成像方法进行数据成像,成像结果与真实模型基本一致,验证了方法的有效性。
关键词:航空瞬变电磁;全时域;全空域;成像中图分类号:P631.3 文献标志码:A 犇犗犐:10.3969/j.issn.1001 1749.2023.04.080 引言航空瞬变电磁法将电磁探测装置搭载在飞机上,通过发射线圈进行大功率发射,激发地下感应涡流,通过观测断电间歇感应涡流产生的二次磁场的空间和时间分布特征,对地下目标进行快速电磁探测。
由于该方法具有快速、高效、受地形影响小等特点,已被广泛应用于矿产勘查、环境地质调查等诸多领域[1-5]。
由于航空瞬变电磁法在探测过程中进行连续采样,获得海量观测数据,因此具有较高的分辨率。
然而,海量数据量也给航空瞬变电磁数据解释带来了巨大困难。
26422071_江南造山带深部边界及成矿制约:来自综合地球物理的认识
1000 0569/2022/038(02) 0544 58ActaPetrologicaSinica 岩石学报doi:10 18654/1000 0569/2022 02 16江南造山带深部边界及成矿制约:来自综合地球物理的认识严加永1,2,3 吕庆田1,2 张永谦1,2 刘卫强4 王栩1,2 陈昌昕1,2 徐 1,2 刘家豪1,2YANJiaYong1,2,3,L QingTian1,2,ZHANGYongQian1,2,LIUWeiQiang4,WANGXu1,2,CHENChangXin1,2,XUYao1,2andLIUJiaHao1,21 中国地质科学院,北京 1000372 中国地质调查局中国地质科学院地球深部探测中心,北京 1000373 东华理工大学地球物理与测控学院,南昌 3300134 中国石油大学(北京)地球物理学院,北京 1022491 ChineseAcademyofGeologicalSciences,Beijing100037,China2 ChinaDeepExplorationCenter,ChinaGeologicalSurvey&ChineseAcademyofGeologicalSciences,Beijing100037,China3 SchoolofGeophysicsandMeasurement controlTechnology,EastChinaUniversityofTechnology,Nanchang330013,China4 CollegeofGeophysics,ChinaUniversityofPetroleumBeijing,Beijing102249,China2021 08 28收稿,2021 11 25改回YanJY,LüQT,ZhangYQ,LiuWQ,WangX,ChenCX,XuYandLiuJH 2022 ThedeepboundariesofJiangnanorogenicbeltanditsconstraintsonmetallogenic:Fromtheunderstandingofintegratedgeophysics ActaPetrologicaSinica,38(2):544-558,doi:10 18654/1000 0569/2022 02 16Abstract TheJiangnanorogenicbelt,locatedbetweentheYangtzeandCathaysianblocks,isakeywindowtounderstandtheevolutionanddynamicprocessoftheSouthChinaBlock,andtorevealthelarge scalemagmatismandtheaccompaniedmetalmineralresourcesinthisarea Predecessorshavemadealotofprogressinitstectonics,petrologyandoredepositscience,buttherearelong termdisputesinitsdefinition,boundaries,formationageandevolutionprocess Thefundamentalreasonisthatthedeepstructureisunclear,therefore,itisurgenttocarryoutdeepexplorationtoprovidesupportfordisputeresolution ThispaperfocusesonthedeepboundariesofJiangnanorogenicbelt,anddetectsthedensityandmagnetismboundariesandinversesthedeepelectricalstructuremainlybyusinggravityandaeromagneticdatatogetherwithsupplementedmagnetotelluricdata Combinedwiththeclusteranalysisresultsof75elementstreamsedimentgeochemicaldata,itisconsideredthattheQinhangjunctionbeltisthesoutheastboundaryoftheJiangnanorogenicbelt,andthepossibledeepboundaryinthenorthoftheJiangnanorogenicbeltisfurtherinferredanddetermined Onthisbasis,thefaultstructuresaroundtheJiangnanorogenicbeltareidentifiedandre determined,andthecontrolofregionalstructuresongoldandcopperdepositsisanalyzed ItisconsideredthatthedeepboundariesanddeepfaultsoftheJiangnanorogenicbeltplaytheroleof“oreguidepath”inthemetallogenicsystem,andprovidemineralswhichdominatedbymantlederivedcomponentssuchascopperandgoldfromthebeginningoftheformationofdeepfaults Themineralizationisinplaceattheappropriateposition,andthecomplextectonicmovementinthelaterstagereactivatesthelocalposition,enrichesandmigratestheore formingmaterialsagain,andformscoppergolddepositsofdifferentagesanddifferenttypesinfavorablepositionssuchassecondaryfaults Therefore,thefaulttectonicidentifiedframeworkinthispapercanalsoprovideanindicationfortheexplorationformantlecorrelatedmetaldepositsKeywords Jiangnanorogenicbelt;Gravityandmagneticdata;Integratedgeophysics;Resistivityinvertedfrommagnetotelluricdata;Geochemicalclusteranalysis;Pathwayofmineralsystem摘 要 江南造山带位于组成华南大陆的扬子地块和华夏地块之间,是揭示华南陆块演化及其动力学过程、探索该地区大规模岩浆多金属成矿作用的关键窗口。
采用电法CT技术探查树木内部结构
采用电法CT技术探查树木内部结构于仲;张平松;付茂如;程刚【摘要】为探讨直流电法应用于树木内部结构探测的成像效果,通过直流电法层析成像技术对不同种类的树木进行了检测实验研究.运用并行电法进行数据采集,利用弧度修正系数对电性参数进行了修正,获得了较为理想的树干电阻率剖面.三种树木电性剖面对比发现,不同材质的树木电阻率值差异明显,且树干断面电阻率分布整体表现为里高外低的特征.电阻率分布特性可为树木健康状况诊断提供相关技术参数.%With direct current CT technology, the detection experiment among different tree species has been carried out for the sake of studying the imaging results of inner structure of tree trunks. Ideal resistivity distribution profiles have been obtained by the process of data collecting with the Network Parallel Galvanic Exploration System initially and curvature correction for modifying electrical parameters then. By contrast, the conclusion can be drawn that there' s a large variation range among three kind of trees in resistivity. Besides, the internal electrical distribution of tree trunk is that resistivity of the trunk profile is higher inside, and lower outside respectively. Related technical parameters can be provided by resistivity distribution characteristics for diagnosing health symptoms of trees.【期刊名称】《安徽理工大学学报(自然科学版)》【年(卷),期】2012(032)002【总页数】4页(P59-62)【关键词】直流电CT检测技术;电阻率反演;圆柱体结构;弧度修正【作者】于仲;张平松;付茂如;程刚【作者单位】安徽理工大学地球与环境学院,安徽淮南232001;安徽理工大学地球与环境学院,安徽淮南232001;安徽理工大学地球与环境学院,安徽淮南232001;安徽理工大学地球与环境学院,安徽淮南232001【正文语种】中文【中图分类】S758.1近年来,采用物探方法进行林木健康状况检测是一个新的应用方向,其中应力波法[1]、超声波法[2-5]、X 射线法[3,5]及振动检测[6]等方法多被应用,并取得了较好的测试效果。
地球物理学
地球物理学用物理学的原理和方法,对地球的各种物理场分布及其变化进行观测,探索地球本体及近地空间的介质结构、物质组成、形成和演化,研究与其相关的各种自然现象及其变化规律。在此基础上为探测地球内部结构与构造、寻找能源、资源和环境监测提供理论、方法和技术,为灾害预报提供重要依据。已故著名地球物理学家赵九章先生是这样形容地球物理学的——“上穷碧落下黄泉、两处茫茫都不见”。
编辑本段分类
整体而言,地球物理学是利用物理方法研究地球或其他行星的科学,主要研究地球的各种物理性质,包括地球内部及表面的组成及各种自然作用与变化规律。其领域又可区分以下的类别:
地震学(Seismology):
研究地震、地震波及其在地球的内部传播等与地震有关的科学。地震学是用来研究地球内部结构的一门重要科学。
地震学
重力学(Gravity):
研究关于地球重力的科学,研究范围包括地球上的重力现象、重力分布、重力场及其他相关性质的研究。
地磁学(Geomagnetism):
研究地球和大气圈之磁性的科学,主要研究有磁性的现象、来源、磁场等方面。
地电学(Geoelectricity):
研究地球电场的科学,藉以推导地球内部介质的物性、组成和分布状态。
地球物理学
科技名词定义
中文名称:
地球物理学
英文名称:
geophysics
定义:
研究地球大气圈、水圈及固体部分物理性质和变化过程的科学。
应用学科:
大气科学(一级学科);应用气象学(二级学科)
本内容由全国科学技术名词审定委员会审定公布
求助编辑百科名片
地球物理学(geophysics)是地球科学的主要学科,用物理学的方法和原理研究地球的形成和动力,研究范围包括地球的水圈和大气层。地球物理学研究广泛系列的地质现象,包括地球内部的温度分布;地磁场的起源、架构和变化;大陆地壳大尺度的特征,诸如断裂、大陆缝合线和大洋中脊。现代地球物理学研究延伸到地球大气层外部的现象(例如,电离层电机效应〔ionospheric dynamo〕、极光放电〔auroral electrojets〕和磁层顶电流系统〔magnetopause current system〕),甚至延伸到其他行星及其卫星的物理性质。
高密度电法数据处理结合钻孔波速测试在土洞发育区的应用实例
第43卷第1期物探化探计算技术Vol.43No.1 2021年1月COMPUTING TECHNIQUES FOR GEOPHYSIC A L AND GEOCHEMIC A L EXPLORATION Jan.2021文章编号:1001-1749(2021)01-0104-04高密度电法数据处理结合钻孔波速测试在土洞发育区的应用实例易强,李望明,景营利,帅焕,卞兆津(湖南省地质矿产勘查开发局四一六队,株洲412003)摘要:土洞是发育在可溶岩上覆土层中的空洞,尤其是对于灰岩等可溶岩地区,分布较为广泛,易引发地面塌陷,影响工程施工,是工程建筑设施的重要隐患。
通过对高密度电法数据进行处理并抽取电测深曲线及结合钻孔波速测试,对土洞发育深度进行定量分析,能有效地对土洞进行勘查,取得了较好的效果。
关键词:高密度电法;电测深曲线;波速测试;土洞;地面塌陷中图分类号:P631.3文献标志码:A DOI:10.3969/j.issn.1001-1749.2021.01.140引言湖南省醴陵市某陶瓷有限公司棚户区建设改造项目,地形平坦,场地较为开阔,在项目勘查过程中,发现有土洞存在,易引发地面塌陷[1],影响工程施工。
为了进一步查明土洞的发育程度和分布范围,进行了工程地球物理勘探[—3]。
这里即是综合利用高密度电法数据处理并抽取电测深曲线4及结合钻孔波速测试[5],对土洞发育深度进行定量分析的一应用工程实例。
1高密度电法数据中抽取电测深曲线利用高密度电法数据进行分析,从高密度电法数据中通过专业制图软件surfer中自带的切片功能,抽取电测深曲线:首先建立一个“.bln”格式的切片文件,切片文件内容为两列,第一列为测深点号,第二列为测深点的AB/2,并从小到大按序排列;其次将高密度数据网格化,将刚形成的切片文件输入,并输出.dat文件,抽取的测深数据即在输出的.dat 文件中;最后将输出的.dat文件用Grapher软件绘制电测深曲线。
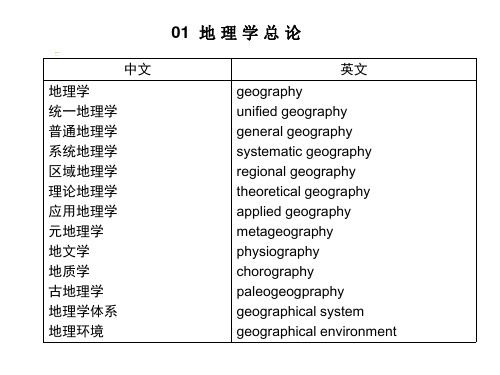
地理英语词汇
中文
地理因子 地理过程 地理分布 地理界线 地理综合 地理考察 综合考察 区域分析 区域分异 生存空间 生存承载能力 环境决定论 灾变论 地球 地球表面
英文
geographical factors geographical process geographical distribution geographical boundary geographical synthesis geographical survey integrated survey regional analysis regional differentiation living space life-carrying capacity environmental determinism catastrophe theory earth earth surface
中文
山 山脉 岭 峰 山麓 半岛 岛屿 群岛 海峡 地峡 海拔(高度) 相对高度 山嘴 盆地 山间盆地
英文
mountain mountain range, mountain chain range, ridge peak, mount piedmont peninsula island archipelago strait isthmus altitude, height above sea level relative height mountain spur basin intermountain basin
地球表层 地理系统 地理圈 景观圈 岩石圈 水圈 大气圈 土壤圈 生物圈 地圈 智能圈 技术圈 北半球 南半球 地球体
中文
英文
epigeosphere geosystem geographical sphere landscape sphere lithosphere hydrosphere atmosphere pedosphere biosphere geosphere noonsphere technosphere northern hemisphere southern hemisphere geoid
松辽盆地基底石英脉中无机成因气的地球化学特征及指示意义

天 然 气 工 业Natural Gas INdustry第40卷第10期2020年 10月· 29 ·松辽盆地基底石英脉中无机成因气的地球化学特征及指示意义孟凡超1 崔 岩2 张曰静3 王 林3 杜 青1 刘浩毅1 左耿超1 田雨露11.中国石油大学(华东)地球科学与技术学院2.山东科技大学地球科学与工程学院3.中国石化胜利油田分公司勘探开发研究院摘要:松辽盆地深层存在着地球内部来源的无机成因气体,但一直缺少直接的地质证据,而分析该盆地基底岩石则有望成为解决这一问题的突破口。
为此,通过基底岩心样品采集、石英脉体分离、包裹体岩相学、流体地球化学分析等技术手段,研究该盆地基底岩石中的石英脉体及脉体中流体包裹体的岩相学特征、碳氢氧同位素特征,探讨石英脉及其包裹体内流体的成因,寻找深部气体向浅部运移的流体记录,并分析基底石英脉包裹体内流体的指示意义。
研究结果表明:①石英脉体的氧同位素值介于8.1‰~9.5‰,为岩浆期后热液结晶形成;②石英脉中存在H 2O 、H 2O —CO 2和H 2O —CO 2—CH 4共3种原生流体包裹体,完全均一温度介于320~360 ℃,成分以CO 2、H 2O 为主,含有少量CH 4、C 2H 6、N 2、O 2、Ar ;③脉体中流体包裹体内水的δ18O 介于2.0‰~3.8‰,δD 介于-91.6‰~-75.7‰,表现为岩浆脱气后残余水特征;④CO 2的δ13C 变化范围较大(介于-13.8‰~-9.7‰),其中烷烃的δ13C 1介于 -30.6‰~-24.1‰,δ13C 2介于-33.2‰~-25.7‰,且δ13C 1>δ13C 2,呈负碳同位素系列,CO 2和烷烃均显示无机成因气特征。
结论认为:①石英脉内烷烃的δ13C 1和δ13C 2与该盆地深层碳同位素完全倒转的烷烃气特征一致,两者可能具有一定的亲缘性;②松辽盆地基底之下岩浆活动产生的热液流体在盆地基底缝隙中结晶形成石英脉体,并且捕获热液流体中的无机成因气,其余无机成因气则沿深大断裂向上运移至盆地内部,为深层天然气藏的形成做出了贡献。
一类特殊粗糙核算子有界性
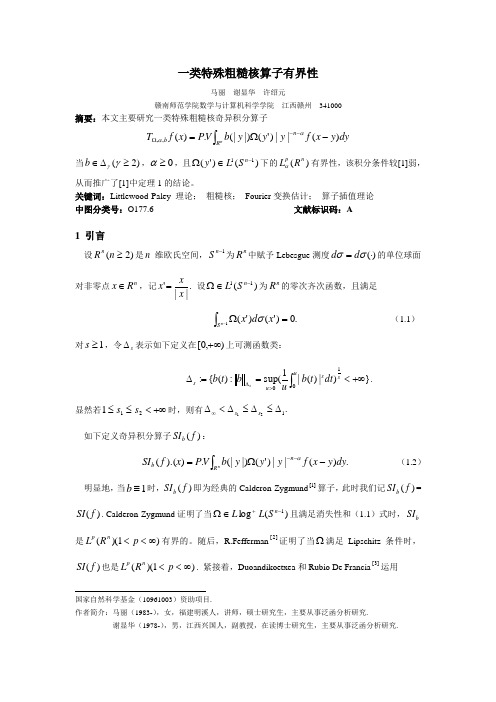
一类特殊粗糙核算子有界性马丽 谢显华 许绍元赣南师范学院数学与计算机科学学院 江西赣州 341000摘要:本文主要研究一类特殊粗糙核奇异积分算子dy y x f y y y b V P x f T n Rn b )(||)'(|)(|.)(,,-Ω=⎰--Ωαα当)2(≥∆∈γγb ,0≥α,且)()'(11-∈Ωn S L y 下的)(n pR L α有界性,该积分条件较[1]弱,从而推广了[1]中定理1的结论。
关键词:Littlewood-Paley 理论; 粗糙核; Fourier 变换估计; 算子插值理论 中图分类号:O177.6 文献标识码:A1 引言设)2(≥n R n 是n -维欧氏空间,1-n S 为nR 中赋予Lebesgue 测度)(⋅=σσd d 的单位球面对非零点nR x ∈,记.||'x xx =设)(11-∈Ωn S L 为n R 的零次齐次函数,且满足⎰-=Ω1.0)'()'(n S x d x σ (1.1)对1≥s ,令s ∆表示如下定义在),0[+∞上可测函数类:})|)(|1(sup :)({:10+∞<==∆⎰>∆s us u s dt t b u bt b s. 显然若+∞<≤≤211s s 时,则有.121∆≤∆≤∆<∆∞s s 如下定义奇异积分算子)(f SI b : .)(||)'(|)(|.)).((dy y x f y y y b VP x f SI nRn b -Ω=⎰--α (1.2)明显地,当1≡b 时,)(f SI b 即为经典的Calderon-Zygmund ]1[算子,此时我们记)(f SI b =)(f SI . Calderon-Zygmund 证明了当)(log 1-+∈Ωn S L L 且满足消失性和(1.1)式时,bSI 是)1)((∞<<p R L np有界的。
- 1、下载文档前请自行甄别文档内容的完整性,平台不提供额外的编辑、内容补充、找答案等附加服务。
- 2、"仅部分预览"的文档,不可在线预览部分如存在完整性等问题,可反馈申请退款(可完整预览的文档不适用该条件!)。
- 3、如文档侵犯您的权益,请联系客服反馈,我们会尽快为您处理(人工客服工作时间:9:00-18:30)。
GEOPHYSICS,VOL.61,NO.1(JANUARY-FEBRUARY1996);P.100–109,9FIGS.,2TABLES.The differential parameter method for multifrequency airborne resistivity mappingHaoping Huang*and Douglas C.Fraser*ABSTRACTHelicopter EM resistivity mapping began to be ac-cepted as a means of geologic mapping in the late1970s. The data werefirst displayed as plan maps and images. Some10years later,sectional resistivity displays became available using the same‘‘pseudolayer’’half-space resis-tivity algorithm developed by Fraser and the new cen-troid depth algorithm developed by Sengpiel.Known as Sengpiel resistivity sections,these resistivity/depth images proved to be popular for the display of helicopter electro-magnetic(EM)data in conductive environments.A limitation of the above resistivity and depth algo-rithms is that the resulting Sengpiel section may imply that the depth of exploration of the EM system is substantially less than is actually the case.For example, a target at depth may be expressed in the raw data,but its appearance on the Sengpiel section may be too shallow(which is a problem with the depth algorithm), or it may not even appear at all(which is a problem with the resistivity algorithm).An algorithm has been adapted from a ground EM analytic method that yields a parameter called the differential resistivity,which is plotted at the differential depth.The technique yields the true resistivity when the half-space is homogeneous.It also tracks a dipping target with greater sensitivity and to greater depth than does the Sengpiel display method.The input parameters are the apparent resistivity and apparent depth from the pseudolayer half-space algorithm and the skin depth for the various frequencies.The output parameters are differential resistivity and differential depth,which are computed from pairs of adjacent frequencies.INTRODUCTIONAirborne electromagnetic(EM)methods are being used increasingly as tools for geological mapping,groundwater exploration,and environmental mapping.In such helicopter-borne applications,interpretation is commonly based on the mapping of apparent resistivity following the technique devel-oped by Fraser(1978)using half-space models.The method was extended from a plan map display to a sectional display by Sengpiel(1988),who plotted the apparent resistivitya for each frequency at the so-called centroid depth z*.More sophisticated methods,such as least-squares inversion to a layered earth based on singular value decomposition(Paterson and Reford,1986),work well for noise-free data.However, these methods are seriously affected by leveling errors in the data,resulting in an unstable inversion(Palacky et al.,1992). They also are computationally intensive relative to half-space resistivity calculations.As a result,the popular and stable methods used in helicopter EM resistivity interpretation are still based on the classical concept of the apparent resistivity of a half-space.Recent improvements in data quality,and an increase in the number of frequencies in airborne EM systems, encourage the search for new analytic methods for interpreta-tion and data display.A novel approach for the interpretation and display of multifrequency helicopter EM data is presented,which is based on the concepts of the apparent(half-space)resistivity and the effective depth.Of thefive half-space models defined in Fraser(1978),we shall employ the pseudolayer half-space model that uses the inphase and quadrature signals,as cali-brated in parts per million(ppm)of the primaryfield strength, to yield the apparent resistivity and apparent depth.The method described below uses this apparent resistivity and apparent depth as input parameters.It follows a technique developed for the analysis of MT and dipole EM ground data. It is similar in concept to that described by Macnae et al. (1991)for conductivity-depth imaging of airborne time-domain EM data.This new display method for airborne frequencyPresented at the Airborne Electromagnetics Workshop,Tucson,AZ,September13–14,1993.Manuscript received by the Editor June10,1994; revised manuscript received May15,1995.*Dighem,a division of CGG Canada Ltd.,228Matheson Blvd.E,Mississauga,Ontario L4Z1X1,Canada.᭧1996Society of Exploration Geophysicists.All rights reserved.100domain EM data is simple and yields a smoothed approximation of the true resistivity distribution with depth.We are concerned here with the calculation of a resistivity parameter and the depth at which that parameter should be plotted.RESISTIVITY AND DEPTH PARAMETERSThe depth parameterWe begin the calculation of the depth parameter by defining the effective depth z as a function of the skin depth␦and apparent depth da,zϭf͑␦,da͒,(1) where␦ϭ(/0f)1/2is the skin depth,da is the apparent depth to the top of the conductive half-space as obtained from the pseudolayer half-space algorithm of Fraser(1978),f is the frequency,0is the magnetic permeability of free space,andis the resistivity of the ground.If the apparent resistivitya is substituted for the resistivity,then the skin depth might more appropriately be referred to as the apparent skin depth,but this terminology is not used here.In the case of an earth whose resistivity varies with depth, the apparent resistivitya from the half-space model repre-sents a nonlinear averaging of the resistivities of all material above the effective depth and,indeed,some material below the effective depth.In general,however,the apparent resistivityai for a single frequency f i can be represented approximately as(Bostick,1977),ai Ϸz iͲ͵z i1/͑z͒dz,(2)where(z)is the resistivity of the ground as a function ofdepth,which is unknown in practice,and z i is the effectivedepth determined from the i th frequency,as is indicatedschematically in Figure1.In practice,the apparent resistivitya is obtained from the pseudolayer half-space algorithm inFraser(1978).The difference between two effective depths,determined attwo adjacent frequencies f i and f iϩ1,gives the thickness⌬z fora hypothetical layer,i.e.,⌬zϭz iϩ1Ϫz iϭf͑␦iϩ1,da iϩ1͒Ϫf͑␦i,da i͒,(3)where the frequencies are in decreasing order,i.e.,f iϩ1Ͻf i.The depth to the midpoint of each hypothetical layer is calledherein the differential depth and is given by Figure1asz⌬ϭz iϩ⌬z/2ϭ͑z iϩ1ϩz i͒/2.(4)The differential depth z⌬increases as the frequency decreases.This is the depth at which we plot the associated resistivity.The effective depth of equation(1)was developed empiri-cally and is displayed graphically in Figure2.The goal of ourdevelopment of the effective depth was to yield inputs toequations(3),(4),and(7)such that a resistivity/depth sectionwould approximate the true resistivity distribution.With sucha goal,various investigators could arrive at different relation-ships using a variety of input parameters,e.g.,skin depth,apparent depth,or centroid depth.We have chosen theeffective depth to be a function of the skin depth and theapparent depth.The apparent depth has some peculiar prop-erties as described in Fraser(1978).For example,for atwo-layer earth with a conductive upper layer,it is negative.Figure2provides a graphic presentation of the effective depthas a function of the skin depth(as calculated from the apparentresistivity)and the apparent depth.Since the effective depthisan empirical development,Figure2should be viewed as the Array current manifestation of this parameter which,in the future, may be altered to yield an improved resistivity/depth section.The resistivity parameterThe apparent conductance Sa for a single frequency f i refers to the ratio of the effective depth to the apparent resistivity, i.e.,it is the sum of the conductances of the strata down to the effective depth.It can be written asϷ͵0z i1/͑z͒dz.(5)Sa iϭz i/aiThe difference between two apparent conductances,at two adjacent frequencies,gives the conductance for the hypothet-ical layer,i.e.,⌬SϭSa iϩ1ϪSa i.(6) The differential resistivity may be approximated from the above parameters as,⌬ϭ⌬z/⌬S.(7) Thus,if the apparent resistivities are known for a number of frequencies,equations(4)and(7)may be used to calculate a pair of resistivity and depth parameters⌬,z⌬for each pair of adjacent frequencies.The procedure is summarized in Figure 3.By interpolation,the resistivity at intermediate depths can be obtained to yield a useful approximation of the true resistivity distribution.The resolution of the mapping ofthe resistivity in practice depends on the frequency bandandon the density of frequencies employed.The denser the frequencies and the wider the band,the higher the resolution.MODEL TESTINGThe approximate inversion technique described above is demonstrated below on some models of a layered earth,using 10geometrically spaced frequencies in the range of220Hz to 115000Hz.These frequencies are transmitted by the coplanar coils of a helicopter EM system with an8-m transmitter-receiver coil separation.The forward solutions to a layered earth are computed using a fast Hankel algorithm.These responses are inverted into the apparent resistivity of the equivalent half-space using the pseudolayer algorithm(Fraser, 1978)and the differential parameter method described above. All results are compared to the centroid depth approach developed in Sengpiel(1988).Conductive coverFigure4shows the results obtained for twoflying heights over a two-layer earth representing the common situation of conductive overburden overlying a resistive basement.Curveis the true resistivity model,curve⌬is the differential resistivity versus the differential depth z⌬,and curvea is the apparent resistivity versus the centroid depth z*.Both the differential resistivity and the apparent resistivity increase with depth,indicating qualitatively that the lower layer is more resistive.Both of these resistivity parameters define the true resistivity of the upper layer,but not the true resistivity of the basement,for this particular case.The two main differences are,(1)the differential resistivity(solid circles)at the lowest frequency(greatest depth)is closer to the true resistivity of the model than is the apparent resistivity(open circles),and(2) the differential depth(solid circles)plots deeper into the basement than does the centroid depth(open circles).There is some dependency onflying height for both methods,although it is not serious in practice.Resistive coverFigure5shows the results for a model having a moderately resistive layer overlying a conductive basement.In this case,1 is well defined by both the Sengpiel and differential methods at the higher frequencies.When the differential depth approaches the layer interface for the lower frequencies,thedifferentialresistivity drops quickly to the correct2value with only a negligible undershoot.The apparent resistivity,on the other hand,does not reach2.The amount of the undershoot increases as the resistivity contrast between the two layers increases. Four-layer modelThe results for four-layer models are shown in Figures6and 7.The model for Figure6a depicts a four-layer earth with resistivities of50–1000–1-1000ohm-m reflecting overburden on a resistive host containing a conductive target.The model for Figure6b is the same as for Figure6a,except for an increase in the thickness of the second layer.The curves for both the differential⌬(z⌬)and the Sengpiela(z*)methods indicate qualitatively that a four-layer earth exists.The differ-ential curve⌬(z⌬)rapidly follows the sharp changes in the resistivity at the layer interfaces,with the minimum value occurring close to the true depth of the thin conducting layer in Figures6a and6b.The differential resistivities in Figure6 are closer to the true resistivities than are the apparent resistivities of the Sengpiel method.Figure6as described above was computed using10geometri-cally spaced frequencies in the range of220Hz to115000Hz.The results for the same models,but using thefive frequencies of a DIGHEM V system(137500,27500,5500,1100,220Hz),are shown in Figure7.The results are similar to Figure6but the resolution is poorer because of the sparser frequency sampling. Dipping thin conductorFigure8shows a2-D model(upper panel)that is simulated by a series of multilayer1-D models.There is an air layer shown in black that varies in thickness from about10m on the left to0m on the right.This air layer could represent a dense tree canopy where the altimeter defines the tree tops.There is patchy conductive overburden of50ohm-m,and a dipping conductive thin layer(5m thick)of1ohm-m whose depth increases from about20m on the left to200m on the right. The host rock is1000ohm-m.The resistivity and depth values were calculated for the ten frequencies used in the earlier models and for aflying height of30m.The output color sections for the Sengpiel and differential methods are shown in the middle and lower panels,respectively,of Figure8.It can be seen that the differential resistivity image reasonably approxi-mates the true model shown in the upper panel,although these differential resistivities may be quite different from thetrueresistivities.The moderately conductive upper layer is indi-cated on the differential section with a value that is close to the correct resistivity.The resistive second layer is reasonably defined,although its resistivity is understated.The conducting thin layer is well rendered although its resistivity is overstated.This dipping layer is visible on the differential section to a depth of 200m for this noise-free data.The differential resistivity increases below the dipping layer,indicating that there is a resistive basement.The center panel of Figure 8presents an imaged Sengpiel section using the same color bar as for the differential image of the lower panel.The layering of the model is indicated roughly in this image,giving a preliminary idea about the resistivity distribution.However,the image is not as definitive as that from the differential method of the lower panel.In particular,the appearance of the thin conducting layer is poorly rendered.The above description of Figure 8needs to be viewed qualitatively because the input data were generated from a series of horizontal multilayer 1-D models.Such models cannot accurately render the effect of the dip of the thin conductor or the lateral changes in resistivity caused by the patchy conductiveoverburden.F IG .8.Resistivity/depth section for a 2-D model (upper panel)simulated by a number of 1-D models.The center and lower panels are,respectively,the Sengpiel and differentialsections.F IG .9.Resistivity/depth section from three-frequency data obtained over the Cove gold deposit in Nevada.The upper and lower panels are,respectively,the Sengpiel and differential sections.107Airborne ResistivityFor a flying height of 30m,and if minimal conductive overburden exists,Figure 8suggests that it is possible to detect a conductive layer to a depth of 200m when using the differential resistivity/depth method of sectional display.Tables 1and 2present the EM amplitudes in support of this statement.A frequency of 900Hz is common to all DIGHEM systems,and some DIGHEM V systems employ 220or 385Hz as the lowest frequency.With noise levels of 1to 2ppm,it can be seen from the amplitudes of Table 2versus Table 1that a target layer is barely discernible at a depth of 200m.Thus,200m could be referred to as the depth of exploration for this case when using the differential resistivity method.FIELD EXAMPLEThe results of the differential and Sengpiel inversions of data from the Cove gold deposit in Nevada are shown in Figure 9.The Cove is a Carlin-type epithermal deposit that is located in the Augusta Mountain limestone formation south of Battle Mountain,Nevada.The gold and associated silver mineralization of the upper oxidized zone are associated with argillization (Emmons and Coyle,1988),which yields a resistivity low.The DIGHEM III system was used in the Cove survey,operating at frequencies of 56000,7200,and 900Hz.The resistivity data were interpolated but not extrapolated to the surface or to a common depth.The Cove gold deposit is shown as the steeply dipping red zone at the center of the sections.The red target zone and the more resistive rocks to its right are better defined on the differential resistivity section.CONCLUSIONS A technique has been developed for the approximate inver-sion of multifrequency helicopter EM measurements.The method is based on an apparent resistivity algorithm and the skin depth equation.The resistivity and depth are calculated directly,with the method tending to yield a smoothed approx-imation of the true resistivity distribution with depth.The algorithm is very efficient since the method does not employ an initial model,table matching,and iterative computations.Since the input values to the algorithm are the apparent resistivities,rather than the responses for a certain coil con-figuration,the apparent resistivities from a number of frequen-cies on both coplanar and coaxial coils can be used together.Mixing coaxial and coplanar coil orientations is permitted because the solution for the apparent resistivity is the same,provided both coil orientations have the same frequency and the superposed dipole assumption prevails (Fraser,1979).The inversion improves with the number of frequencies because the function ⌬(z ⌬)tends to be continuous.The output from this method could be used as an initial model for more sophisti-cated layered-earth inversions.Table 1.Conductive cover (10m of 50ohm-m)overlies a resistive basement (1000ohm-m).There is no conductive layer within the basement.Frequency (Hz)ppmsSengpiel method Differential method Inphase Quad Apparent res.(ohm-m)Centroid depth (m)Diff.res.(ohm-m)Diff.depth (m)1152001270.6641.064564657600884.9711.58781691328800495.1627.4119152402014400224.6447.31602532033720086.3273.52113540454360029.6152.1267454708718009.580.232456511139900 3.041.3393666292174500.920.9461836763362250.310.553198749512Table 2.Conductive cover (10m of 50ohm-m)overlies a resistive basement (1000ohm-m).A horizontal conductive layer (5m of 1ohm-m)occurs with its top at a depth of 200m.Frequency (Hz)ppmsSengpiel method Differential method Inphase Quad Apparent res.(ohm-m)Centroid depth (m)Diff.res.(ohm-m)Diff.depth (m)1152001270.6641.064564657600884.9711.58781691328800495.1627.5119152402014400224.6447.51612532533720085.5272.32133541654360030.2149.52614542087180012.278.025852255130900 6.740.61895691172450 4.321.81207338207225 2.512.2849737246Huang and Fraser108The differential inversion technique was tested on synthetic, noise-free data from several models.The results were com-pared to the centroid depth method in Sengpiel(1988),which has become quite popular for the interpretation of helicopter frequency-domain EM data.The differential method yields images that are superior to those of the Sengpiel method.The differential inversion method was also tested on DIGHEM survey data from the Cove gold deposit in Nevada.It yielded a resistivity/depth section in which the gold deposit was well defined.The differential resistivity technique is now being used routinely in the processing of DIGHEM survey data.REFERENCESBostick,Jr.,F.X.,1977,A simple almost exact method of MT analysis, in Ward,S.,Ed.,Workshop on electrical methods in geothermalexploration:Univ.of Utah Res.Inst.,U.S.Geol.Surv.,Contract 14-08-0001-G-359,174–183.Emmons,D.L.,and Coyle,R.D.,1988,Echo Bay details exploration activities at its Cove gold deposit in Nevada:Mining Eng.,40, 791–794.Fraser,D.C.,1978,Resistivity mapping with an airborne multicoil electromagnetic system:Geophysics,43,144–172.———1979,The multicoil II airborne electromagnetic system:Geo-physics,44,1367–1394.Macnae,J.C.,Smith,R.,Polzer,B.D.,Lamontagne,Y.,and Klinkert, P.S.,1991,Conductivity-depth imaging of airborne electromagnetic step-response data:Geophysics,56,102–114.Palacky,G.J.,Holladay,J.S.,and Walker,P.,1992,Inversion of helicopter electromagnetic data along the Kapuskasing transect, Ontario:in Current Research,Part E,Geol.Surv.Canada,Paper 92-1E,177–184.Paterson,N.R.,and Reford,S.W.,1986,Inversion of airborne electromagnetic data for overburden mapping and groundwater exploration:in Airborne resistivity mapping,Palacky,G.J.,Ed., Geol.Surv.Canada,Paper86-22,39–48.Sengpiel,K.P.,1988,Approximate inversion of airborne EM data from a multilayered ground:Geophys.Prosp.,36,446–459.109Airborne Resistivity。
