Apple Defect Detection and Quality Classification with MLP-Neural Networks
目视检验规范IPC

Toe overhang (B) is not specified.
範例 (Example) - 平緞腳 (L型) / 鷗翼腳 / 圓柱L腳 (Flat Ribbon "L" / Gull Wing leads / Round leads)
允收 (Target Condition)
允收極限 (Acceptable)
JUSB 不可 出现气泡和 明显擦痕 .
Travis base sample
Microphone 不能 失掉海绵,禁止使 用双面胶黏贴脱落 海绵。
Travis M/B solder hole
JDOCK 不允許單邊高翹
Travis base sample
固定pin
Function pin
1.Function Pin 吃 锡量不应少于75%.
不允許任何的零件趾端偏移 如(B).
Side overhang (A) is greater than 25%W or 0.5 mm whichever is less.
Toe overhang (B) is not specified
"I" 腳 (“I” Leads) – 偏移 (Shift)
允收 (Target Condition)
拒收 (Nonconforming Defect)
零件腳未偏移. No side overhang.
零件偏移向錫墊寬邊之間(A), 偏移小於電路板上錫墊寬度 (W)的 25% 或偏移小於0.5mm.
Side overhang (A) is 25%W or 0.5 mm.
零件偏移向錫墊寬邊之間(A), 偏移大於電路板上錫墊寬度(W) 的 25%或偏移大於0.5mm.
苹果iPad用户指南说明书

Before using iPad, review the iPad User Guide at /guide/ipad. You can also use Apple Books to download the guide (where available). Retain documentation for future reference.Safety and Handling See “Safety, handling, and support” in the iPad User Guide . Exposure to Radio Frequency On iPad, go to Settings > General > Legal & Regulatory > RF Exposure. Or go to /legal/rfexposure. Battery and Charging Don’t attempt to replace the iPad battery yourself—you may damage the battery, which could cause overheating, fire, and injury. The lithium-ion battery in your iPad should be serviced or recycled by Apple or an authorized service provider, and must be recycled or disposed of separately from household waste. Dispose of batteries according to your local environmental laws and guidelines. For information about Apple lithium-ion batteries and battery service and recycling, go to /batteries/service-and-recycling. For information about charging, see “Important safety information” in the iPad User Guide . Avoid Hearing Damage To prevent possible hearing damage, do not listen at high volume levels for long periods. More information about sound and hearing is available online at /sound and in “Important safety information” in the iPad User Guide . Medical Device Interference iPad contains magnets that may interfere with medical devices. See “Important safety information” in the iPad User Guide .Apple One-Year Limited Warranty Summary Apple warrants the included hardware product and accessories against defects in materials and workmanship for one year from the date of original retail purchase. Apple does not warrant against normal wear and tear, nor damage caused by accident or abuse. To obtain service, call Apple or visit an Apple Store or an Apple Authorized Service Provider—available service options are dependent on the country in which service is requested and may be restricted to the original country of sale. Call charges and international shipping charges may apply, depending on the location. Subject to the full terms and detailed information on obtaining service available at /legal/warranty and , if you submit a valid claim under this warranty, Apple will either repair, replace, or refund your iPad at its own discretion. Warranty benefits are in addition to rights provided under local consumer laws. You may be required to furnish proof of purchase details when making a claim under this warranty. For Australian Consumers: Our goods come with guarantees that cannot be excluded under the Australian Consumer Law. You are entitled to a replacement or refund for a major failure and for compensation for any other reasonably foreseeable loss or damage. You are also entitled to have the goods repaired or replaced if the goods fail to be of acceptable quality and the failure does not amount to a major failure. Apple Pty Ltd, PO Box A2629, Sydney South, NSW 1235. Tel: 133-622. Regulatory Regulatory certification information is available on-device. Go to Settings > General > Legal & Regulatory. Additional regulatory information is in “Safety, handling, and support” in the iPad User Guide . FCC and ISED Canada Compliance This device complies with part 15 of the FCC Rules and ISED Canada licence-exempt RSS standard(s). Operation is subject to the following two conditions: (1) this device may not cause harmful interference, and (2) this device must accept any interference received, including interference that may cause undesired operation. ENERGY STAR® ComplianceiPad meets the ENERGY STAR guidelines for energy efficiency. Reducing energy consumption saves money and helps conserve valuable resources. For more information about ENERGY STAR, go to .To save energy, iPad sleeps after two minutes of user inactivity. To change this setting, go to Settings > Display & Brightness > Auto-Lock. EU / UK Compliance Apple Inc. hereby declares that this wireless device is in compliance with Directive 2014/53/EU and Radio Equipment Regulations 2017. A copy of the Declaration of Conformity is available at /euro/compliance. Apple’s EU representative is Apple Distribution International Ltd., Hollyhill Industrial Estate, Cork, Ireland. Apple’s UK representative is Apple UK Ltd., 2 Furzeground Way, Stockley Park, Middlesex, UB11 1BB. Use Restriction This device is restricted to indoor use when operating in the 5150 to 5350 MHz frequency range. This restriction applies in: AT, BE, BG, CH, CY, CZ, DE, DK, EE, EL, ES, FI, FR, HR, HU, IE, IS, IT, LI, LT, LU, LV, MT, NL, NO, PL, PT,RO, SE, SI, SK, TR, UA, UK(NI).Questo manuale d’istruzione è fornito da trovaprezzi.it. Scopri tutte le offerte per Apple iPad 9 10.2" (2021) 64GB ocerca il tuo prodotto tra lemigliori offerte di TabletQuesto manuale d’istruzione è fornito da trovaprezzi.it. Scopri tutte le offerte per Apple iPad 10 10.9" (2022) 64GBo cerca il tuo prodotto tra le migliori offerte di TabletDisposal and Recycling InformationThe symbol above means that according to local laws and regulations your product and/or its battery shall be disposed of separately from household waste. When this product reaches its end of life, take it to a collection point designated by local authorities. The separate collection and recycling of your product and/or its battery at the time of disposal will help conserve natural resources and ensure that it is recycled in a manner that protects human health and the environment. For information about Apple’s recycling program, recycling collection points, restricted substances, and other environmental initiatives, visit /environment.© 2021 Apple Inc. All rights reserved. Apple, the Apple logo, iPad, and iPad Air are trademarks of Apple Inc., registered in the U.S. and other countries. Apple Books is a trademark of Apple Inc. Apple Store is a service mark of Apple Inc., registered in the U.S. and other countries. ENERGY STAR and the ENERGY STAR mark are registered trademarks owned by the U.S. Environmental Protection Agency. Printed in XXXX. 034-04702-A。
完整苹果公司8D报告
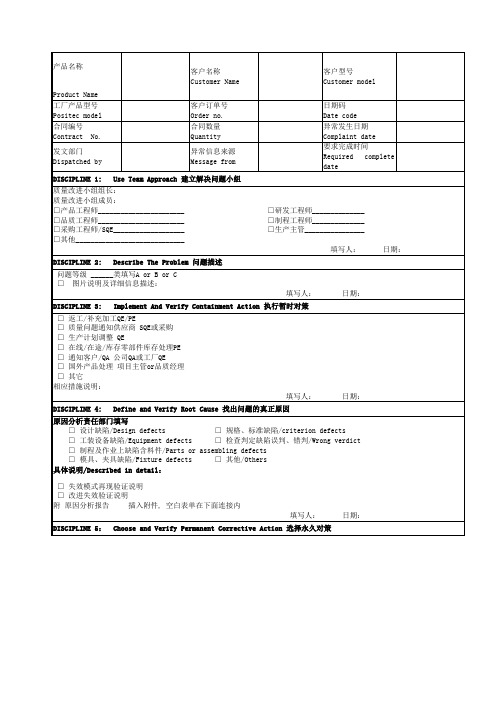
说明:D1-第一步骤: 建立解决问题小组----由品质部召集相关人员若问题无法独立解决,通知你认为有关的人员组成团队;团队的成员必需有能力执行,例如调整机器或懂得改变制程条件,或能指挥作筛选等;备注:执行者不列入;D2-第二步骤: 描述问题----由品质部收集,并向小组人员传达向团队说明何时、何地、发生了什么事、严重程度、目前状态、如何紧急处理、以及展示照片和收集到的证物;想象你是FBI的办案人员,将证物、细节描述越清楚,团队解决问题将越快;D3-第三步骤: 执行暂时对策---由小组人员负责执行若真正原因还未找到,暂时用什么方法可以最快地防止问题如全检、筛选、将自动改为手动、库存清查等;暂时对策决定后,即立刻交由团队成员带回执行;备注:为了防止遗漏,纠正措施五要→客户仓库、在途、客户生产线、工厂生产线 & 工厂仓库;D4-第四步骤: 找出问题真正原因----由小组人员讨论后确定找问题真正原因时,最好不要盲目地动手改变目前的生产状态,先动动脑;您第一件事是要先观察、分析、比较;列出您所知道的所有生产条件即鱼骨图,逐一观察,看看是否有些条件走样,还是最近有些什么异动换了夹具吗换了作业员换了供应商换了运输商修过电源供应器流程改过或比较良品与不良品的检查结果,看看哪个数据有很大的差异尺寸重量电压值CPK耐电压等等不良的发生,总是有原因,资料分析常常可以看出蛛丝马迹;这样的分析,可以帮助您缩小范围,越来越接近问题核心;当分析完成,列出您认为最有可能的几项,再逐一动手作些调整改变,并且观察哪些改变可使品质回复正常及影响变异的程度,进而找到问题真正的原因;这就是着名田口式方法最简单而实际的运用;D5-第五步骤: 选择永久对策----由小组人员讨论后确定找到造成问题的主要原因后,即可开始拟出对策的方法;对策的方法也许有好几种,例如修理或更新模具;试试对可能的选择列出其优缺点,要花多少钱多少人力能持续多久再对可能的方法作一最佳的选择,并且确认这样的对策方法不会产生其它副作用;备注:对策六要→起点改善、模具/工夹具改进、判定标准、辨认标记、隔离处置、产品设计改善;D6-第六步骤: 执行及验证永久对策---由小组人员负责执行并验证当永久对策准备妥当,则可开始执行及停止暂时对策;并且对永久对策作一验证,例如观察不良率已由4000 PPM降为300 PPM,CPK由0.5升为等,下游工段及客户己能完全接受,不再产生问题;D7-第七步骤: 防止再发生措施及标准化----由小组人员负责执行为了防止问题的再发生,要把永久对策落实到设计图纸、工艺文件、检验指导书、模具/工夹具的改进等;另外对类似的产品,虽然尚未发生问题,亦需作同步改善,防止类似问题在其他产品上再次发生;同时这样的失效,也应列入下一产品研发段的FMEA中予以验证,从源头上彻底防止问题的再发;D8-第八步骤: 团队激励----由厂办负责确认并负责申报对于努力解决问题之团队予以嘉勉,使其产生工作上的成就感,并极乐意解决下次碰到的问题;无论是产发段发现的问题,或是量产、客诉问题, 若公司每年有近百项的工程问题依照8D的方式来解决,对工程人员实力的培养着实可观,成为公司重要的资产,这也是很多公司将8D制式化的原因;。
电子产品检验标准

电子产品检验标准电子产品已经成为人们日常生活中不可或缺的一部分,从手机、电脑到家用电器,电子产品的种类繁多。
然而,随着电子产品的普及和使用量的增加,产品质量和安全问题也愈发凸显。
为了保障消费者的权益和安全,制定和执行严格的电子产品检验标准显得尤为重要。
首先,电子产品的外观质量是检验的重要指标之一。
外观质量直接关系到产品的美观度和使用寿命。
在检验时,需要对产品的外观进行全面细致的检查,包括产品表面是否平整、无划痕、无变形、无色差等。
同时,还需检查产品的组装工艺是否精细,各部件之间的连接是否牢固,是否存在漏胶、漏焊等现象。
这些都是影响产品外观质量的重要因素。
其次,电子产品的功能性能是检验的重点之一。
产品的功能性能直接关系到产品的使用效果和用户体验。
在检验时,需要对产品的各项功能进行全面、系统的测试,确保产品的性能指标符合国家标准和产品说明书的要求。
比如,对手机进行通话质量测试、信号接收测试、屏幕显示效果测试等;对电脑进行性能测试、散热测试、键盘、鼠标等外设的使用测试等。
只有通过对功能性能的全面检验,才能确保产品的质量和可靠性。
此外,电子产品的安全性能也是检验的关键之一。
安全性能直接关系到产品的使用安全和用户的人身安全。
在检验时,需要对产品的绝缘性能、防火防爆性能、电磁辐射等安全性能进行全面的测试,确保产品在正常使用和异常情况下都能保持安全可靠。
比如,对家用电器进行漏电保护测试、过载保护测试、电磁辐射测试等;对移动电子产品进行电池安全性能测试、充电器安全性能测试等。
只有通过对安全性能的全面检验,才能有效避免产品在使用过程中出现安全隐患。
综上所述,电子产品检验标准是保障产品质量和用户安全的重要手段。
通过对产品的外观质量、功能性能和安全性能进行全面细致的检验,可以有效提高产品的质量和可靠性,保障消费者的权益和安全。
同时,对电子产品的检验标准也需要不断完善和更新,以适应不断变化的市场需求和技术发展,推动电子产品行业健康可持续发展。
常用的一些测试英语缩写
Full Name
Advanced Audio Distribution Profile Authentication, Authorization, and Accounting Advanced Audio Coding ATM Adaptation Layer type 1 Authentication Algorithm Number Activity-Based Buggeting Activity-Based Costing Activity-Base Management Available Bit Rate Alternating Current Audio Coder-3 Accept Anisotropic Conductive Film Advanced Configuration & Power Interface AT Command Interpreter Acknowledgement SMS Access Control List Add, Compare, Select Agency Dept. Automatic data capture Absolute Dimension Measurement Administration Function at the LIAN Audio Asymmetric Digital Subscriber Line Adaptive Dynamic Threshold Additional Elementary Functions Association for Electric Home Appliances Advance Encryption standard Alternative Frequency List Audio Frequency Control Annual Failure Rate Access Gateway Audio Gateway Anti-Glare Advanced Global Alignment Accelerated Graphics Port、Advanced Graphics Port Assisted Global Positioning System Auto Insertion Acquisition Indicatior Acquisition Indication Channel Article Inspection report Article Inspection report ATM Line Interface Module subrack alternate lighting of surfaces Accelerated Life Test General Administration Dept.
苹果内部品质近红外光谱无损检测研究进展
基金项目国家自然基金地区科学基金项目(31960503);塔里木大学研究生科研创新项目(TDGR1202256)。
作者简介何代弟(1997—),女,甘肃平凉人,硕士,从事农业信息化研究。
收稿日期2023-04-24苹果内部品质近红外光谱无损检测研究进展何代弟1,2张晓1,2张楠楠1,2袁新涛1,2马瑞1,2保昊1,2孙武军1,2(1塔里木大学信息工程学院,新疆阿拉尔843300;2塔里木绿洲农业教育部重点实验室,塔里木大学,新疆阿拉尔843300)摘要中国是苹果生产、销售大国,开展苹果内部品质无损检测对增强我国苹果市场竞争力十分重要。
近红外光谱可同时检测多种成分,是一种操作简单、成本低廉的无损检测技术,在水果内部品质无损检测中具有巨大的发展潜力。
本文介绍了近红外光谱分析技术的原理和优缺点及其在苹果内部品质检测中的应用研究,为近红外光谱分析技术在水果检测中的应用提供参考。
关键词近红外光谱分析技术;无损检测;苹果中图分类号O657.33;TS255.7文献标识码A文章编号1007-7731(2023)16-0136-04苹果是常见的水果之一,富含多种维生素、蛋白质和糖类等,营养价值高,深受消费者喜爱。
近些年,随着科技水平的发展,我国苹果的种植面积、产量快速增长,苹果的口感、品质安全等也越来越被消费者重视。
苹果内部品质与其食用口感有着直接关系,并且影响苹果的销售,因此对苹果品质进行检测评估非常必要。
苹果的品质主要由糖度、酸度、硬度、水分及脆性等参数来表征,内部品质指标直接影响着果实的口感及品质,同时也是苹果成熟度的判断依据。
消费者在购买苹果时,不仅在意苹果的形状、大小、颜色等外观品质,并且越来越注重苹果的内部品质,比如酸甜度、脆性、营养物质等。
已有的研究证明,光谱检测技术检测苹果内部品质是可行的,但传统的苹果品质检测方法效率低、操作复杂、且具有破坏性,因此苹果内部品质的无损检测仍然是重点研究领域。
目前,无损检测技术如机器视觉、高光谱成像技术、介电特性法和核磁共振检测等被应用于水果品质无损检测中,与这些常用的无损检测技术相比,近红外光谱技术是一种新兴检测技术,具有绿色、无损、快速等优点,通过漫反射和漫透射获取苹果的成分和组织信息,对获得的光谱信息进行特征提取和分析,从而检测苹果的内部品质。
苹果质量标准
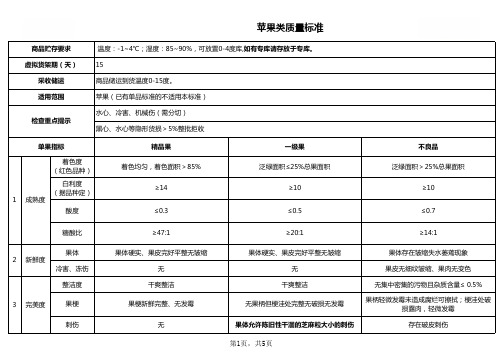
苹果类质量标准
3完美度碰压伤无常规果无碰压伤;蛇果、花牛允许轻微碰压
伤≤5处果皮不变色,不发软,单处面积不超
过1cm2
碰压伤小于5处,果皮不变色,不发软面积不
超过1.5cm2
表面缺陷(自然因素)无磨伤、雹伤、药害、日灼、水锈、垢斑病
等
磨伤、日灼、水锈不超过两处,面积小于
0.5cm²,无雹伤、药害、垢斑病等
磨伤、雹伤、药害、日灼、水锈、垢斑病等
缺陷不超过5处,面积不超过1CM2,
开裂无无开裂,(阿克苏长≤2条/1.5cm)果汁外溢;阿克苏长>2条/1.5cm)虫伤无无存在虫伤
褐色果绣不粗糙,不超出梗洼不粗糙,可轻微超出梗洼和萼洼粗糙,明显超出梗洼和萼洼
网状薄层表面光滑轻微而分离的果绣痕迹,未改变果实的整体
外观
超过果面的1/5
其余瑕疵无
枝伤、小划痕累积长度≤1.5cm,深度≤
1mm;自然生长高度发育出现的小纹路不计
入,国产苹果允许干涸的指甲扎伤。
枝伤、小划痕累积长度>1.5cm或深度>
1mm;自然生长高度发育出现的小纹路不计
入,存在新鲜的指甲扎伤。
4隐形黑心、水心无黑心、水心无黑心、水心果核发黑或扩散至果肉的黑心水心≤5% 5其他
3完美度
6、合格品图示
精
品
果
7、不合格品图示6、合格品图示
冷害冻伤
腐
烂
发
霉
着
色
不
均
开
裂
一级果一级果
7、不合格品图示
烂斑
雹伤
污渍
气孔凸显
果绣
皱缩
水心黑心
低温二氧化碳伤害
虫洞
新鲜度欠佳
机械伤。
层次分析结合模糊评价法在苹果原料加工NFC_果汁适应性评价中的应用
中国果菜China Fruit &Vegetable第43卷,第3期2023年3月精深加工Deep Processing 层次分析结合模糊评价法在苹果原料加工NFC 果汁适应性评价中的应用张莹2,路遥1,李根1,宋烨1,马寅斐1,丁辰1,朱风涛1,张鑫1,赵岩1,初乐1*(1.中华全国供销合作总社济南果品研究所,山东济南250014;2.山东农业工程学院,山东济南250100)摘要:非浓缩复原汁(not from concentrate ,NFC )果汁产品品质对原料的要求较高。
为评价不同品种苹果加工NFC 果汁的适应性,以10个苹果品种为原料,对其固酸比、色值、总酚、维生素C 、稳定性等12个指标进行测定,并以测定结果为依据,采用层次分析法构建模型。
结果表明,NFC 苹果汁品质评价模型为=0.0866×可溶性固形物+0.1841×固酸比+0.2385×总酚+0.0408×*-0.4500×稳定性,依据此模型计算得出‘富士’苹果的得分最高,这说明‘富士’苹果较适宜加工NFC 果汁。
采用模糊评价法对构建的模型进行验证,建模得分与模糊评价法得分呈线性相关,因此该模型可用于不同品种苹果加工NFC 果汁适应性的判定。
关键词:苹果;NFC 果汁;层次分析法;模糊评价法;模型构建中图分类号:TS255文献标志码:A文章编号:1008-1038(2023)03-0006-08DOI:10.19590/ki.1008-1038.2023.03.002Evaluation of the Adaptability of Different Varieties of Apple ProcessingNFC Juice Based on the Analytic Hierarchy Process and FuzzyEvaluation MethodZHANG Ying 2,LU Yao 1,LI Gen 1,SONG Ye 1,MA Yinfei 1,DING Chen 1,ZHU Fengtao 1,ZHANG Xin 1,ZHAO Yan 1,CHU Le 1*(1.Jinan Fruit Research Institute,All China Federation of Supply &Marketing Cooperatives,Jinan 250014,China;2.Shandong Agriculture and Engineering University,Jinan 250100,China)Abstract:The quality of NFC fruit juice requires high raw materials.In order to evaluate the adaptability of differentvarieties of apples for processing NFC apple juice,10varieties of apples were used as raw materials,12indicators such as sugar-acid ratio,color value,polyphenols,vitamin C and stability were measured,and then the analytic hierarchy process was used to build the model.Results showed that the quality characteristic model of NFC apple收稿日期:2022-11-30基金项目:山东省重点研发计划泰山产业领军人才项目(LJNY202001);山东省重点研发计划(乡村振兴科技创新提振行动计划)(2022TZXD007)第一作者简介:张莹(1980—),女,副教授,本科,主要从事农产品加工与工厂设计等工作*通信作者简介:初乐(1987—),女,副研究员,硕士,主要从事果蔬精深加工及产品开发工作苹果(Mill.)是蔷薇科苹果属植物的果实[1]。
- 1、下载文档前请自行甄别文档内容的完整性,平台不提供额外的编辑、内容补充、找答案等附加服务。
- 2、"仅部分预览"的文档,不可在线预览部分如存在完整性等问题,可反馈申请退款(可完整预览的文档不适用该条件!)。
- 3、如文档侵犯您的权益,请联系客服反馈,我们会尽快为您处理(人工客服工作时间:9:00-18:30)。
Apple Defect Detection and Quality Classification with MLP-Neural NetworksDevrim UNAY, Bernard GOSSELINTCTS Laboratory, Faculte Polytechnique de MonsInitialis Scientific Park, 1, Copernic AvenueB-7000 MonsBelgiumPhone : +32 (0)65 37 47 45 Fax : +32 (0)65 37 47 29E-mail: unay@tcts.fpms.ac.beAbstract-The initial analysis of a quality classification system for ‘Jonagold’ and ‘Golden Delicious’ apples is shown. Color, texture and wavelet features are extracted from the apple images. Principal components analysis was applied on the extracted features and some preliminary performance tests were done with single and multi layer perceptrons.Keywords-computer vision; image processing; defect segmentation; feature selection; neural networksI. INTRODUCTIONAccurate automatic classification of agricultural products is a necessity for agricultural marketing to increase the speed and minimize the miss-classifications.The European Union defines three quality classes (“extra”, “I”, and “II”) for the fresh apples with the tolerances of 5, 10, and 10 per cent by number or weight of apples, respectively [1]. The apples in the “extra” class must be of superior quality with no defects or irregularity in shape, whereas the classes “I” and “II” can contain defects up to 1 and 2.5 cm2, respectively. Also, Belgian Trade Practices define four classes for ‘Golden Delicious’ apples with respect to the ground color of the fruit (‘++’ for the greenest, ‘+’, ‘’, and ‘r’ for yellow). It is clear that the classification of different kinds of apples into predetermined categories as accurate and quickly as possible is a hard task.Many researchers have made considerable efforts in the field of machine vision based classification of apples. Several approaches like monochrome-colored-near infrared imaging, and local-global methods have been tried.Zion et al [2] introduced a computerized method to detect the bruises of Jonathan, Golden Delicious, and Hermon apples from magnetic resonance images by threshold technique. The algorithm was only able to discriminate between all-bruised and non-bruised apples and was not applicable to on-line detection.Pla and Juste [3] presented a thinning algorithm to discriminate between stem and body of the apples on monochromatic images. However the task of classifying the calyx and defected parts real-time was missing.Yang and Marchant [4] used the ‘flooding’ algorithm for initial segmentation and ‘snakes’ algorithm for refining the boundary of the blemishes on the monochromatic images of apples. They applied both median and gaussian filters to remove impulsive noise and smooth small features.Nakano [5], studied color (red, green, and blue) grading of “San Fuji” apples by two types of neural network. First one classified the pixels into six categories with an overall accuracy of over 95 per cent, but mistook the injured surfaces as vines. The second one classified the fruit into five categories with the recognition rate of 75 per cent for damaged fruits. However, the recognition rate of class A was not higher than 33 per cent.Miller et al [6] compared different neural network models for detection of blemishes of various kinds of apples by their reflectance characteristics and concluded that multi-layer back propagation (MLBP) method gave the best recognition rates. Also they found that increased complexity of the neural network system did not yield to better results.Leemans [7], segmented defects of ‘Golden Delicious’ apples by a pixel-wise comparison method between the chromatic (rgb) values of the related pixel and the color reference model. The local and global approaches of comparison were effective, but further research was needed. In his second research [8], Leemans used a Bayesian classification method for pixel-wise segmentation on chromatic images of ‘Jonagold’ apples. The method failed in discriminating between pixels of transition area and russet.Wen and Tao [9] introduced automated rule-based system by near-infrared images to classify ‘Red Delicious’ apples as defected or not. They reached a speed of 50 apples per second with high recognition rates, but had problems in identification of stem/calyx.Because of the concavity of the apple, the intensity of the light decreases from the center to the boundaries. Penman [10], introduced an array of blue light sources and an algorithm to correctly discriminate apple blemishes from stem, calyx and their concavities. However, the algorithm has to be improved in accuracy, implemented in real time and used in conjunction with defect detection algorithms.In the field of machine vision based classification, scientists have used many other kinds of agricultural products other than apples. Kim et al [11] experimented on kiwi fruits. Guyer and Yang [12] used genetic artificial neural networks to classify cherries. Diaz et al [13] introduced an algorithm to classify olives. Laykin et al [14], used image processing techniques to classify tomatoes. Patel et al [15] developed an expert sorting system for eggs. Brezmes et al [16] classified peaches and pears. Harel and Smith [17] used a texture-based approach to classify grapes.II. METHODOLOGYThe acquisition system used in this study to retrieve the apple images was the same with Leemans’ [7]. A colored camera with a frame grabber, were used to acquire the images while the apples were passing through a tunnel providing diffuse light.Data set was composed of 229 images (22 bruised, 207 defected) of ‘Jonagold’ apples and 76 images (12 bruised, 64 defected) of ‘Golden Delicious’ apples. The images contained various kinds of defects, like russet, scab, fungi attack, bitter pit, bruising, punches, insect holes and growth defects, as well as stem and calyx areas. However, the initial analysis presented here includes a small group of this data set.A. Initial ProcessingDuring the acquisition of images orientation and rotation of the apples were neither controlled nor fixed. Therefore, background had to be excluded from each image. The images of bruised apples of each kind contained a bi-colored (gray, black) background, whereas the defected ones were imaged on black background only. Low pass filter at level 150 on B-channel and band-pass filter at levels 35-225 on channels R-G were applied to eliminate gray and black backgrounds, respectively.Dimensions of the images were differing within the data set. In order to decrease computation time while doing mathematical operations, images had to be square. So, areas outside the apple were deleted and the remaining images were resized to 128x128 dimension by nearest neighborhood method.B. Feature extraction‘The problem of classification is basically one of partitioning the feature space into regions, one region for each category.’ [18] So, high discriminating features will lead to high and accurate classification rates.Color values (RGB-channels), as local features, are directly related with the images, so they were introduced to the system without any change. For the classification of a pixel, neighboring pixels can provide vital evidence. So, two groups of color features were introduced to the system; one-to-one pixel mapping of color feature set in the first, whereas n-to-one in the other, with n (or neighborhood) determined by the rgb-window size.Structural analysis will yield important information for classification, so co-occurrence matrix of Haralick et al [19] is used to extract textural features. Co-occurrence matrix is a single level dependence matrix that contains the relative frequencies of two coordinate elements separated by a distance d. As you move from one pixel to another on the image, entries of the initial and final pixels become the coordinates of the co-occurrence matrix to be incremented, which in the end will represent structural characteristics of the image. Therefore, moving in different directions and distances on the image will lead to different co-occurrence matrices. In literature, most commonly used pixel separation distance and directions (angles) are 1 pixel and 0, π/4, π/2, and 3π/4 radians, respectively [20, 21], which are also used in this study.The four textural features derived from the co-occurrence matrices are:1. Energy()()∑∑===25525521,,i jdji sdf2. Entropy()()()∑∑==⋅=2552552,,log,,i jdji sdji sdf3. Inertia()()()∑∑==⋅−=25525523,,i jdji sjidf4. Local Homogeneity()()∑∑==⋅−+=255025524,,)(11i j d j i s j i d fIn the above equations, ()d j i s ,, refers to thenormalized entry of the co-occurrence matrices found by dividing the initial entries with total number of pixels of the sub-image, where ),(j i are the coordinates of the co-occurrence matrices and d is the pixel separation distance.In order to locate the spectral differences within and between images, many of the spectral analysis methods like Fourier, wavelet or cosine transforms could be used. The advantage of localization in time and frequency made wavelets preferable. Within the orthogonal and compactly supported wavelets (daubechies, symlets, and coiflets), coiflets have more number of vanishing moments at the same order, so have more information on the details. Therefore, 2nd order coiflets wavelet decomposition is applied on each sub-image retrieving 1 approximate and 2x3 detailed (horizontal, vertical and diagonal for each order) coefficients.Calculating the texture and wavelet features of the whole image will yield important global results maybe, but obviously will not provide us enough information about both the size and type of the defects that are crucial in classification or discrimination between stem, calyx and defected areas. Because of that, these features were calculated on windowed sub-sections of each image.Two different window approaches were used to get the sub-images. In discrete window approach, images were divided into 64 16x16 non-overlapping sub-images. On each sub-image, both textural and wavelet features were calculated and they were related to each pixel within that sub-image. However in sliding approach, features were calculated a pixel at a time on the 16x16 neighborhood by zero-padding the areas outside the image. That’s why sliding window method required 256 times more computation than discrete window for 128x128 image size and 16x16 window size, which is undesirable for an automatic process.Initial analysis showed that B-channel provided very little information of classification compared to R and G channels, so the texture and wavelet features were calculated on the R and G channels of the images only. The resulting four texture features of a pixel were from the average of co-occurrence matrices in all directions.Wavelet features were found by taking the average and standard deviations of the coefficients of each decomposition class. At the end of feature extraction, there were 8 textural, 28 wavelet and 3 color features (27 for 3x3, or 75 for 5x5 rgb-windows) making a total of 39 (63, or 111) features.C. Feature selectionIn order to get high performance of classification, the features introduced to any neural network system should be in the same range, which can be achieved by normalization. The features are normalized so that the mean is 0 and the standard deviation is 1 by the formula:()[]()i i i i f f f f σµ−=′ where i i f f ′& are the initial and final values of a feature, respectively, ()i f µ is the mean and ()i f σ is the standard deviation of all the values of the class that feature belongs to. “The designer usually believes that each feature is useful for at least some of the discriminations.” [18] However, superfluous and class-conditionally dependent features may lead to terrible classification performance. So, principal components analysis was applied on the features to get an uncorrelated data set. First covariance matrix of the feature set was calculated and then the matrix of the eigenvectors of this covariance matrix was multiplied with the feature set, producing transformed feature set whose components are uncorrelated and ordered according to the magnitude of their variance. Then the components, which contribute only a small amount (1 per cent in this case) to the total variance in the transformed feature set, are eliminated.D. Neural Network modelAs the literature review indicates there are few researches in this field done with neural networks, which are used in this work. The true power and advantage of neural networks lies in their ability to represent both linear and nonlinear relationships and to learn these relationships directly from the data being modeled.The neural network in this study is composed of perceptron neurons with an adaptive supervised learning back-propagation algorithm.E. Manual Segmentation of ApplesSegmentation of apple images into determined classes was done manually by an image processing software.One of the images of ‘Golden Delicious’ apples and its segmentation into four classes is shown below (Figures 1, 2).Figure 1: Original image (Gold001.tif)Figure 2: Segmentation into four-classes (left-to-right: background, healthy skin, defected, stem/calyx)The original images were 128x128 in dimension with three-color channels (rgb). In Figure 2, resulting images are binary and the segmented pixels are the areas white in color. The difference between the sizes of the original and segmented images is due to visual preference of the authors; i.e. there was no alteration in dimensions.Table 1 represents the class-distribution of the pixels of the segmented image.Class Pixel # Ratio %Background 3520 21.48Healthy skin 9355 57.10Defected skin 3048 18.60Stem/Calyx 461 2.81 Table 1: Pixel class-distribution of Gold001.tif18 more apple images containing both defected and stem/calyx areas were segmented like the above making a total of 19 images (8 of ‘Golden Delicious’ and 11 of ‘Jonagold’) for the current data set. The following results are obtained analyzing these images.III. RESULTS & DISCUSSIONA. Three-Class SLP TestThe background pixels in the images can be separated from the apple region by simple image processing techniques. So, without the background, a pixel-wise three-class classification test can be done on the current data set.For each image, 37 pixels (samples) selected homogeneously from each three classes were homogeneously mixed and introduced to the system for training. Then for the validation set, same approach was used to select samples from the rest of the image. As a result, the training and validation sets were composed of 111 samples.Three different rgb-window sizes (1x1, 3x3, and 5x5) and two different window types (discrete and sliding) were used to extract color features and texture, wavelet features, respectively. Normalization and principal components analysis were applied on all the feature sets by the schemes explained before.‘Train with one, test with rest’ method was used for the simulations of 19 images with a single layer perceptron neural network. The average results of all 19 simulations are in Table 2.wind rgb-wind tr vl rec c1 c2 c31x1 90.1992.7567.5372.5139.1529.593x3 90.8092.0368.1972.8144.3632.96 discrete5x5 90.6193.0366.1170.0451.0535.451x1 89.3889.3366.6671.0347.0033.023x3 93.4692.2267.8772.1752.4834.40sliding5x5 92.0393.0866.9770.8655.2636.36Table 2: Three-class simulation results of‘train with one, test with rest’ method.The above results are all in percentages. ‘c1, c2, c3’ in the first row represents the classes healthy, stem/calyx and defected, respectively. Recognition rates of each method on training and validation data sets are over 90 per cent (except ‘sliding’ window, ‘1x1’ rgb-window method), whereas the validation rates are between 65-70 per cent. The training and validation sets include same number of samples from each class, but simulation sets are composed of all the pixels of the images and the average distribution of the images is 1.5, 9.5, and 89.0 per cent for stem/calyx, defected and healthy classes, respectively. This unequal distribution results in the difference between the validation and recognition rates.‘Sliding window’ method provides more information to the system than the ‘discrete’ one, by definition. Although there is no significant difference in the overall recognition rates, recognition rates of the stem/calyx (‘c2’) and defected (‘c3’) classes show this increase in performance. As the size of the ‘rgb-window’ is increased, performance of the system should increase also. It is observable in the ‘c2’, ‘c3’ classes.The effects of different methods on the performance of the system are obvious, but the class recognition rates are lower than the standards, which courage the authors to continue on testing with increased size and dispersion of the training and validation sample sets. The reader should also be aware that more information introduced to the system will improve the performance with an increase in the computation times of notonly the recognition but also the feature extraction and selection parts of the system.B. Three-Class MLP TestThe results of the three-class single layer (SLP) test encouraged the authors to make tests with multi layer perceptrons.According to its performances in the previous test, one of the images (Gold002.tif from ‘Golden Delicious’ apples) was selected for this test. The method was again ‘train with one, test with rest’ in order to compare the results with single layer ones. 1 and 2 hidden layers with 0, 50, 100, 150, and 200 neurons were used in the system.wind rgbwind system rec c1 c2 c31x1 0-0 65.9870.6568.8322.103x3 0-0 61.1065.1084.6920.39discrete5x5 0-0 68.5373.3285.2921.401x1 0-0 63.7464.6941.3158.243x3 0-0 65.9566.1656.5865.42sliding5x5 0-0 56.1656.3672.6551.90Table 3: SLP results of Gold002.tif.wind rgbwind system rec c1 c2 c31x1 200-200 65.45 66.30 51.51 59.623x3 200-50 66.52 66.09 63.96 70.96 discrete5x5 100-50 67.10 67.03 69.85 67.381x1 150-50 69.58 69.00 39.76 79.393x3 200-0 68.99 68.89 65.24 70.56 sliding5x5 150-50 67.80 67.15 70.34 73.45Table 4: Best MLP results of Gold002.tif.The recognition rates found for multi layer perceptron network with different number of neurons were promising. The best performances are displayed in Table 4. An interesting observation is that, the recognition rates of multi layer network are higher than those of the single layer one (Table 3) for defected class (‘c3’). A careful reader will notice that as the system gets more complex, recognition rates of defected class increase with a decrease in the recognition of healthy or stem/calyx classes. Hence, there is a compromise between the recognition rates of each class independent of the complexity of the system. This explains the constancy of the overall recognitions even though the system complexity changes. C.Three-Class Homogeneous Sampling TestIn the previous tests, the system trained with one of the apple images was expected to accurately recognize the rest of the apples. It will be more realistic if a group of samples from each apple variety (‘Golden Delicious’ and ‘Jonagold’) is introduced to the system as the training set.Samples selected homogeneously will yield more realistic results about the population. For this reason all the 19 images segmented (11 ‘Jonagold’ and 8 ‘Golden Delicious’) were distributed evenly within the training, validation and simulation sets as 7 (5 ‘Jonagold’ - 2 ‘Golden’), 6 (3-3) and 6 (3-3), respectively. To enable a comparison with the previous tests, the sample size selected from each class of each image was 37, making a total of 777 samples for training, 666 samples for validation and all samples of the simulation images for simulation. Discrete windowing and 3x3 rgb-window methods were used for feature extraction.The important problem at this point is ‘Which image should be in which data set?’ or ‘Which samples provide more information of discrimination about the population?’ A method of random selection of images for each data set can be a solution. 100 random selections were done and these sample sets were used to feed the single layer neural network.The average rates of these 100 tests were 73.38, 67.84, 76.94, 82.26, 64.75, and 35.77 per cent for recognition of training, validation, simulation, healthy, stem/calyx and defected sets, respectively.Table 5 displays the results of this method with the results of three-class SLP test for comparison, where the abbreviations ‘1,8’ (train with one, test with rest), ‘7,6,6’ (homogeneous sampling), ‘A’ (average) and ‘B’ (best) are used.test tr vl rec c1 c2 c3A 90.80 92.03 68.19 72.81 44.36 32.961,8B 85.59 85.59 75.73 81.06 67.26 31.54A 73.38 67.84 76.94 82.26 64.75 35.777,6,6B 67.05 60.36 89.89 90.45 62.23 83.69Table 5: Results of ‘1,8’ and ‘7,6,6’ tests.The rows indicated as ‘A’ in Table 5, represent the averaged results of all combinations of ‘1,8’ and ‘7,6,6’ (19 combinations for ‘1,8’ and 100 combinations for ‘7,6,6’), while ‘B’ indicated rows show the results of best classifying combination in each test.In the training step, the population (19 images) was represented by 7 images in ‘7,6,6’ test, which was 1 for ‘1,8’ test. The effect of this different sampling can be observed in the results of average simulation rates. They are strictly higher for test ‘7,6,6’ than those of ‘1,8’. The bestrecognition rates for ‘7,6,6,’ are very promising with 90 and 83 per cent for healthy and defected classes, respectively. However, even for the best case of ‘7,6,6’ class-recognition rates found are quite low with respect to the standards.IV. CONCLUSION & FUTURE WORKThe field of automatic classification of agricultural products is increasingly attracting the attention of researchers as well as governments and agricultural markets. However, an accurate automatic classification system for apples requires highly detailed research due to the difficulty of the task and high number of parameters affecting the performance.Although the classification approaches used in the literature (image-based or apple-based) are different than the pixel-based one of this study, the comparison of the best homogeneous sampling result with the ones achieved by other authors can guide the reader for better judgment. Nakano [5] reached over 75 per cent recognition rates for about 40 defected apples with his neural network B, whereas our best results were 89.9 and 83.7 per cent for overall and defected pixels of 6 defected images. Also, Wen et al [9] reached about 84 per cent recognition for over 300 stem and calyx images, which is nearly 62 per cent for our case.The preliminary results shown here are promising, but not enough. There is a lot more to do. More samples of the population should be introduced to the training set, better discriminating features (local or global) should be searched, the affects of different feature selection algorithms (like Fisher’s linear discriminator) on the performance should be compared, improvements of combined methods like statistical analysis and neural networks should be examined, performance of the system should be verified in real-time and in real environment…V. ACKNOWLEDGEMENTSThis project is known as the CAPA (Classification Automatique de Produits Agricoles) project and is funded by Ministere de la Region Wallonne, Belgium.VI. REFERENCE2. Zion B., et al, “Detection of bruises in magneticresonance images of apples”, Comp. Elec. Agric., 13, 289-299, 1995.3. Pla F., Juste F., “A thinning-based algorithm to characterizefruit stems from profile images”, Comp. Elec. Agric., 13, 301-314, 1995.4. Yang Q., Marchant J. A., “Accurate blemish detection withactive contour models”, Comp. Elec. Agric., 14, 77-89, 1996. 5. Nakano K., “Application of neural networks to the colorgrading of apples”, Comp. Elec. Agric., 18, 105-116, 1998.6. Miller W. M., et al, “Pattern recognition models for spectralreflectance evaluation of apple blemishes”, Postharvest Bio. Tech., 14n 11-20, 1998.7. Leemans V., et al, “Defects segmentation on ‘GoldenDelicious’ apples by using color machine vision”, Comp. Elec. Agric., 20, 117-130, 1998.8. Leemans V., et al, “Defect segmentation on ‘Jonagold’ applesusing color machine vision and a Bayesian classification method”, Comp. Elec. Agric., 23, 43-53, 1999.9. Wen Z., Tao Y., “Building a rule-based machine-vision systemfor defect inspection on apple sorting and packing lines”, Expert Sys. App., 16, 307-313, 1999.10. Penman D. W., “Determination of stem and calyx location onapples using automatic visual inspection”, Comp. Elec. Agric., 33, 7-18, 2001.11. Kim J., et al, “Linear and non-linear pattern recognition modelsfor classification of fruit from visible-near infrared spectra”, Chemo. Intel. Lab. Sys., 51, 201-216, 2001.12. Guyer D., Yang X., “Use of genetic artificial neural networksand spectral imaging for defect detection on cherries”, Comp. Elec. Agric., 29, 179-194, 2000.13. Diaz R., et al, “The application of a fast algorithm for theclassification of olives by machine vision”, Food Res. Int., 33, 305-309, 2000.14. Laykin S., et al, “Development of a quality sorting machineusing machine vision and impact”, ASAE An. Int. Meet., paper no: 99-3144, July 18-21, Toronto, Canada, 1999.15. Patel V. C., et al, “Development and evaluation of an expertsystem for egg sorting”, Comp. Elec. Agric., 20, 97-116,1998. 16. Brezmes J., et al, “Fruit ripeness monitoring using anElectronic Nose”, Sensors and Actuators., B 69, 223-229,2000.E., Wiley & Sons, Canada, 1973. 19. Haralick R. M., et al, “Textural features for imageclassification”, IEEE Trans. SMC, 3, 610-621, 1973.20. Latif-Ahmet A., et al, “An efficient method for texture defectdetection: sub-band domain co-occurrence matrices”, Image Vision Comp.,18, 543-553, 2000.21. “Epileptic activity detection in EEG with Neural Networks”, Varsta M. et al, research report B3, Comp. Eng. Lab., Helsinki Univ. Tech., Finland, April 1997.。