Cost15EChapter09_Solutions
APQP某汽车

访问 APQP 指南
Both the Guideline and the forms are available.指南和表格均可由此获得。
1-4
Module Introduction
FPDS Timing Relationship and ResponsibilitiesFPDS 时间进度关系和职责
APQP Benefits
APQP aids the program team by:APQP帮助项目小组:Adding discipline 增加纪律 Facilitating early identification of required changes 早期确定可能的更改Avoiding late changes 避免晚期更改 Providing a quality product on time, at acceptable cost, to satisfy customers 用可接受的价格,准时提供优质的产品,满足客户Facilitating continuous improvement 使持续改进更方便
APQP 23个要素
1 选点决定 2 顾客输入要求 3 精致工艺技术 4 设计失效模式后果分析 5 设计评审 6 设计验证计划 7 分承包方 APQP 状态 8 设施、工具和量具 9 样件制造计划 10 样件制造 11 图纸和规范
12 小组可行性承诺 13 制造过程流程图 14 过程失效模式后果分析 15 测量系统评价 16 试生产控制计划 17 操作工过程指导书 18 包装规范 19 产品试生产 20 生产控制计划 21 初始过程能力研究 22 生产确认试验 23 生产件批准 (PSW)
Course Goals
Tutorial_3_solutions
Tutorial_3_solutions1.Explain each of the following statements using supply-and-demand diagrams.a.“When a cold snap hits Florida, the price of orange juice rises in supermarketsthroughout the country.”b.“When the weather turns warm in New England every summer, the price of hotelrooms in Caribbean resorts plummets.”c.“When a war breaks out in the Middle East, the price of gasoline rises, and the priceof a used Cadillac falls.”2.“An increase in the demand for notebooks raises the quantity of notebooks demanded butnot the quantity supplied.” Is this statement true or false? Explain.3.Over the past decades, technological advances have reduced the cost of computer chips.How do you think this has affected the market for computers? For computer software? For typewriters?4.Consider the market for eggs. For each of the events listed here, identify which of thedeterminants of demand or supply are affected. Also indicate whether supply or demand increases or decreases. Then draw a diagram to show the effect on the price and quantity of eggs.a.The price of grain that is fed to hens falls.b.The price of bacon falls.c. A new study is released that indicates that eating eggs is hazardous to one’s health.d.The number of egg-producing farms falls.e.This weekend is the Easter holiday.1.The statements can be explained as follows:a. Cold weather damages the orange crop, reducing the supply of oranges. This can be seen inFigure 1 as a shift to the left in the supply curve for oranges. The newequilibrium price is higher than the old equilibrium price.Figure 1b.People often travel to the Caribbean from New England to escape cold weather, so thedemand for Caribbean hotel rooms is high in the winter. In the summer, fewer people travel to the Caribbean, because northern climes are more pleasant. The result, as shown in Figure 2, is a shift to the left in the demand curve. The equilibrium price of Caribbean hotel rooms is thus lower in the summer than in the winter, as the figure shows.Figure 2c.When a war breaks out in the Middle East, many markets are affected. Because a largeproportion of oil production takes place there, the war disrupts oil supplies, shifting the supply curve for gasoline to the left, as shown in Figure 3. The result is a rise in the equilibrium priceof gasoline. With a higher price for gasoline, the cost of operating a gas-guzzling automobile like a Cadillac will increase. As a result, the demand for used Cadillacs will decline, as people in the market for cars will not find Cadillacs as attractive. In addition, some people who already own Cadillacs will try to sell them. The result is that the demand curve for used Cadillacs shifts to the left, while the supply curve shifts to the right, as shown in Figure 4. The result is a decline in the equilibrium price of used Cadillacs.Figure 3 Figure 42. The statement that "an increase in the demand for notebooks raises the quantity of notebooksdemanded, but not the quantity supplied," in general, is false. As Figure 5 shows, the increasein demand for notebooks results in an increased quantity supplied. The only way the statement would be true is if the supply curve was a vertical line, as shown in Figure 6.Figure 5 Figure 63.Technological advances that reduce the cost of producing computer chips represent a decline in an input price for producing a computer. The result is a shift to the right in the supply of computers, as shown in Figure 7. The equilibrium price falls and the equilibrium quantity rises, as the figure shows.Figure 7Because computer software is a complement to computers, the lower equilibrium price of computers increases the demand for software. As Figure 8 shows, the result is a rise in both the equilibrium price and quantity of software.Figure 8Because typewriters are substitutes for computers, the lower equilibrium price of computers reduces the demand for typewriters. As Figure 9 shows, the result is a decline in both the equilibrium price and quantity of typewriters.Figure 94.The answers are as follows:a.If the price of grain used to feed hens falls, the supply of eggs will rise. Demand will not be affected. The result is a fall in the price and an increase in the quantity sold, as Figure 10 shows.Figure 10b.If the price of bacon falls, the demand for eggs will rise because eggs and bacon are complements. Supply will not be affected. The result is an increase in both the price of eggs and the quantity sold, as Figure 11 shows.Figure 11c. A new study that indicates that eat ing eggs is hazardous to one’s health will cause a decline in the demand for eggs. Supply is not affected. The result is a decline in the price of eggs and a decrease in the quantity sold, as Figure 12 shows.Figure 12d.If the number of egg-producing farms falls, the supply of eggs will decline. Demand isnot affected. The equilibrium price of eggs will fall and quantity of eggs sold rises as Figure13 shows.Figure 13equilibrium price and the equilibrium quantity rise, as Figure 11 shows.。
审计学:一种整合方法阿伦斯英文版第12版课后答案Chapter15SolutionsManual
审计学:⼀种整合⽅法阿伦斯英⽂版第12版课后答案Chapter15SolutionsManualChapter 15Audit Sampling for Tests of Controls andSubstantive Tests of TransactionsReview Questions15-1 A representative sample is one in which the characteristics of interest for the sample are approximately the same as for the population (that is, the sample accurately represents the total population). If the population contains significant misstatements, but the sample is practically free of misstatements, the sample is nonrepresentative, which is likely to result in an improper audit decision. The auditor can never know for sure whether he or she has a representative sample because the entire population is ordinarily not tested, but certain things, such as the use of random selection, can increase the likelihood of a representative sample.15-2Statistical sampling is the use of mathematical measurement techniques to calculate formal statistical results. The auditor therefore quantifies sampling risk when statistical sampling is used. In nonstatistical sampling, the auditor does not quantify sampling risk. Instead, conclusions are reached about populations on a more judgmental basis.For both statistical and nonstatistical methods, the three main parts are:1. Plan the sample2. Select the sample and perform the tests3. Evaluate the results15-3In replacement sampling, an element in the population can be included in the sample more than once if the random number corresponding to that element is selected more than once. In nonreplacement sampling, an element can be included only once. If the random number corresponding to an element is selected more than once, it is simply treated as a discard the second time. Although both selection approaches are consistent with sound statistical theory, auditors rarely use replacement sampling; it seems more intuitively satisfying to auditors to include an item only once.15-4 A simple random sample is one in which every possible combination of elements in the population has an equal chance of selection. Two methods of simple random selection are use of a random number table, and use of the computer to generate random numbers. Auditors most often use the computer to generate random numbers because it saves time, reduces the likelihood of error, and provides automatic documentation of the sample selected.15-5In systematic sampling, the auditor calculates an interval and then methodically selects the items for the sample based on the size of the interval. The interval is set by dividing the population size by the number of sample items desired.To select 35 numbers from a population of 1,750, the auditor divides 35 into 1,750 and gets an interval of 50. He or she then selects a random number between 0 and 49. Assume the auditor chooses 17. The first item is the number 17. The next is 67, then 117, 167, and so on.The advantage of systematic sampling is its ease of use. In most populations a systematic sample can be drawn quickly, the approach automatically puts the numbers in sequential order and documentation is easy.A major problem with the use of systematic sampling is the possibility of bias. Because of the way systematic samples are selected, once the first item in the sample is selected, other items are chosen automatically. This causes no problems if the characteristics of interest, such as control deviations, are distributed randomly throughout the population; however, in many cases they are not. If all items of a certain type are processed at certain times of the month or with the use of certain document numbers, a systematically drawn sample has a higher likelihood of failing to obtain a representative sample. This shortcoming is sufficiently serious that some CPA firms prohibit the use of systematic sampling. 15-6The purpose of using nonstatistical sampling for tests of controls and substantive tests of transactions is to estimate the proportion of items in a population containing a characteristic or attribute of interest. The auditor is ordinarily interested in determining internal control deviations or monetary misstatements for tests of controls and substantive tests of transactions.15-7 A block sample is the selection of several items in sequence. Once the first item in the block is selected, the remainder of the block is chosen automatically. Thus, to select 5 blocks of 20 sales invoices, one would select one invoice and the block would be that invoice plus the next 19 entries. This procedure would be repeated 4 other times.15-8 The terms below are defined as follows:15-8 (continued)15-9The sampling unit is the population item from which the auditor selects sample items. The major consideration in defining the sampling unit is making it consistent with the objectives of the audit tests. Thus, the definition of the population and the planned audit procedures usually dictate the appropriate sampling unit.The sampling unit for verifying the occurrence of recorded sales would be the entries in the sales journal since this is the document the auditor wishes to validate. The sampling unit for testing the possibility of omitted sales is the shipping document from which sales are recorded because the failure to bill a shipment is the exception condition of interest to the auditor.15-10 The tolerable exception rate (TER) represents the exception rate that the auditor will permit in the population and still be willing to use the assessed control risk and/or the amount of monetary misstatements in the transactions established during planning. TER is determined by choice of the auditor on the basis of his or her professional judgment.The computed upper exception rate (CUER) is the highest estimated exception rate in the population, at a given ARACR. For nonstatistical sampling, CUER is determined by adding an estimate of sampling error to the SER (sample exception rate). For statistical sampling, CUER is determined by using a statistical sampling table after the auditor has completed the audit testing and therefore knows the number of exceptions in the sample.15-11 Sampling error is an inherent part of sampling that results from testing less than the entire population. Sampling error simply means that the sample is not perfectly representative of the entire population.Nonsampling error occurs when audit tests do not uncover errors that exist in the sample. Nonsampling error can result from:1. The auditor's failure to recognize exceptions, or2. Inappropriate or ineffective audit procedures.There are two ways to reduce sampling risk:1. Increase sample size.2. Use an appropriate method of selecting sample items from thepopulation.Careful design of audit procedures and proper supervision and review are ways to reduce nonsampling risk.15-12 An attribute is the definition of the characteristic being tested and the exception conditions whenever audit sampling is used. The attributes of interest are determined directly from the audit program.15-13 An attribute is the characteristic being tested for in a population. An exception occurs when the attribute being tested for is absent. The exception for the audit procedure, the duplicate sales invoice has been initialed indicating the performance of internal verification, is the lack of initials on duplicate sales invoices.15-14 Tolerable exception rate is the result of an auditor's judgment. The suitable TER is a question of materiality and is therefore affected by both the definition and the importance of the attribute in the audit plan.The sample size for a TER of 6% would be smaller than that for a TER of 3%, all other factors being equal.15-15 The appropriate ARACR is a decision the auditor must make using professional judgment. The degree to which the auditor wishes to reduce assessed control risk below the maximum is the major factor determining the auditor's ARACR.The auditor will choose a smaller sample size for an ARACR of 10% than would be used if the risk were 5%, all other factors being equal.15-16 The relationship between sample size and the four factors determining sample size are as follows:a. As the ARACR increases, the required sample size decreases.b. As the population size increases, the required sample size isnormally unchanged, or may increase slightly.c. As the TER increases, the sample size decreases.d. As the EPER increases, the required sample size increases.15-17 In this situation, the SER is 3%, the sample size is 100 and the ARACR is 5%. From the 5% ARACR table (Table 15-9) then, the CUER is 7.6%. This means that the auditor can state with a 5% risk of being wrong that the true population exception rate does not exceed 7.6%.15-18 Analysis of exceptions is the investigation of individual exceptions to determine the cause of the breakdown in internal control. Such analysis is important because by discovering the nature and causes of individual exceptions, the auditor can more effectively evaluate the effectiveness of internal control. The analysis attempts to tell the "why" and "how" of the exceptions after the auditor already knows how many and what types of exceptions have occurred.15-19 When the CUER exceeds the TER, the auditor may do one or more of the following:1. Revise the TER or the ARACR. This alternative should be followed onlywhen the auditor has concluded that the original specifications weretoo conservative, and when he or she is willing to accept the riskassociated with the higher specifications.2. Expand the sample size. This alternative should be followed whenthe auditor expects the additional benefits to exceed the additionalcosts, that is, the auditor believes that the sample tested was notrepresentative of the population.3. Revise assessed control risk upward. This is likely to increasesubstantive procedures. Revising assessed control risk may bedone if 1 or 2 is not practical and additional substantive proceduresare possible.4. Write a letter to management. This action should be done inconjunction with each of the three alternatives above. Managementshould always be informed when its internal controls are notoperating effectively. If a deficiency in internal control is consideredto be a significant deficiency in the design or operation of internalcontrol, professional standards require the auditor to communicatethe significant deficiency to the audit committee or its equivalent inwriting. If the client is a publicly traded company, the auditor mustevaluate the deficiency to determine the impact on the auditor’sreport on internal control over financial reporting. If the deficiency isdeemed to be a material weakness, the auditor’s report on internalcontrol would contain an adverse opinion.15-20 Random (probabilistic) selection is a part of statistical sampling, but it is not, by itself, statistical measurement. To have statistical measurement, it is necessary to mathematically generalize from the sample to the population.Probabilistic selection must be used if the sample is to be evaluated statistically, although it is also acceptable to use probabilistic selection with a nonstatistical evaluation. If nonprobabilistic selection is used, nonstatistical evaluation must be used.15-21 The decisions the auditor must make in using attributes sampling are: What are the objectives of the audit test? Does audit sampling apply?What attributes are to be tested and what exception conditions are identified?What is the population?What is the sampling unit?What should the TER be?What should the ARACR be?What is the EPER?What generalizations can be made from the sample to thepopulation?What are the causes of the individual exceptions?Is the population acceptable?15-21 (continued)In making the above decisions, the following should be considered: The individual situation.Time and budget constraints.The availability of additional substantive procedures.The professional judgment of the auditor.Multiple Choice Questions From CPA Examinations15-22 a. (1) b. (3) c. (2) d. (4)15-23 a. (1) b. (3) c. (4) d. (4)15-24 a. (4) b. (3) c. (1) d. (2)Discussion Questions and Problems15-25a.An example random sampling plan prepared in Excel (P1525.xls) is available on the Companion Website and on the Instructor’s Resource CD-ROM, which is available upon request. The command for selecting the random number can be entered directly onto the spreadsheet, or can be selected from the function menu (math & trig) functions. It may be necessary to add the analysis tool pack to access the RANDBETWEEN function. Once the formula is entered, it can be copied down to select additional random numbers. When a pair of random numbers is required, the formula for the first random number can be entered in the first column, and the formula for the second random number can be entered in the second column.a. First five numbers using systematic selection:Using systematic selection, the definition of the sampling unit for determining the selection interval for population 3 is the total number of lines in the population. The length of the interval is rounded down to ensure that all line numbers selected are within the defined population.15-26a. To test whether shipments have been billed, a sample of warehouse removal slips should be selected and examined to see ifthey have the proper sales invoice attached. The sampling unit willtherefore be the warehouse removal slip.b. Attributes sampling method: Assuming the auditor is willing to accept a TER of 3% at a 10% ARACR, expecting no exceptions in the sample, the appropriate sample size would be 76, determined from Table 15-8.Nonstatistical sampling method: There is no one right answer to this question because the sample size is determined using professional judgment. Due to the relatively small TER (3%), the sample size should not be small. It will most likely be similar in size to the sample chosen by the statistical method.c. Systematic sample selection:22839 = Population size of warehouse removal slips(37521-14682).76 = Sample size using statistical sampling (students’answers will vary if nonstatistical sampling wasused in part b.300 = Interval (22839/76) if statistical sampling is used (students’ answers will vary if nonstatisticalsampling was used in part b).14825 = Random starting point.Select warehouse removal slip 14825 and every 300th warehouse removal slip after (15125, 15425, etc.)Computer generation of random numbers using Excel (P1526.xls): =RANDBETWEEN(14682,37521)The command for selecting the random number can be entered directly onto the spreadsheet, or can be selected from the function menu (math & trig) functions. It may be necessary to add the analysis tool pack to access the RANDBETWEEN function. Once the formula is entered, it can be copied down to select additional random numbers.d. Other audit procedures that could be performed are:1. Test extensions on attached sales invoices for clerical accuracy. (Accuracy)2. Test time delay between warehouse removal slip date and billing date for timeliness of billing. (Timing)3. Trace entries into perpetual inventory records to determinethat inventory is properly relieved for shipments. (Postingand summarization)15-26 (continued)e. The test performed in part c cannot be used to test for occurrenceof sales because the auditor already knows that inventory wasshipped for these sales. To test for occurrence of sales, the salesinvoice entry in the sales journal is the sampling unit. Since thesales invoice numbers are not identical to the warehouse removalslips it would be improper to use the same sample.15-27a. It would be appropriate to use attributes sampling for all audit procedures except audit procedure 1. Procedure 1 is an analyticalprocedure for which the auditor is doing a 100% review of the entirecash receipts journal.b. The appropriate sampling unit for audit procedures 2-5 is a line item,or the date the prelisting of cash receipts is prepared. The primaryemphasis in the test is the completeness objective and auditprocedure 2 indicates there is a prelisting of cash receipts. All otherprocedures can be performed efficiently and effectively by using theprelisting.c. The attributes for testing are as follows:d. The sample sizes for each attribute are as follows:15-28a. Because the sample sizes under nonstatistical sampling are determined using auditor judgment, students’ answers to thisquestion will vary. They will most likely be similar to the samplesizes chosen using attributes sampling in part b. The importantpoint to remember is that the sample sizes chosen should reflectthe changes in the four factors (ARACR, TER, EPER, andpopulation size). The sample sizes should have fairly predictablerelationships, given the changes in the four factors. The followingreflects some of the relationships that should exist in student’ssample size decisions:SAMPLE SIZE EXPLANATION1. 90 Given2. > Column 1 Decrease in ARACR3. > Column 2 Decrease in TER4. > Column 1 Decrease in ARACR (column 4 is thesame as column 2, with a smallerpopulation size)5. < Column 1 Increase in TER-EPER6. < Column 5 Decrease in EPER7. > Columns 3 & 4 Decrease in TER-EPERb. Using the attributes sampling table in Table 15-8, the sample sizesfor columns 1-7 are:1. 882. 1273. 1814. 1275. 256. 187. 149c.d. The difference in the sample size for columns 3 and 6 result from the larger ARACR and larger TER in column 6. The extremely large TER is the major factor causing the difference.e. The greatest effect on the sample size is the difference between TER and EPER. For columns 3 and 7, the differences between the TER and EPER were 3% and 2% respectively. Those two also had the highest sample size. Where the difference between TER and EPER was great, such as columns 5 and 6, the required sample size was extremely small.Population size had a relatively small effect on sample size.The difference in population size in columns 2 and 4 was 99,000 items, but the increase in sample size for the larger population was marginal (actually the sample sizes were the same using the attributes sampling table).f. The sample size is referred to as the initial sample size because it is based on an estimate of the SER. The actual sample must be evaluated before it is possible to know whether the sample is sufficiently large to achieve the objectives of the test.15-29 a.* Students’ answers as to whether the allowance for sampling error risk is sufficient will vary, depending on their judgment. However, they should recognize the effect that lower sample sizes have on the allowance for sampling risk in situations 3, 5 and 8.b. Using the attributes sampling table in Table 15-9, the CUERs forcolumns 1-8 are:1. 4.0%2. 4.6%3. 9.2%4. 4.6%5. 6.2%6. 16.4%7. 3.0%8. 11.3%c.d. The factor that appears to have the greatest effect is the number ofexceptions found in the sample compared to sample size. For example, in columns 5 and 6, the increase from 2% to 10% SER dramatically increased the CUER. Population size appears to have the least effect. For example, in columns 2 and 4, the CUER was the same using the attributes sampling table even though the population in column 4 was 10 times larger.e. The CUER represents the results of the actual sample whereas theTER represents what the auditor will allow. They must be compared to determine whether or not the population is acceptable.15-30a. and b. The sample sizes and CUERs are shown in the following table:a. The auditor selected a sample size smaller than that determinedfrom the tables in populations 1 and 3. The effect of selecting asmaller sample size than the initial sample size required from thetable is the increased likelihood of having the CUER exceed theTER. If a larger sample size is selected, the result may be a samplesize larger than needed to satisfy TER. That results in excess auditcost. Ultimately, however, the comparison of CUER to TERdetermines whether the sample size was too large or too small.b. The SER and CUER are shown in columns 4 and 5 in thepreceding table.c. The population results are unacceptable for populations 1, 4, and 6.In each of those cases, the CUER exceeds TER.The auditor's options are to change TER or ARACR, increase the sample size, or perform other substantive tests to determine whether there are actually material misstatements in thepopulation. An increase in sample size may be worthwhile inpopulation 1 because the CUER exceeds TER by only a smallamount. Increasing sample size would not likely result in improvedresults for either population 4 or 6 because the CUER exceedsTER by a large amount.d. Analysis of exceptions is necessary even when the population isacceptable because the auditor wants to determine the nature andcause of all exceptions. If, for example, the auditor determines thata misstatement was intentional, additional action would be requiredeven if the CUER were less than TER.15-30 (Continued)e.15-31 a. The actual allowance for sampling risk is shown in the following table:b. The CUER is higher for attribute 1 than attribute 2 because the sample sizeis smaller for attribute 1, resulting in a larger allowance for sampling risk.c. The CUER is higher for attribute 3 than attribute 1 because the auditorselected a lower ARACR. This resulted in a larger allowance for sampling risk to achieve the lower ARACR.d. If the auditor increases the sample size for attribute 4 by 50 items and findsno additional exceptions, the CUER is 5.1% (sample size of 150 and three exceptions). If the auditor finds one exception in the additional items, the CUER is 6.0% (sample size of 150, four exceptions). With a TER of 6%, the sample results will be acceptable if one or no exceptions are found in the additional 50 items. This would require a lower SER in the additional sample than the SER in the original sample of 3.0 percent. Whether a lower rate of exception is likely in the additional sample depends on the rate of exception the auditor expected in designing the sample, and whether the auditor believe the original sample to be representative.15-32a. The following shows which are exceptions and why:b. It is inappropriate to set a single acceptable tolerable exception rate and estimated population exception rate for the combined exceptions because each attribute has a different significance tothe auditor and should be considered separately in analyzing the results of the test.c. The CUER assuming a 5% ARACR for each attribute and a sample size of 150 is as follows:15-32 (continued)d.*Students’ answers will most likely vary for this attribute.e. For each exception, the auditor should check with the controller todetermine an explanation for the cause. In addition, the appropriateanalysis for each type of exception is as follows:15-33a. Attributes sampling approach: The test of control attribute had a 6% SER and a CUER of 12.9%. The substantive test of transactionsattribute has SER of 0% and a CUER of 4.6%.Nonstatistical sampling approach: As in the attributes samplingapproach, the SERs for the test of control and the substantive testof transactions are 6% and 0%, respectively. Students’ estimates ofthe CUERs for the two tests will vary, but will probably be similar tothe CUERs calculated under the attributes sampling approach.b. Attributes sampling approach: TER is 5%. CUERs are 12.9% and4.6%. Therefore, only the substantive test of transactions resultsare satisfactory.Nonstatistical sampling approach: Because the SER for the test ofcontrol is greater than the TER of 5%, the results are clearly notacceptable. Students’ estimates for CUER for the test of controlshould be greater than the SER of 6%. For the substantive test oftransactions, the SER is 0%. It is unlikely that students will estimateCUER for this test greater than 5%, so the results are acceptablefor the substantive test of transactions.c. If the CUER exceeds the TER, the auditor may:1. Revise the TER if he or she thinks the original specificationswere too conservative.2. Expand the sample size if cost permits.3. Alter the substantive procedures if possible.4. Write a letter to management in conjunction with each of theabove to inform management of a deficiency in their internalcontrols. If the client is a publicly traded company, theauditor must evaluate the deficiency to determine the impacton the auditor’s report on internal control over financialreporting. If the deficiency is deemed to be a materialweakness, the auditor’s report on internal control wouldcontain an adverse opinion.In this case, the auditor has evidence that the test of control procedures are not effective, but no exceptions in the sample resulted because of the breakdown. An expansion of the attributestest does not seem advisable and therefore, the auditor shouldprobably expand confirmation of accounts receivable tests. Inaddition, he or she should write a letter to management to informthem of the control breakdown.d. Although misstatements are more likely when controls are noteffective, control deviations do not necessarily result in actualmisstatements. These control deviations involved a lack ofindication of internal verification of pricing, extensions and footingsof invoices. The deviations will not result in actual errors if pricing,extensions and footings were initially correctly calculated, or if theindividual responsible for internal verification performed theprocedure but did not document that it was performed.e. In this case, we want to find out why some invoices are notinternally verified. Possible reasons are incompetence,carelessness, regular clerk on vacation, etc. It is desirable to isolatethe exceptions to certain clerks, time periods or types of invoices.Case15-34a. Audit sampling could be conveniently used for procedures 3 and 4 since each is to be performed on a sample of the population.b. The most appropriate sampling unit for conducting most of the auditsampling tests is the shipping document because most of the testsare related to procedure 4. Following the instructions of the auditprogram, however, the auditor would use sales journal entries asthe sampling unit for step 3 and shipping document numbers forstep 4. Using shipping document numbers, rather than thedocuments themselves, allows the auditor to test the numericalcontrol over shipping documents, as well as to test for unrecordedsales. The selection of numbers will lead to a sample of actualshipping documents upon which tests will be performed.。
ACCA P5 Summary

1Introduction to strategic management accounting1.1I ntroduction to planning, control and decision making☞Strategic planning is the process of deciding on objectives of the organization, on changes in these objectives, on the resource to attain these objectives, and on the policies that are to govern the acquisition, use and disposition of these resources.☞Characteristics of strategic information⏹Long term and wide scope⏹Generally formulated in writing⏹Widely circulated广泛流传⏹Doesn’t trigger direct action, but series of lesser plans⏹Includes selection of products, purchase of non-current assets, required levels ofcompany profit☞Management control: the process by which management ensure that resources are obtained and used effectively and efficiently in the accomplishment of the organisation’s objectives. It is sometimes called tactics ad tactical planning.☞Characteristics of management accounting information⏹Short-term and non-strategic⏹Management control planning activities include preparing annual sales budget⏹Management control activities include ensuring budget targets are reached⏹Carried out in a series of routine and regular planning and comparison procedures⏹Management control information covers the whole organisation, is routinely collected,is often quantitative and commonly expressed in money terms (cash flow forecasts, variance analysis reports, staffing levels⏹Source of information likely to be endogenous内生的☞Characteristics of operational control⏹Short-term and non-strategic⏹Occurs in all aspects of an organisations activities and need for day to dayimplementation of plans⏹Often carried out at short notice⏹Information likely to have an endogenous source, to be detailed transaction data,quantitative and expressed in terms of units/hours⏹Includes customer orders and cash receipts.1.2Management accounting information for strategic planning and control☞Strategic management accounting is a form of management accounting in which emphasis is placed on information about factors which are external to the organisation, as well as non-financial and internally-generated information.⏹External orientation: competitive advantage is relative; customer determination⏹Future orientation: forward- and outward looking; concern with values.⏹Goal congruence: translates the consequences of different strategies into a commonaccounting language for comparison; relates business operations to financial performance.1.3Planning and control at strategic and operational levels☞Linking strategy and operations, if not: unrealistic plans, inconsistent goals, poor communication, inadequate performance measurement.1.3.1Strategic control systems☞Formal systems of strategic control:⏹strategy review;⏹identify milestones of performance( outline critical success factors, short-term stepstowards long-term goals, enables managers to monitor actions)⏹Set target achievement levels (targets must be reasonably precise, suggest strategiesand tactics, relative to competition)⏹Formal monitoring of the strategic process⏹Reward.☞Desired features of strategic performance measures⏹Focus on what matters in the long term⏹Identify and communicate drivers of success⏹Support organisational learning⏹Provide a basis for reward⏹Measurable; meaningful; acceptable;⏹Described by strategy and relevant to it⏹Consistently measured⏹Re-evaluated regularly1.4Benchmarking1.4.1Types of benchmarking☞Internal benchmarking: easy; no innovative or best-practice.☞Industry benchmarking:⏹Competitor benchmarking: difficult to obtain information⏹Non-competitor benchmarking: motivate☞Functional benchmarking: find new, innovative ways to create competitive advantage1.4.2Stages of benchmarking☞Set objectives and determine the area to benchmark☞Establish key performance measures.☞Select organizations to study☞Measure own and others performance☞Compare performance☞Design and implement improvement prgoramme☞Monitor improvements1.4.3Reasons for benchmarking☞Assess current strategic position☞Assess generic competitive strategy☞Spur to innovation☞Setting objectives and targets☞Cross comparisons☞Implementing change☞Identifies the process to improve☞Helps with cost reduction, or identifying areas where improvement is required☞Improves the effectiveness of operations☞Delivers services to a defined standard☞Provide early warning of competitive disadvantage1.4.4Disadvantages of benchmarking☞Implies there is one best way of doing business☞Yesterday’s solution to tomorrow’s problem☞Catching-up exercise rather than the development of anything distinctive☞Depends on accurate information about comparator companies☞Potential negative side effects of ‘what gets measured gets done’.2Performance management and control of the organization2.1Strengths and weaknesses of alternative budget models2.1.1Incremental budgeting☞Is the traditional approach to setting a budget and involves basing next year’s budget on the current year’s results plus an extra amount for estimated growth of inflation next year. ☞Strengths: easy to prepare; can be flexed to actual levels to provide more meaningful control information☞Weaknesses: does not take account of alternative options; does not look for ways of improving performance; only works if current operations are as effective, efficient and economical as they can be; encourage slack in the budget setting process.2.1.2Zero based budgeting☞Preparing a budget for each cost centre from scratch.☞Strengths:⏹Provides a budgeting and planning tool for management that responds to changes inthe business environment.⏹Requires the organization to look very closely at its cost behavior patterns, andimproves understanding of cost-behaviour patterns.⏹Should help identify inefficient or obsolete processes, and thereby also help reducecosts.⏹Results in a more efficient allocation of resources⏹Be particularly useful in not-for-profit organizations which have a focus on achievingvalue for money.☞Weaknesses:⏹Requires a lot of management time and effort⏹Requires training in the use of ZBB techniques so that these are applied properly⏹Questioning current practices and processes can be seen as threatening2.1.3Rolling budgets☞Continuously updated by adding a further period when the earliest period has expired.☞Strengths:⏹Reduce the uncertainty of budgeting for business operating in an unstableenvironment. It is easier to predict what will happen in the short-term.⏹Most suitable form of budgeting for organizations in uncertain environments, wherefuture activity levels, costs or revenues cannot be accurately foreseen.⏹Planning and control is based on a more recent plan which is likely to be morerealistic an more relevant than a fixed annual budget drawn up several months ago.⏹The process of updating the budget means that managers identify current changes( and so can respond to these changes more quickly)⏹More realistic targets provide a better basis on which to appraise managers’performance⏹Realistic budgets are likely to have a better motivational effect on managers.☞Weaknesses:⏹Require time, effort and money to prepare and keep updating. If managers spend toolong preparing/revising budgets, they will have less time to control and manage actual results⏹Managers may not see the value in the continuous updating of budgets⏹May be demotivating if targets are constantly changing⏹It may not be necessary to update budgets so regularly in a stable operatingenvironment.2.1.4Flexible budgets☞Recognizing the potential uncertainty, budgets designed to adjust costs levels according to changes in the actual levels of activity and output.☞Strengths:⏹Finding out well in advance the costs of idle time and so on if the output falls belowbudget.⏹Being able to plan for the alternative use of spare capacity if output falls short ofbudget☞Weaknesses:⏹As many errors in modern industry are fixed costs, the value of flexible budgets as aplanning tool are limited.⏹Where there is a high degree of stability, the administrative effort in flexiblebudgeting produces little extra benefit. Fixed budgets can be perfectly adequate in these circumstances.2.1.5Activity based budgeting☞Involves defining the activities that underlie the financial figures in each function and usingthe level of activity to decide how much resources should be allocated, how well it is being managed and to explain variance from budget.☞Strengths:⏹Ensures that the organisation’s overall strategy and any changes to that strategy willbe taken into account.⏹Identifies critical success factors which are activities that a business must perform wellif it is to succeed⏹Recognizes that activities drive costs; so encourages a focus on controlling andmanaging cost drivers rather than just the costs⏹Concentrate on the whole activities so that there is more likelihood of getting it rightfirst time.☞Weaknesses:⏹Requires time and effort to prepare so suited to a more complex organization withmultiple cost drivers.⏹May be difficult to identify clear individual responsibilities for activities⏹Only suitable for organization which have adopted an activity-based costing system⏹ABBs are not suitable for all organization, especially with significant proportions offixed overheads.2.1.6The future of budgeting☞Criticisms of traditional budgeting⏹Time consuming and costly⏹Major barrier to responsiveness, flexibility and change⏹Adds little value given the amount of management time required⏹Rarely strategically focused⏹Makes people feel undervalued⏹Reinforces department barriers rather than encouraging knowledge sharing⏹Based on unsupported assumptions and guesswork as opposed to sound,well-constructed performance data⏹Development and updated infrequently2.2Budgeting in not-for-profit organizations☞Special issues: the budget process inevitably has considerable influence on organizational processes, and represents the financial expression of policies resulting from politically motivated goals and objectives. The reality of life for many public sector managers is an subjected to(受---支配) growing competition.⏹Be prevented from borrowing funds⏹Prevent the transfer of funds from one budget head to another without compliancewith various rules and regulations⏹Plan one financial year.⏹Incremental budgeting and the bid system are widely used.2.3Evaluating the organisation’s move beyond budgeting2.3.1Conventional budgeting in a changing environment☞Weaknesses of traditional budgets:⏹Adds little value, requires far too much valuable management time⏹Too heavy a reliance on the ‘agreed’ budget has an adverse impact on managementbehavior, which can become dysfunctional(功能失调的) with regard to(关于) the objectives of the organization as a whole⏹The use of budgeting as a base for communicating corporate goals, is contrary to theoriginal purpose of budgeting as a financial control mechanism⏹Most budgets are not based on a rational, causal(因果关系的) model of resourceconsumption, but are often the result of protracted internal bargaining processes.⏹Conformance to budget is not seen as compatible with a drive towards continuousimprovement⏹Traditional budgeting processes have insufficient external focus.2.3.2The beyond budgeting model☞Rolling budgets focus management attention on current and likely future realities within the organizational context, it is seen as an attempt to keep ahead of change, or strictly speaking to be more in control of the response to the challenges facing the organization. ☞Benefits:⏹Creates and fosters a performance climate based on competitive success. Managerialfocus shifts from beating other managers for a slice(部分) of resources to beating the competition.⏹It motivates properly by giving them challenges, responsibilities and clear values asguidelines. Rewards are team-based⏹It empowers operational managers to act by removing resource constraints. Speedingup the response to environmental threats and enabling quick exploitation of new opportunities.⏹It devolves performance responsibilities to operational management who are closer tothe action.⏹It establishes customer-orientated teams that are accountable for profitable customeroutcomes.⏹Creates transparent and open information systems throughout the organization,provides fast, open and distributed information to facilitate control at all levels.3Business structure, IT development and other environmental and ethical issues3.1Business structure and information needs3.1.1Functional departmentation☞Information characteristics and needs: information flows vertically; functions tend to be isolated☞Implications for performance management⏹Structure is based on work specialism⏹Economies of scale⏹Does not reflect the actual business processes by which values is created⏹Hard to identify where profits and losses are made on individual products or inindividual markets⏹People do not have an understanding of how the whole business works⏹Problems of co-ordinating the work of different specialisms.3.1.2The divisional form☞Information characteristics and needs⏹Divisionalisation is the division of a business into autonomous regions⏹Communication between divisions and head office is restricted, formal and related toperformance standards⏹Headquarters management influence prices and therefore profitability when it setstransfer prices between divisions.⏹Divisionalisation is a function of organisation size, in numbers and in product-marketactivities.☞Implications for performance management⏹Divisional management should be free to use their authority to do what they think isright, but must be held accountable to head office⏹ A division must be large enough to support the quantity and quality of managementit needs⏹Each division must have a potential for growth in its own area of operations⏹There should be scope and challenge in the job for the management of the division☞Advantages:⏹Focuses the attention of subordinate(下级) management on business performanceand results⏹Management by objectives can be applied more easily⏹Gives more authority to junior managers, more senior positions⏹Tests junior managers in independent command early in their careers and at areasonably low level in the management hierarchy.⏹Provides an organisation structure which reduces the number of levels ofmanagement.☞Problems:⏹Partly insulated from shareholders and capital markets⏹The economic advantages it offers over independent organisations ‘reflectfundamental inefficiencies in capital markets’⏹The divisions are more bureaucratic than they would be as independent corporation⏹Headquarters management usurp divisional profits by management charges,cross-subsidies, unfair transfer pricing systems.⏹Sometime, it is impossible to identify completely independent products or markets⏹Divisionalisation is only possible at a fairly senior management level⏹Halfway house(中途地点)⏹Divisional performance is not directly assessed by the market⏹Conglomerate diversification3.1.3Network organisations☞Information characteristics and needs: achieve innovative response in a changingcircumstances; communication tends to be lateral(侧面的), information and advice are given rather than instructions(指令) and decisions.☞Virtual teams: share information and tasks; make joint decision; fulfil the collaborative function of a team)☞Implications for performance management⏹Staffing: shamrock organisation⏹Leasing of facilities such as IT, machinery and accommodation(住房)⏹Production itself might be outsourced⏹Interdependence of organisations☞Benefits: cost reduction; increased market penetration; experience curve effects.3.2Business process re-engineering3.2.1Business processes and the technological interdependence betweendepartments☞Pooled interdependence(联营式相互依赖): each department works independently to the others, subjects to achieve the overall goals☞Sequential interdependence(序列式相互依存): a sequence with a start and end point.Management effort is required to ensure than the transfer of resources between departments is smooth.☞Reciprocal interdependence(互惠式相互依存): a number of departments acquire inputs from and offer outputs to each other.3.2.2Key characteristics of organisations which have adopted BPR☞Work units change from functional departments to process teams, which replace the old functional structure☞Jobs change. Job enlargement and job enrichment☞People’s roles change. Make decisions relevant to the process☞Performance measures concentrate on results rather than activities.☞Organisation structures change from hierarchical to flat3.3Business integration3.3.1Mckinsey 7S model☞Hard elements of business behaviour⏹Structure: formal division of tasks; hierarchy of authority⏹Strategy: plans to outperform胜过its competitors.⏹Systems: technical systems of accounting, personnel, management information☞‘soft’ elements⏹Style: shared assumptions, ways of working, attitudes and beliefs⏹Shared values: guiding beliefs of people in the organisation as to why it exists⏹Staff: people⏹Skills: those things the organisation does well3.3.2Teamwork and empowerment☞Aspects of teams:⏹Work organisation: combine the skills of different individuals and avoid complexcommunication⏹Control: control the behaviour and performance of individuals, resolve conflict⏹Knowledge generation: generate ideas⏹Decision making: investigate new developments, evaluate new decisions☞Multi-disciplinary teams:⏹Increases workers‘ awareness of their overall objectives and targets⏹Aids co-ordination⏹Helps to generate solutions to problems, suggestions for improvements☞Changes to management accounting systems⏹Source of input information: sources of data, methods used to record data⏹Processing involved: cost/benefit calculation⏹Output required: level of detail and accuracy of output, timescales involved⏹Response required:⏹When the output is required:3.4Information needs of manufacturing and service businesses3.4.1Information needs of manufacturing businesses☞Cost behaviour:⏹Planning: standard costs, actual costs compared with⏹Decision making: estimates of future costs to assess the likely profitability of a product⏹Control: monitor total cost information☞Quality: the customer satisfaction is built into the manufacturing system and its outputs☞Time: production bottlenecks, delivery times, deadlines, machine speed☞Innovation: product development, speed to market, new process. Experience curve, economies of scale, technological improvements.☞Valuation:☞Strategic, tactical and operational information⏹Strategic: future demand estimates, new product development plans, competitoranalysis⏹Tactical: variance analysis, departmental accounts, inventory turnover⏹Operational: production reject rates, materials and labour used, inventory levels3.4.2Service businesses☞Characteristics distinguish from manufacturing:⏹Intangibility: no substance⏹Inseparability/simultaneity: created at the same time as they are consumed⏹Variability/heterogeneity异质性: problem of maintaining consistency in the standardof output⏹Perishability非持久性:⏹No transfer of ownership:☞Strategic, tactical and operational information⏹Strategic: forecast sales growth and market share, profitability, capital structure⏹Tactical: resource utilisation, customer satisfaction rating⏹Operational: staff timesheets, customer waiting time, individual customer feedback3.5Developing management accounting systems3.5.1Setting up a management accounting system☞The output required: identify the information needs of managers☞When the output is required:☞The sources of input information: the output required dictate the input made3.6Stakeholders’ goals and objectives3.6.1The stakeholder view☞Organisations are rarely controlled effectively by shareholders☞Large corporations can manipulate markets. Social responsibility☞Business receive a lot of government support☞Strategic decisions by businesses always have wider social consequences.3.6.2Stakeholder theory☞Strong stakeholder view: each stakeholder in the business has a legitimate claim on management attention. Management’s job is to balance stakeholder demands:⏹Managers who are accountable to everyone are accountable to none⏹Danger of the managers favour their own interests⏹Confuses a stakeholder’s interest in a firm with a person citizenship of a state⏹People have interest, but this does not give them rights.3.7Ethics and organisation3.7.1Short-term shareholder interest(laissez-faire自由主义stance)☞Accept a duty of obedience to the demands of the law, but would not undertake to comply with any less substantial rules of conduct.3.7.2Long-term shareholder interest (enlightened self-interest开明自利)☞The organisation’s corporate image may be enhanced by an assumption of wider responsibilities.☞The responsible exercise of corporate power may prevent a built-up of social and political pressure for legal regulation.3.7.3Multiple stakeholder obligations☞Accept the legitimacy of the expectations of stakeholders other than shareholders. It is important to take account of the views of stakeholders with interests relating to social and environmental matters.☞Shape of society: society is more important than financial and other stakeholder interests.3.7.4Ethical dilemmas☞Extortion: foreign officials have been known to threaten companies with the complete closure of their local operations unless suitable payments are made☞Bribery: payments for service to which a company is not legally entitled☞Grease money: cash payments to the right people to oil the machinery of bureaucracy.☞Gifts: are regard as an essential part of civilised negotiation.4Changing business environment and external factors4.1The changing business environment4.1.1The changing competitive environment☞Manufacturing organisations:⏹Before 1970s, domestic markets because of barriers of communication andgeographical distance, few efforts to maximise efficiency and improve management practices.⏹After 1970s, overseas competitors, global networks for acquiring raw materials anddistributing high-quality, low-priced goods.☞Service organisations:⏹Prior to the 1980s: service organisations were government-owned monopolies, wereprotected by a highly-regulated, non-competitive environment.⏹After 1980s: privatisation of government-owned monopolies and deregulation, intensecompetition, led to the requirement of cost management and management accounting information systems.☞Changing product life cycles: competitive environment, technological innovation, increasingly discriminating and sophisticated customer demands.☞Changing customer requirements: Cost efficiency, quality (TQM), time (speedier response to customer requests), innovation☞New management approaches: continuous improvement, employee empowerment; total value-chain analysis☞Advanced manufacturing technology(AMT): encompasses automatic production technology, computer-aided design and manufacturing, flexible manufacturing systems and a wide array of innovative computer equipment.4.1.2The limitation of traditional management accounting techniques in achanging environment☞Cost reporting: costs are generally on a functional basis, the things that businesses do are “process es’ that cut across functional boundaries☞Absorption costing(归纳成本计算法)☞Standard costing: ignores the impact of changing cost structures; doesn’t provide any incentive to try to reduce costs further, is inconsistent with the philosophy of continuous improvement.☞Short-term financial measures: narrowly focused☞Cost accounting methods: trace raw materials to various production stages via WIP. With JIT systems, near-zero inventories, very low batch sizes, cost accounting and recording systems are greatly simplified.☞Performance measures: product the wrong type of response☞Timing: cost of a product is substantially determined when it is being designed, however, management accountants continue to direct their efforts to the production stage.☞Controllability: only a small proportion of ‘direct costs’are genuinely controllable in the short term.☞Customers: many costs are driven by customers, but conventional cost accounting does not recognise this.☞The solution: changes are taking place in management accounting in order to meet the challenge of modern developments.4.2Risk and uncertainty4.2.1Types of risk and uncertainty☞Physical: earthquake, fire, blooding, and equipment breakdown. Climatic changes: global warming, drought;☞Economic: economic environment turn out to be wrong☞Business: lowering of entry barriers; changes in customer/supplier industries; new competitors and factors internal to the firm; management misunderstanding of core competences; volatile cash flows; uncertain returns☞Product life cycle:☞Political: nationalisation, sanctions, civil war, political instability☞Financial:4.2.2Accounting for risk☞Quantify the risk:⏹Rule of thumb methods: express a range of values from worst possible result to bestpossible result with a best estimate lying between these two extremes.⏹Basic probability theory: expresses the likelihood of a forecast result occurring⏹Dispersion or spread values with different possible outcomes: standard deviation.4.2.3Basic probability theory and expected valuesEV=ΣpxP=the probability of an outcome occurringX=the value(profit or loss) of that outcome4.2.4Risk preference☞Risk seeker: is a decision maker who is interested trying to secure the best outcomes no matter how small the chance they may occur☞Risk neutral: a decision maker is concerned with what will be the most likely outcome☞Risk averse: a decision maker acts on the assumption that the worst outcome might occur ☞Risk appetite is the amount of risk an organisation is willing to take on or is prepared to accept in pursuing its strategic objectives.4.2.5Decision rules☞Maximin decision rule: select the alternative that offers the least unattractive worst outcome. Maximise the minimum achievable profit.⏹Problems: risk-averse approach, lead to defensive and conservative, without takinginto account opportunities for maximising profits⏹Ignores the probability of each different outcome taking place☞Maximax: looking for the best outcome. Maximise the maximum achievable profit⏹It ignores probabilities;⏹It is over-optimistic☞Minimax regret rule: minimise the regret from making the wrong decision. Regret is the opportunity lost through making the wrong decision⏹Regret for any combination of action and circumstances=profit for best action in shoescircumstances – profit for the action actually chosen in those circumstances4.3Factors to consider when assessing performance4.3.1Political factors☞Government policy; government plans for divestment(剥夺)/rationalisation; quotas, tariffs, restricting investment or competition; regulate on new products.☞Government policy affecting competition: purchasing decisions; regulations and control;policies to prevent the concentration of too much market share in the hands of one or two producers4.3.2Economic environment☞Gross domestic product: grown or fallen? Affection on the demand of goods/services☞Local economic trends: businesses rationalising or expanding? Rents increasing/falling?The direction of house prices moving? Labour rates☞Inflation: too high to making a plan, uncertain of future financial returns; too low to depressing consumer demand; encouraging investment in domestic industries; high rate leading employees to demand higher money wages to compensate for a fall in the value of their wages☞Interest rates: affect consumer confidence and liquidity, demand; cost of borrowing increasing, reducing profitability;☞Exchange rates: impact on the cost of overseas imports; prices affect overseas customers ☞Government fiscal policy: increasing/decreasing demands; corporate tax policy affecting on the organisation; sales tax(VAT) affecting demand.☞Government spending:☞Business cycle: economic booming or in recession; counter-cyclical industry; the forecast state of the economic4.3.3Funding☞Reasons for being reluctant to obtain further debt finance:⏹Fear the company can’t service the debt, make the required capital and interestpayments on time⏹Can’t use the tax shield, to obtain any tax benefit from interest payments⏹Lacks the asset base to generate additional cash if needed or provide sufficientsecurity⏹Maintain access to the capital markets on good terms.4.3.4Socio-cultural factors☞Class: different social classes have different values。
亨格瑞管理会计英文第15版练习答案解析
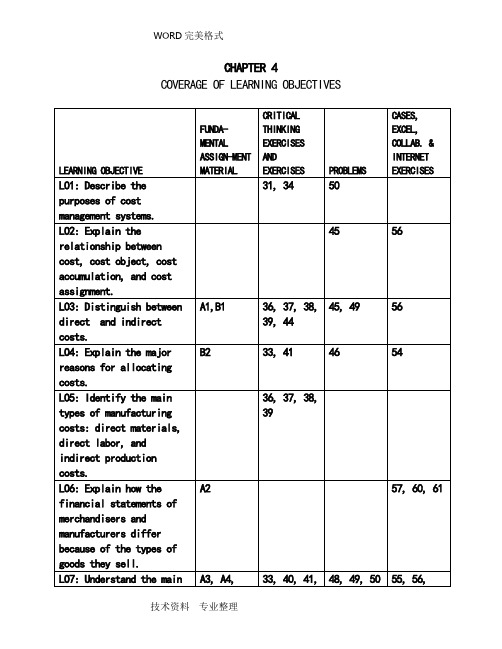
CHAPTER 4 COVERAGE OF LEARNING OBJECTIVESCHAPTER 4Cost Management Systems and Activity-Based Costing4-A1 (20-30 min.)See Table 4-A1 on the following page.4-A2 (25-30 min.)1. Merchandise Inventories, 1,000 devices @ $97 $97,0002. Direct materials inventory $ 40,000Work-in-process inventory 0 Finished goods inventory 97,000 Total inventories $137,000 3.NILE ELECTRONICS PRODUCTSStatement of Operating IncomeFor the Year Ended December 31, 20X9Sales (9,000 units at $170) $1,530,000 Cost of goods sold:Beginning inventory $ 0Purchases 970,000Cost of goods available for sale $ 970,000Less ending inventory 97,000Cost of goods sold (an expense) 873,000 Gross margin or gross profit $ 657,000 Less other expenses: selling & administrative costs 185,000 Operating income (also income before taxesin this example) $ 472,000TABLE 4-A1STATEMENT OF OPERATING INCOME OPERATING INCOME BY PRODUCT LINEEXTERNAL REPORTING PURPOSE INTERNAL STRATEGIC DECISION MAKING PURPOSECustom Large SmallDetailed Std. Std. Cost Type, Assignment Method Sales $155,000 $30,000 $45,000 $80,000Cost of goods sold:Direct material 40,000 5,000 15,000 20,000 Direct, Direct TraceIndirect manufacturing 41,000 28,0001 5,000 8,000 Indirect, Alloc. – Mach. Hours81,000 33,000 20,000 28,000Gross profit 74,000 (3,000) 25,000 52,000Selling and administrative expenses:Commissions 15,000 1,500 3,500 10,000 Direct, Direct Trace Distribution to warehouses 10,400 1,0002 3,000 6,400 Indirect, Allocation - Weight Total selling and admin. expenses 25,400 2,500 6,500 16,400Contribution to corporate expensesand profit 48,600 $(5,500) $18,500 $35,600Unallocated expenses:Administrative salaries 8,000Other administrative expenses 4,000Total unallocated expenses 12,000Operating income before tax $ 36,6001 Total machine hours is 1,400 + 250 + 400 = 2,050. Indirect manufacturing cost per machine hour is then $41,000 ÷ 2,050 = $20. The al location to custom detailed is $20 × 1,400 machine hours = $28,000.2 Total weight shipped is 25,000 kg + 75,000 kg + 160,000 kg = 260,000 kg. Indirect distribution costs per kilogram is then $10,400 ÷ 260,000 kg = $0.04. The allocation to custom detailed is $0.04 × 25,000 kg = $1,000.技术资料专业整理4. ORINOCO, INC.Statement of Operating IncomeFor the Year Ended December 31, 20X9Sales (9,000 units at $170)$1,530,000Cost of goods manufactured and sold:Beginning finished goods inventory $ 0Cost of goods manufactured:Beginning WIP inventory $ 0Direct materials used 530,000Direct labor 290,000Indirect manufacturing 150,000Total mfg. costs to account for $970,000Less ending work-in-process inventory 0 970,000Cost of goods available for sale $970,000Less ending finished goods inventory 97,000Cost of goods sold (an expense) 873,000Gross margin or gross profit $ 657,000 Less other expenses: selling and administrative costs 185,000Operating income (also income before taxesin this example) $ 472,0005. The balance sheet for the merchandiser (Nile) has just one line forinventories, the ending inventory of the items purchased for resale.The balance sheet for the manufacturer (Orinoco) has three items:direct materials inventory, work-in-process inventory, and finishedgoods inventory.The income statements are similar except for the computation of cost of goods available for sale. The merchandiser (Nile) simply showspurchases for the year plus beginning inventory. In contrast, themanufacturer (Orinoco) shows beginning work-in-process inventory plusthe three categories of cost that comprise manufacturing cost (directmaterials used, direct labor, and factory (or manufacturing) overhead)and then deducts the ending work-in-process inventory. The manufacturer then adds the beginning finished goods inventory to this cost of goodsmanufactured to get the cost of goods available for sale.6. The purpose is providing aggregate measures of inventory value and costof goods manufactured for external reporting to investors, creditors,and other external stakeholders.4-A3 (10-15 min.)There can be many justifiable answers for each item other than thelisted cost driver and behavior. The purpose of this exercise is togenerate an active discussion regarding those chosen by First Bank’smanagers. One point that should be emphasized is that many timesmanagers choose cost drivers that are not the most plausible or reliable because of lack of data availability. Cost drivers are also used as abasis to allocate activity and resource costs and so the availability of data is often an important consideration.ActivityOr CostResource Cost Driver Behaviora.* R Number of square feet Fb.** R Number of person hours Fc. R Number of computer transactions Vd. A Number of schedulese. R Number of person hours Ff. R Number of loan inquiries Vg.*** A Number of investmentsh. A Number of applicationsi. R Number of person hours Vj. R Number of minutes Vk. R Number of person hours Fl. A Number of loans* An argument can be made that maintenance of the building is an activity.If this was the case, resources such as supplies and labor would be resources consumed, and several resource cost drivers would be needed. In addition, a separate resource and associated cost driver would be needed for insurance costs. However, the company had a contract for maintenance (fixed price), so this was a fixed-cost resource that was added to other occupancy costs such as insurance. The cost driver chosen for all these occupancy costs was square feet occupied by the various departments.** Normally, the cost driver used for any labor resource is person hours.It is assumed that the staff person hours used are regular hours rather than overtime or temporary labor hours. Thus, the cost is fixed with respect to changes in hours used. As the hours used increases (decreases) theutilization of the resources increases (decreases) and eventually, management will need to make a decision whether to expand capacity (or whether to cutback on labor). This is an example of a step cost that is fixed over wideranges of cost-driver level.*** Students may try to determine the cost behavior of activities even thoughthe problem requirements do not ask for it. Point out that activities almostalways have mixed cost behavior because they consume various resources. Someof these are fixed-cost and others variable-cost resources. For example, theactivity “research to evaluate a loan application” consumes such fixed-costresources as manager labor time and computers (assumed owned by the bank).This activity also consumes variable-cost resources such as telecommunicationstime and external computing services.4-A4 (20-30 min.)1. The first step is to determine the cost per cost-driver unit for eachactivity:Monthly Cost- Cost perManufacturing Driver DriverActivity [Cost driver] Overhead Activity UnitMaterial Handling [Direct materials cost] $12,000 $200,000$ 0.06Engineering [Engineering change notices] 20,000 20 1,000.00Power [Kilowatt hours] 16,000 400,000 0.04Total Manufacturing Overhead $48,000Next, the costs of each activity can be allocated to each of the threeproducts:PHYSICAL FLOW / ALLOCATED COSTCost Senior Basic DeluxeMaterial Handling$.06 × 25,000 = $1,500$.06 × 50,000 = $ 3,000$.06 × 125,000 = $ 7,5 Engineering $1,000 × 13 = 13,000$1,000 × 5 = 5,000$1,000 × 2 = 2,000Power $.04 × 50,000 = 2,000$.04 × 200,000 = 8,000$.04 × 150,000 = 6,000 Total $16,500 $16,000 $15,5002. Overhead rate based on direct labor costs:Rate = Total manufacturing overhead ÷ Total direct labor cost= $48,000 ÷ $8,000 = $6.00/DL$Overhead allocated to each product is:Senior: $6.00 × 4,000 = $24,000Basic: $6.00 × 1,000 = 6,000Deluxe: $6.00 × 3,000 = 18,000Total $48,000Notice that much less manufacturing overhead cost is allocated to Basic using direct labor as a cost driver. Why? Because Basic uses only asmall amount of labor but large amounts of other resources, especially power.3. The product costs in requirement 1 are more accurate if the costdrivers are good indicators of the causes of the costs -- they are both plausible and reliable. For example, kilowatt hours is certainly abetter measure of the cost of power costs than is direct labor hours.Therefore, the allocation of power costs in requirement 1 is certainly better than in requirement 2. Materials handling and engineering arelikewise more plausible. A manager would be much more confident in the manufacturing overhead allocated to products in requirement 1.Remember, however, that there are incremental costs of data collection associated with the more accurate ABC system. The benefit/costcriteria must be applied in deciding which costing system is “best.”4-B1 (20-30 min.)See Table 4-B1 on the following page.4-B2 (25-30 min.)1. $1,080,000 ÷ 45,000 hours = $24 per direct-labor hour2. (a) $585,000 ÷ 15,000 hours = $39 per direct-labor hour(b) $495,000 ÷ 30,000 hours = $16.50 per direct-labor hour3. (a) $585,000 ÷ 97,500 hours = $6 per machine hour(b) $495,000 ÷ 30,000 hours = $16.50 per direct-labor hour4. (a) $24 × (1.0 + 14.0) = $360.00$24 × (1.5 + 3.0) = $108.00$24 × (1.3 + 8.0) = $223.20(b) ($39 × 1.0) + ($16.50 × 14.0) = $39.00 + $231.00 = $270.00($39 × 1.5) + ($16.50 × 3.0) = $58.50 + $ 49.50 = $108.00($39 × 1.3) + ($16.50 × 8.0) = $50.70 + $132.00 = $182.70(c) ($6 × 12.0) + ($16.50 × 14.0) = $ 72.00 + $231.00 = $303.00($6 × 17.0) + ($16.50 × 3.0) = $102.00 + $ 49.50 = $151.50($6 × 14.0) + ($16.50 × 8.0) = $ 84.00 + $132.00 = $216.00(d) First consider using departmental instead of firm-wide rates (partb vs. part a). Departmental rates that use direct-labor hours asthe base decrease the cost applied to units of A and C and leave B unaffected. Other products that use relatively less assembly time will increase in cost. Now examine changing to a base of machine hours in machining (part c vs. part a). Product B is the only one with an increase in cost in (c) compared to (a). Why? Because B's uses only 16% of the direct labor hours used for A, B, and C, so it is is allocated only 16% of the costs allocated on the basis ofdirect labor hours. But it uses 40% of the machine hours, andthere is allocated 40% of costs that are allocated on the basis on machine hours. Therefore, it receives relatively more costs with a base of machine hours than with a base of direct-labor hours.TABLE 4-B1STATEMENT OF OPERATING INCOME OPERATING INCOME BY PRODUCT LINEThousands of Dollars Lawn HandScooter Mower Tool Cost Type,Parts Parts Parts Assignment Method Sales $990 $350 $380 $260Cost of goods sold:Direct material 400 175 125 100 Direct, Direct Trace Indirect manufacturing 94 68 1 14 12 Indirect – Mach.Hrs494 243 139 112Gross profit 496 107 241 148Selling and administrative expenses:Commissions 55 25 20 10 Direct, Direct Trace Distribution to warehouses 150 20 2 80 50 Indirect - Weight Total selling and administrative expenses 205 45 100 60Contribution to corporate expenses and profit 291 $ 62 $141 $ 88Unallocated expenses:Corporate salaries 11Other general expenses 17Total unallocated expenses 28Operating income before tax $2631 Total machine hours is 8,500 + 1,750 + 1,500 = 11,750. Indirect manufacturing cost per machine hour isthen $94,000 ÷ 11,750 = $8. The allocation to scooter parts is $8 × 8,500 machine hours = $68,000.2 Total weight shipped is 100,000 kg + 400,000 kg + 250,000 kg = 750,000 kg. Indirect distribution costs perkilogram is then $150,000 ÷ 750,000 kg = $0.20. The allocation to scooter parts is $0.20 × 100,000 kg = $20,000.技术资料专业整理4-B3 (30-35 min.)1.The existing system allocates all costs based on direct labor cost. The rate for allocating indirect production costs is:Estimated indirect production cost ÷ Estimated direct labor cost= ¥24,500,000 ÷ ¥35,000,000 = 70%That is, each time ¥1 is spent on direct labor, Watanabe adds ¥0.7 of indirect production cost to the cost of the product.2. Under an ABC system, Watanabe would allocate indirect production costs separately for each activity. This would result in the following four allocation rates:Receiving: Receiving co sts ÷ Direct material cost=¥4,800,000 ÷ 60,000,000 = ¥0.08 per ¥1of dir. mat. Assembly: Assembly costs ÷ Number of control units=¥13,800,000 ÷ 92,000 = ¥150 per control unitQual. Control: Quality control cost ÷ QC hours=¥1,800,000 ÷ 600 = ¥3,000 per QC hourShipping: Shipping cost ÷ # of boxes shipped=¥4,100,000 ÷ 8,200 = ¥500 per box shipped3. (a) The cost will contain 3 components (in thousands of yen):Direct material ¥ 8,000Direct labor 2,000Indirect production cost (¥2,000 × .7 = 1,400) 1,400Total cost ¥11,400Price (¥11,400 × 1.3)¥14,820(b) The cost will have 7 components, 4 of them allocating indirect production costs (totals in thousands of yen):Direct materials ¥ 8,000Direct labor 2,000Receiving (¥0.08 × 8,000)¥640Assembly (¥150 × 5,000)750Quality control (¥3,000 × 50)150Shipping (¥500 × 600) 300Total indirect production cost 1,840Total cost ¥11,840 Price (11 ,840 × 1.3)¥15,3924. The order from Nissan requires a relatively large amount of receiving, quality control, and shipping resources compared to the relative amount of labor required. This makes its indirect production costs are relatively expensive relative to the labor required. The following illustrates why an allocation on the basis of labor cost results in less costs than allocations based on the four activities:Budgeted Cost- Nissan Cost- NissanActivity Allocation Base Allocation Base Percentage Direct materials 60,000,000 8,000,000 13.3%Direct labor 35,000,000 2,000,000 5.7 Receiving 60,000,000 8,000,000 13.3 Assembly 92,000 5,000 5.4 Quality control 600 50 8.3 Shipping 8,200 600 7.3Using the single direct-labor cost-allocation base, this order would receive 5.7% of all indirect production costs. The main reason that indirect production costs for this order under the ABC system are relatively high is the large relative cost of materials that drives a large allocation (13.3%) of receiving costs to this order. The allocations of both quality control and shipping costs are slightly larger that they would be using a direct-labor cost-allocation base, while the allocation of assembly costs is slightly smaller.4-B4 (50-60 min.)1. A summary of the analyses follows.Pen Cell-PhoneCasings Casings CompanyBase Gross Profit Percentage* 1.25% 38.75% 8.07% Plan Gross Profit Percentage** 10.80% 37.20% 17.40% Support of Product Manager? Strong NoneSupport of President? Moderate* See Exhibit 4-6 on p. 136 of the text.** See Panel B of Exhibit 4-B4 that follows.Exhibit 4-B4, Panels A and B on the following pages can be used to explain the impact of the controller’s idea using the process map of the traditional costing system and the related financial reports. Notice that the $80,000 annual decrease in the cost of engineers needs to be converted to a $20,000 quarterly savings. The controller’s idea will result in an increase of 9.55%in the gross profit of the pen-casings line but a decrease of 1.55% in thecell-phone line. The product manager of pen casings would probably give strong support to the idea but the cell-phone casings manager would most likely not support the idea.Although the company-level gross profit margin improves, the president’s support may not be strong. Why? There is not a strong consensus among product-line managers. Top management is normally hesitant to support actions that do not have the unanimous support among product-line managers unless there is solid evidence of material improvement in profitability. While the current loss would be reversed, the return on sales is still nominal at 3,500 ÷ $480,000 = .73%.Exhibit 4-B4: Panel AProcess Map of Traditional Cost System[Direct Labor Hours = 4,500 +Exhibit 4-B4: Panel BPRO-FORMA FINANCIAL REPORTS:TRADITIONAL COST ALLOCATION SYSTEMSTATEMENT OF OPERTING INCOME CONTRIBUTION TO CORPORATE COSTSAND PROFIT [EXTERNAL REPORTING PURPOSE] [INTERNAL STRATEGIC DECISION MAKINGAND OPERATIONAL-CONTROL PURPOSE]Pen Casings Cell Phone CasingsSales $480,000 $360,000 $120,000 1 Cost of goods sold:Direct material 46,500 22,500 24,000 2 Direct labor 150,000 135,000 15,000Indirect manufacturing 200,000 163,636 3 36,364 4 Cost of goods sold 396,500 321,136 75,364 Gross profit 83,500 $ 38,864 $ 44,636 Corporate expenses (unallocated) 80,000Operating income $ 3,500Gross profit margin 17.40% 10.80% 37.20%1. $80,000 × .75 × 22. $12,000 × 23. $200,000 × [4,500/(4,500 + 1,000)]4. $200,000 × [1,000/(4,500 + 1,000)]5. $83,500/$480,000技术资料专业整理Perhaps the most important factor bearing on the president’s support is lack of confidence in the accuracy of the cost and hence gross margin figures. She probably will inquire whether the shift in the consumption percentages by the two activities is captured by the traditional costing system. Does the change in allocation rates from 90:10 to 82:18 based on direct labor hour changes accurately capture the impact of the operational changes? An informal analysis of the controller’s idea might look like the following table.Based on the informal analysis, the President probably would expect the profitability of cell-phone casings to improve and the profitability of pen casings to be unaffected. This disagrees with the numerical analysis. Given the propensity of managers to embrace numerical results, less weight will likely be given this analysis compared to the “objective” numbers. As a result, she may question the validity of the numerical analysis as well as the value of the traditional costing system!Finally, the focus of improvement efforts should be directly on the pen-casing product line. This initiative deals mostly with the cell-phone line. What can be done to improve profitability of the pen casings? Can prices be raised without losing too much volume? Can operational improvements be made to lower the indirect manufacturing costs? The controller’s idea is worthy of some support but it does not address the profitability issue head on.2. Exhibit 4-B4, Panel C on the following page is a process map that can be used to explain the impact of the controller’s idea. Panel D at the end of the solution provides a detailed evaluation of the controller’s idea.Pen Cell-PhoneCasings Casings Company Base Gross Profit Percentage* 16.22% (28.63%) 8.07% Plan Gross Profit Percentage** 17.26% 17.81% 17.40% Support of Product Manager? Neutral StrongSupport of President? Strong* See the table on p. 139 of the text.** See panel D of Exhibit 4-B4 that follows.The controller’s idea will result in a slight increase in the gross profit of the pen-casings line but a dramatic turnaround in the profitability of thecell-phone line. The product manager of pen casings would probably be neutral or slightly positive about the idea because the idea does not focus on operational improvements that directly affect the pen-casings line. The cell-phone casings manager would give strong support to the idea – this may save his/her job! The president would strongly support this idea while encouraging all managers involved to keep up the good work. Also, note that the numbers agree with the informal analysis – generating confidence in the integrity of the cost accounting system.Exhibit 4-B4, Panel CProcess Map for ABC SystemExhibit 4-B4: Panel DPRO-FORMA FINANCIAL REPORTS FOR LOPEZ PLASTICS COMPANY:ACTIVITY-BASED COST ALLOCATION SYSTEMSTATEMENT OF OPERTING INCOME CONTRIBUTION TO CORPORATE COSTSAND PROFIT [EXTERNAL REPORTING PURPOSE] [INTERNAL STRATEGIC DECISION MAKINGAND OPERATIONAL-CONTROL PURPOSE]Pen Casings Cell Phone Casings Sales $480,000 $360,000 $120,000 Cost of goods sold:Direct material 46,500 22,500 24,000 Direct labor 150,000 135,000 15,000Processing activity 154,000 126,000 128,000 2Production support activity 46,000 14,375 3 31,625 4 Cost of goods sold 396,500 297,875 98,625 Gross profit 83,500 $ 62,125 $ 21,375 Corporate expenses (unallocated) 80,000Operating loss $ 3,500Gross profit margin 17.26% 17.81%1. $154,000 × [4,500 labor hours/(4,500 labor hours + 1,000 labor hours)]2. $154,000 × [1,000 labor hours/(4,500 labor hours + 1,000 labor hours)]3. $46,000 × [5 distinct parts/(5 distinct parts + 11 distinct parts)]4. $46,000 × [11 distinct parts/(5 distinct parts + 11 distinct parts)]技术资料专业整理3. As vice president, you probably are pleased with the new ABC system. The cost drivers that are used to allocate activity costs appear to be plausible and reliable and thus probably represent a sound cause-effect model of operations. This will improve both the accuracy of product costing and operating managers’ control over costs. Operating managers will be pleased with the ABC system because it helps them understand how their day-to-day work impacts costs and profits. From a behavioral perspective, this should behighly motivational.This problem emphasizes the importance of the cost-accounting system to managers. Different systems can result in significantly different management decisions. In this case, the product-line managers’ support for the controller’s idea changes when an ABC system is used to evaluate the idea. Although the company-level gross margins do not change, it is possible thatthe president would strongly support the idea based on ABC data. Why? Neither of the product-line managers is against the idea, and one strongly supports it. In addition, the president may have more confidence in the accuracy of the ABC analysis. The substantial losses of the current quarter have been completely eliminated and the serious profitability problem of the cell-phone casing product line has been reversed.4-1 A cost management system is a collection of tools and techniques that identifies how management’s decisions affect costs. The three purposesof a CMS are to provide1.cost information for operational control,2.cost information for strategic decisions, and3.measures of inventory value and cost of goods manufactured (orpurchased) for external reporting to investors, creditors, and otherexternal stakeholders.4-2 a. The production manager needs operational control information.b. Setting the product mix is a strategic decision.c. The cost of inventory that appears on the balance sheet is information that is used by external investors, creditors, and other stakeholders.4-3 Cost objects are any items for which decision makers desire a separate measurement of costs. They include departments, products, services, territories, and customers.4-4 No. Products are one of the main cost objects for most companies, but departments are also important cost objects because they represent a logical grouping of activities for which managers desire a separate determination of costs.4-5 The major purpose of a detailed cost-accounting system is to measure costs for decision making and financial reporting. Cost accounting systems become more detailed as management seeks more accurate data for decision making.4-6 The two major processes performed by a cost accounting system are cost accumulation and cost assignment. Cost accumulation is collecting costs by some “natural” classification, such as materials or labor, or by activities performed such as order processing or machine processing. Cost assignment is attaching costs to one or more cost objects, such as activities, processes, departments, customers, or products.4-7 Managers make important decisions on a daily basis. They base these decisions in large part on financial data provided by the cost accounting system. So it is critically important that the cost accounting system provide accurate and reliable financial information.4-8 Managers can specifically and exclusively identify direct costs with a given cost object (that is, directly trace them) in an economically feasible way. Indirect costs cannot be so identified. However, managers can usually identify a plausible and reliable cost driver to use to allocate resourcecosts to cost objects that consume the resources. When direct tracing is not economically feasible and a plausible and reliable cost driver cannot be found, costs should remain unallocated.4-9 Yes, the same cost (for example, the department supervisor's salary)can be direct with respect to a department but indirect with respect to the variety of products flowing through a department (e.g., tables, chairs, and cabinets).4-10 Some costs can be physically linked with a department (or a product), but not in an economically feasible way. An example is the use of departmental meters for measuring power usage. Such devices could measure power costs as direct costs of a department. The alternative is to regard factory power costs as indirect costs of individual departments. Managers often decide whether the resulting increased accuracy provided by individual power meters is worth their additional cost; thus, the test of economic feasibility will decide whether a particular cost is regarded as direct or indirect.4-11 The four purposes of cost allocation are (1) to predict the economic effects of strategic and operational control decisions, (2) to obtain desired motivation, (3) to compute income and asset valuations, and (4) to justify costs or obtain reimbursement.4-12 Generally Accepted Accounting Principles (GAAP) require publically-held companies to allocate all production-related costs and only production-related costs to its products for financial reporting to the public.4-13 No. The costs in a cost pool are not physically traced to cost objects. Only direct costs are traced to cost objects. A cost pool contains indirect costs that are allocated to cost objects using a single cost-allocation base.4-14 Some possible terms are reallocate, assign, distribute, redistribute, load, apportion, reapportion, and burden.4-15 For financial statement purposes, the typical accounting system does not allocate costs associated with value-chain functions other than production to the physical units produced. However, for guiding decisions regarding product-pricing and product-mix decisions, many companies allocate all costs, including R&D, design, marketing, distribution, and customer service costs. However, the allocations of these costs may not be embedded in the system that generates financial statements.4-16 Yes. The two criteria that should be met before using any measure as a cost-allocation base are economic plausibility and reliability. A measure should be plausible – make common sense. If managers cannot easily understand the logical relationship between a cost allocation-base and the costs of an activity or resource, managers will perceive the resulting allocations as arbitrary.4-17 Production maintenance costs are normally indirect. Sales commissions normally can be directly traced to specific products. The costs associated with process design are normally unallocated because it is too difficult to identify plausible and reliable cost-allocation bases, although some companies elect to allocate them.4-18 Generally not. They are direct as far as the physical product is concerned, but in accounting for their cost it would usually be impractical (too costly) to keep records of the amount of glue or tacks used in each unit of product. A more feasible method would be to consider these as supplies (indirect materials).4-19 Depreciation related to production activities is a product cost, not a period cost. Hence, it will become an expense as a part of manufacturing cost of goods sold. Thus, depreciation is not always an immediate expense.。
分批成本计算法英文版

Job-Order Costing – An Example
Direct Costs Direct Materials
Job No. 1
Direct Labor Indirect Costs Manufacturing Overhead Job No. 3 Job No. 2
Manufacturing Overhead, including indirect materials and indirect labor, are allocated to jobs rather than directly traced to each job.
Overhead Actual amount of the Predetermined allocation base applied to a = overhead rate X incurred by the job particular job
Overhead allocation ?
☞ The process of assigning overhead cost to jobs
2-1
Job-Order Costing
Chapter 2
Kieso 中财 第15版 ch01

Resources are limited. Efficient use of resources often determines whether a business thrives.
Illustration 1-1 Capital Allocation Process
1-10
LO 2 Explain how accounting assists in the efficient use of scare resources.
1-4
LO 1 Identify the major financial statements and other means of financial reporting.
Financial Statements and Reporting
Economic Entity
Financial Information
Etc.
GAAP
1-5
LO 1 Identify the major financial statements and other means of financial reporting.
Financial Statements and Reporting
Question
What is the purpose of information presented in notes to the financial statements? a. To provide disclosure required by generally accepted accounting principles. To correct improper presentation in the financial statements. To provide recognition of amounts not included in the totals of the financial statements. To present management’s responses to auditor comments.
管理会计双语版总结

Static budget Flexible budget Static budget variance
Sales volume variance Flexible budget variance
Favorable variance and unfavorable variance Management by exception
16
Types of Problems
A. Equipment Replacement
Sunk Costs & Depreciation
B. Special Order
Fixed Cost & Opportunity Costs
C. Outsourcing: Make or Buy Decision
Comparison of traditional and ABC overhead allocation
6
Major Points of Cost Allocation
1 2 3
4
Why allocate? How much to allocate?
Allocate to whom? How to allocate?
7
Chapter 5 : Cost Behavior
Common cost behavior patterns
Fixed costs : think as total Variable costs : think on a per-unit basis Relevant range
Mixed costs and its separation
2
Chapter 2 :Classifying Costs
- 1、下载文档前请自行甄别文档内容的完整性,平台不提供额外的编辑、内容补充、找答案等附加服务。
- 2、"仅部分预览"的文档,不可在线预览部分如存在完整性等问题,可反馈申请退款(可完整预览的文档不适用该条件!)。
- 3、如文档侵犯您的权益,请联系客服反馈,我们会尽快为您处理(人工客服工作时间:9:00-18:30)。
CHAPTER 9INVENTORY COSTING AND CAPACITY ANALYSIS9-1No. Differences in operating income between variable costing and absorption costing are due to accounting for fixed manufacturing costs. Under variable costing, only variable manufacturing costs are included as inventoriable costs. Under absorption costing, both variable and fixed manufacturing costs are included as inventoriable costs. Fixed marketing and distribution costs are not accounted for differently under variable costing and absorption costing. 9-2The term direct costing is a misnomer for variable costing for two reasons:a. Variable costing does not include all direct costs as inventoriable costs. Only variabledirect manufacturing costs are included. Any fixed direct manufacturing costs andany direct nonmanufacturing costs (either variable or fixed) are excluded frominventoriable costs.b. Variable costing includes as inventoriable costs not only direct manufacturing costsbut also some indirect costs (variable indirect manufacturing costs).9-3No. The difference between absorption costing and variable costs is due to accounting for fixed manufacturing costs. As service or merchandising companies have no fixed manufacturing costs, these companies do not make choices between absorption costing and variable costing.9-4The main issue between variable costing and absorption costing is the proper timing of the release of fixed manufacturing costs as costs of the period:a. at the time of incurrence, orb. at the time the finished units to which the fixed overhead relates are sold.Variable costing uses (a) and absorption costing uses (b).9-5No. A company that makes a variable-cost/fixed-cost distinction is not forced to use any specific costing method. The Stassen Company example in the text of Chapter 9 makes a variable-cost/fixed-cost distinction. As illustrated, it can use variable costing, absorption costing, or throughput costing.A company that does not make a variable-cost/fixed-cost distinction cannot use variable costing or throughput costing. However, it is not forced to adopt absorption costing. For internal reporting, it could, for example, classify all costs as costs of the period in which they are incurred. 9-6Variable costing does not view fixed costs as unimportant or irrelevant, but it maintains that the distinction between behaviors of different costs is crucial for certain decisions. The planning and management of fixed costs is critical, irrespective of what inventory costing method is used.9-7Under absorption costing, heavy reductions of inventory during the accounting period might combine with low production and a large production volume variance. This combination could result in lower operating income even if the unit sales level rises.9-8(a) The factors that affect the breakeven point under variable costing are1. fixed (manufacturing and operating) costs.2. contribution margin per unit.(b) The factors that affect the breakeven point under absorption costing are1. fixed (manufacturing and operating) costs.2. contribution margin per unit.3. production level in units in excess of breakeven sales in units.4. denominator level chosen to set the fixed manufacturing cost rate.9-9Examples of dysfunctional decisions managers may make to increase reported operating income are:a. Plant managers may switch production to those orders that absorb the highest amountof fixed manufacturing overhead, irrespective of the demand by customers.b. Plant managers may accept a particular order to increase production even thoughanother plant in the same company is better suited to handle that order.c. Plant managers may defer maintenance beyond the current period to free up moretime for production.9-10Approaches used to reduce the negative aspects associated with using absorption costing include:a. Change the accounting system:•Adopt either variable or throughput costing, both of which reduce the incentives of managers to produce for inventory.•Adopt an inventory holding charge for managers who tie up funds in inventory.b. Extend the time period used to evaluate performance. By evaluating performanceover a longer time period (say, three to five years), the incentive to take short-runactions that reduce long-term income is lessened.c.Include nonfinancial as well as financial variables in the measures used to evaluateperformance.9-11The theoretical capacity and practical capacity denominator-level concepts emphasize what a plant can supply. The normal capacity utilization and master-budget capacity utilization concepts emphasize what customers demand for products produced by a plant.9-12The downward demand spiral is the continuing reduction in demand for a company’s product that occurs when the prices of competitors’ produc ts are not met, and (as demand drops further) higher and higher unit costs result in more and more reluctance to meet competitors’ prices. Pricing decisions need to consider competitors and customers as well as costs.9-13No. It depends on how a company handles the production-volume variance in the end-of-period financial statements. For example, if the adjusted allocation-rate approach is used, each denominator-level capacity concept will give the same financial statement numbers at year-end. 9-14For tax reporting in the United States, the IRS requires only that indirect production costs are “fairly” apportioned among all items produced. Overhead rates based on normal or master-budget capacity utilization, as well as the practical capacity concept, are permitted. At year-end,proration of any variances between inventories and cost of goods sold is required (unless the variance is immaterial in amount).9-15No. The costs of having too much capacity/too little capacity involve revenue opportunities potentially forgone as well as costs of money tied up in plant assets.9-16 (30 min.) Variable and absorption costing, explaining operating-income differences.1.Key inputs for income statement computations areApril MayBeginning inventory ProductionGoods available for sale Units soldEnding inventory50050035015015040055052030The budgeted fixed cost per unit and budgeted total manufacturing cost per unit under absorption costing areApril May(a) Budgeted fixed manufacturing costs(b) Budgeted production(c) = (a) ÷ (b) Budgeted fixed manufacturing cost per unit(d) Budgeted variable manufacturing cost per unit(e) = (c) + (d) Budgeted total manufacturing cost per unit $2,000,000500$4,000$10,000$14,000$2,000,000500$4,000$10,000$14,000(a) Variable costingApril 2014 May 2014 Revenues a$8,400,000 $12,480,000 Variable costsBeginning inventory$ 0 $1,500,000Variable manufacturing costs b 5,000,000 4,000,000Cost of goods available for sale5,000,000 5,500,000Deduct ending inventory c (1,500,000) (300,000)Variable cost of goods sold3,500,000 5,200,000Variable operating costs d 1,050,000 1,560,000Total variable costs 4,550,000 6,760,000 Contribution margin3,850,000 5,720,000 Fixed costsFixed manufacturing costs2,000,000 2,000,000Fixed operating costs 600,000 600,000Total fixed costs 2,600,000 2,600,000 Operating income$1,250,000 $3,120,000a $24,000 × 350; $24,000 × 520c $10,000 × 150; $10,000 × 30b $10,000 × 500; $10,000 × 400 d $3,000 × 350; $3,000 × 520(b) Absorption costingApril 2014 May 2014 Revenues a$8,400,000 $12,480,000 Cost of goods soldBeginning inventory $ 0 $2,100,000Variable manufacturing costs b5,000,000 4,000,000 Allocated fixed manufacturing costs c 2,000,000 1,600,000Cost of goods available for sale 7,000,000 7,700,000Deduct ending inventory d (2,100,000) (420,000)Adjustment for prod.-vol. variance e 0 400,000 UCost of goods sold 4,900,000 7,680,000 Gross margin 3,500,000 4,800,000 Operating costsVariable operating costs f1,050,000 1,560,000Fixed operating costs 600,000 600,000Total operating costs 1,650,000 2,160,000 Operating income $1,850,000 $ 2,640,000a $24,000 × 350; $24,000 × 520d $14,000 × 150; $14,000 × 30b $10,000 × 500; $10,000 × 400e $2,000,000 – $2,000,000; $2,000,000 – $1,600,000c $4,000 × 500; $4,000 × 400 f $3,000 × 350; $3,000 × 5202. Absorption-costingoperating income–Variable-costingoperating income=Fixed manufacturing costsin ending inventory–Fixed manufacturing costsin beginning inventoryApril:$1,850,000 – $1,250,000 = ($4,000 × 150) – ($0)$600,000 = $600,000May:$2,640,000 – $3,120,000 = ($4,000 × 30) – ($4,000 × 150)– $480,000 = $120,000 – $600,000– $480,000 = – $480,000The difference between absorption and variable costing is due solely to moving fixed manufacturing costs into inventories as inventories increase (as in April) and out of inventories as they decrease (as in May).9-17 (20 min.) Throughput costing (continuation of Exercise 9-16).1. April 2014 May 2014 Revenues a$8,400,000 $12,480,000 Direct material cost of goods soldBeginning inventoryDirect materials in goods manufactured b $ 03,350,000$1,005,0002,680,000Cost of goods available for sale Deduct ending inventory c3,350,000(1,005,000)3,685,000(201,000)Total direct material cost of goods sold Throughput marginOther costs 2,345,0006,055,0003,484,0008,996,000Manufacturing costs 3,650,000d3,320,000e Other operating costs 1,650,000f 2,160,000gTotal other costs Operating income 5,300,000$ 755,0005,480,000$ 3,516,000a $24,000 × 350; $24,000 × 520 e ($3,300 × 400) + $2,000,000b $6,700 × 500; $6,700 × 400 f ($3,000 × 350) + $600,000c $6,700 × 150; $6,700 × 30 g ($3,000 × 520) + $600,000d ($3,300 × 500) + $2,000,0002.Operating income under:April MayVariable costing Absorption costing Throughput costing $1,250,0001,850,000755,000$3,120,0002,640,0003,516,000In April, throughput costing has the lowest operating income, whereas in May throughput costing has the highest operating income. Throughput costing puts greater emphasis on sales as the source of operating income than does either absorption or variable costing.3. Throughput costing puts a penalty on production without a corresponding sale in the same period. Costs other than direct materials that are variable with respect to production are expensed in the period of incurrence, whereas under variable costing they would be capitalized. As a result, throughput costing provides less incentive to produce for inventory than either variable costing or absorption costing.9-18 (40 min.) Variable and absorption costing, explaining operating-income differences.1. Key inputs for income statement computations are:January February MarchBeginning inventory ProductionGoods available for sale Units soldEnding inventory1,4001,4001,3001001001,3751,4751,3751001001,4301,5301,45575The budgeted fixed manufacturing cost per unit and budgeted total manufacturing costper unit under absorption costing are:January February March(a) Budgeted fixed manufacturing costs(b) Budgeted production(c) = (a) ÷ (b) Budgeted fixed manufacturing cost per unit(d) Budgeted variable manufacturing cost per unit(e) = (c) + (d) Budgeted total manufacturing cost per unit $490,0001,400$350$950$1,300$490,0001,400$350$950$1,300$490,0001,400$350$950$1,300January 2014 February 2014 March 2014 Revenues a$4,550,000 $4,812,500 $5,092,500 Variable costsBeginning inventory b$ 0 $ 95,000 $ 95,000Variable manufacturing costs c 1,330,000 1,306,250 1,358,500Cost of goods available for sale Deduct ending inventory d 1,330,000(95,000)1,401,250(95,000)1,453,500(71,250)Variable cost of goods sold Variable operating costs eTotal variable costs 1,235,000942,5002,177,5001,306,250996,8752,303,1251,382,2501,054,8752,437,125Contribution margin Fixed costsFixed manufacturing costsFixed operating costsTotal fixed costs Operating income490,000120,0002,372,500610,000$1,762,500490,000120,0002,509,375610,000$1,899,375490,000120,0002,655,375610,000$2,045,375a $3,500 × 1,300; $3,500 × 1,375; $3,500 × 1,455b $? × 0; $950 × 100; $950 × 100c $950 × 1,400; $950 × 1,375; $950 × 1,430d $950 × 100; $950 × 100; $950 × 75e $725 × 1,300; $725 × 1,375; $725 × 1,4559-7January 2014 February 2014 March 2014Revenues aCost of goods soldBeginning inventory b$ 0 $4,550,000$ 130,000$4,812,500$ 130,000$5,092,500Variable manufacturing costs c1,330,000 1,306,250 1,358,500Allocated fixed manufacturingcosts d 490,000 481,250 500,500Cost of goods available for sale 1,820,000 1,917,500 1,989,000Deduct ending inventory e (130,000) (130,000) (97,500)Adjustment for prod. vol. var.f 0 8,750 U (10,500) FCost of goods sold 1,690,000 1,796,250 1,881,000 Gross margin 2,860,000 3,016,250 3,211,500 Operating costsVariable operating costs g942,500 996,875 1,054,875Fixed operating costs 120,000 120,000 120,000Total operating costs 1,062,500 1,116,875 1,174,875 Operating income $1,797,500 $1,899,375 $2,036,625a $3,500 × 1,300; $3,500 × 1,375; $3,500 × 1,455b $?× 0; $1,300 × 100; $1,300 × 100c $950 × 1,400; $950 × 1,375; $950 × 1,430d $350 × 1,400; $350 × 1,375; $350 × 1,430e $1,300 × 100; $1,300 × 100; $1,300 × 75f $490,000 – $490,000; $490,000 – $481,250; $490,000 – $500,500g $725 × 1,300; $725 × 1,375; $725 × 1,4559-82.⎝⎛⎭⎫Absorption-costing operating income – ⎝⎛⎭⎫Variable costing operating income = ⎝⎛⎭⎪⎫Fixed manufacturing costs in ending inventory – ⎝ ⎛⎭⎪⎫Fixed manufacturing costs in beginning inventoryJanuary: $1,797,500 – $1,762,500 = ($350 × 100) – $0 $35,000 = $35,000February: $1,899,375 – $1,899,375 = ($350 × 100) – ($350 × 100) $0 = $0March: $2,036,625 – $2,045,375 = ($350 × 75) – ($350 × 100) – $8,750 = – $8,750The difference between absorption and variable costing is due solely to moving fixed manufacturing costs into inventories as inventories increase (as in January) and out of inventories as they decrease (as in March).9-19 (20–30 min.) Throughput costing(continuation of Exercise 9-18).1.January February MarchRevenues aDirect material cost ofgoods soldBeginning inventory b$ 0 $4,550,000$55,000$4,812,500$ 55,000$5,092,500Direct materials in goodsmanufactured cCost of goods available for saleDeduct ending inventory d Total direct material cost of goods sold 770,000770,000(55,000)715,000756,250811,250(55,000)400,000786,500841,500(41,250)800,250Throughput margin 3,835,000 4,056,250 4,292,250 Other costsManufacturing e Operating fTotal other costs Operating income 1,050,0001,062,5002,112,500$1,722,5001,040,0001,116,8752,156,875$1,899,3751,062,0001,174,8752,236,875$2,055,375a $3,500 × 1,300; $3,500 × 1,375; $3,500 × 1,455b $? × 0; $550 × 100; $550 × 100c $550 × 1,400; $550 × 1,375; $550 × 1,430d $550 × 100; $550 × 100; $550 ×75e ($400 × 1,400) + $490,000; ($400 × 1,375) + $490,000; ($400 × 1,430) + $490,000f ($725 × 1,300) + $120,000; ($725 × 1,375) + $120,000; ($725 × 1,455) + $120,0002. Operating income under:January February MarchVariable costing Absorption costing Throughput costing $1,762,5001,797,5001,722,500$1,899,3751,899,3751,899,375$2,045,3752,036,6252,055,375Throughput costing puts greater emphasis on sales as the source of operating income than does absorption or variable costing. Accordingly, income under throughput costing is highest in periods where the number of units sold is relatively large (as in March) and lower in periods of weaker sales (as in January).3. Throughput costing puts a penalty on producing without a corresponding sale in the same period. Costs other than direct materials that are variable with respect to production are expensed when incurred, whereas under variable costing they would be capitalized as an inventoriable cost.9-20(40 min) Variable versus absorption costing.1.Beginning Inventory + 2014 Production = 2014 Sales + Ending Inventory 85,000 units + 2014 Production = 345,400 units + 34,500 units2014 Production = 294,900 unitsIncome Statement for the Zwatch Company, Variable Costingfor the Year Ended December 31, 2014Revenues: $22 × 345,400 $7,598,800 Variable costsBeginning inventory: $5.10 × 85,000 $ 433,500Variable manufacturing costs: $5.10 × 294,900 1,503,990Cost of goods available for sale 1,937,490Deduct ending inventory: $5.10 × 34,500 (175,950)Variable cost of goods sold 1,761,540Variable operating costs: $1.10 × 345,400 379,940Adjustment for variances 0Total variable costs 2,141,480 Contribution margin 5,457,320 Fixed costsFixed manufacturing overhead costs 1,440,000Fixed operating costs 1,080,000Total fixed costs 2,520,000 Operating income $2,937,320Absorption Costing DataFixed manufacturing overhead allocation rate =Fixed manufacturing overhead/Denominator level machine-hours = $1,440,000÷6,000= $240 per machine-hour Fixed manufacturing overhead allocation rate per unit =Fixed manufacturing overhead allocation rate/standard production rate = $240 ÷50= $4.80 per unit Income Statement for the Zwatch Company, Absorption Costingfor the Year Ended December 31, 2014Revenues: $22 × 345,400 $7,598,800 Cost of goods soldBeginning inventory ($5.10 + $4.80) × 85,000 $ 841,500Variable manuf. costs: $5.10 × 294,900 1,503,990Allocated fixed manuf. costs: $4.80 × 294,900 1,415,520Cost of goods available for sale $3,761,010Deduct ending inventory: ($5.10 + $4.80) × 34,500 (341,550)Adjust for manuf. variances ($4.80 × 5,100)a 24,480 UCost of goods sold 3,443,940 Gross margin 4,154,860 Operating costsVariable operating costs: $1.10 × 345,400 $ 379,940Fixed operating costs 1,080,000Total operating costs 1,459,940 Operating income $2,694,920 a Production volume variance = [(6,000 hours × 50) – 294,900] × $4.80= (300,000 – 294,900) × $4.80= $24,4802.Zwatch’s operating margins as a percentage of revenues areUnder variable costing:Revenues $7,598,800Operating income 2,937,320Operating income as percentage of revenues 38.7%Under absorption costing:Revenues $7,598,800Operating income 2,694,920Operating income as percentage of revenues 35.5%3. Operating income using variable costing is about 9 percent higher than operating income calculated using absorption costing.Variable costing operating income – Absorption costing operating income =$2,937,320 – $2,694,920 = $242,400Fixed manufacturing costs in beginning inventory under absorption costing –Fixed manufacturing costs in ending inventory under absorption costing= ($4.80 × 85,000) – ($4.80 × 34,500) = $242,4004. The factors the CFO should consider include(a)Effect on managerial behavior.(b)Effect on external users of financial statements.I would recommend absorption costing because it considers all the manufacturing resources (whether variable or fixed) used to produce units of output. Absorption costing has many critics. However, the dysfunctional aspects associated with absorption costing can be reduced by •Careful budgeting and inventory planning.•Adding a capital charge to reduce the incentives to build up inventory.•Monitoring nonfinancial performance measures.9-21 (10 min.) Absorption and variable costing. The answers are 1(a) and 2(c). Computations:1. Absorption Costing:Revenues aCost of goods sold:Variable manufacturing costs bAllocated fixed manufacturing costs c Gross margin $2,400,000360,000$4,800,0002,760,0002,040,000Operating costs:Variable operating dFixed operating Operating income1,200,000400,000 1,600,000$ 440,000a $40 × 120,000b $20 × 120,000c Fixed manufacturing rate = $600,000 ÷ 200,000 = $3 per output unit Fixed manufacturing costs = $3 × 120,000d $10 × 120,0002. Variable Costing:Revenues aVariable costs:Variable manufacturing cost of goods sold b Variable operating costs cContribution marginFixed costs:Fixed manufacturing costsFixed operating costsOperating income $2,400,0001,200,000600,000400,000$4,800,0003,600,0001,200,0001,000,000$ 200,000a $40 × 120,000b $20 × 120,000c $10 × 120,0009-22(40 min) Absorption versus variable costing.1. The variable manufacturing cost per unit is $30 + $25 + $60 = $115.2014 Variable-Costing Based Income StatementRevenues (17,500 ⨯ $450 per unit) $7,875,000 Variable costsBeginning inventory $ 0Variable manufacturing costs (18,000 units ⨯ $115 per unit) 2,070,000Cost of goods available for sale 2,070,000Deduct: Ending inventory (500 units ⨯ $115 per unit) (57,500)Variable cost of goods sold 2,012,500Variable marketing costs (17,500 units ⨯ $45 per unit) 787,500Total variable costs 2,800,000 Contribution margin 5,075,500 Fixed costsFixed manufacturing costs 1,200,000Fixed administrative costs 965,450Fixed marketing 1,366,400Total fixed costs 3,531,850 Operating income $1,543,1502. Fixed manufacturing overhead rate = $1,200,000 / 20,000 units = $60 per unit2014 Absorption-Costing Based Income StatementRevenues (17,500 units ⨯ $450 per unit) $7,875,500 Cost of goods soldBeginning inventory $ 0Variable manufacturing costs (18,000 units ⨯ $115 per unit) 2,070,000Allocated fixed manufacturing costs (18,000 units ⨯ $60 perunit) 1,080,000Cost of goods available for sale 3,150,000Deduct ending inventory [500 units ⨯ ($115 + $60) per unit] (87,500)Add unfavorable production volume variance 120,000a UCost of goods sold 3,182,500 Gross margin 4,692,500 Operating costsVariable marketing costs (17,500 units ⨯ $45 per unit) 787,500Fixed administrative costs 965,450Fixed marketing 1,366,400Total operating costs 3,119,350 Operating income $1,573,150 a PVV = $1,200,000 budgeted fixed mfg. costs – $1,080,000 allocated fixed mfg. costs = $120,000 U3. 2014 operating income under absorption costing is greater than the operating income under variable costing because in 2014 inventory increased by 500 units. As a result, under absorption costing, a portion of the fixed overhead remained in the ending inventory and led to a lower cost of goods sold (relative to variable costing). As shown below, the difference in the two operating incomes is exactly the same as the difference in the fixed manufacturing costs included in ending versus beginning inventory (under absorption costing).Operating income under absorption costing $1,573,150Operating income under variable costing 1,543,150Difference in operating income under absorption versus variablecosting $ 30,000Under absorption costing:Fixed mfg. costs in ending inventory (500 units ⨯ $60 per unit) $ 30,000Fixed mfg. costs in beginning inventory (0 units ⨯ $60 per unit) 0Change in fixed mfg. costs between ending and beginning inventory $ 30,0004. Relative to the alternative of using contribution margin (from variable costing), the absorption-costing based gross margin has some pros and cons as a performance measure for Regina’s supervisors. It takes into account both variable costs and fixed costs—costs that the supervisors should be able to control in the long run—and therefore is a more complete measure than contribution margin, which ignores fixed costs (and may cause the supervisors to pay less attention to fixed costs). The downside of using absorption-costing-based gross margin is the supervisor’s temptation to use inventory levels to control the gross margin—in particular, to shore up a sagging gross margin by building up inventories. This can be offset by specifying, or limiting, the inventory build-up that can occur, charging the supervisor a carrying cost for holding inventory, and using nonfinancial performance measures such as the ratio of ending to beginning inventory.9-23(40 min.)Variable and absorption costing, sales, and operating-income changes. Note: In some print versions of the text, the adjustment for production-volume variance for 2014 is listed as (260,600) rather than (260,000) and the gross margin is listed as 468,600 rather than 468,000.1. Smart Safety’s annual fixed manufacturing costs are $1,300,000. It allocates $25 of fixed manufacturing costs to each unit produced. Therefore, it must be using $1,300,000 ÷$25 = 52,000 units (annually) as the denominator level to allocate fixed manufacturing costs to the units produced.We can see from Smart Safety’s income statements that it disposes of any production volume variance against cost of goods sold. In 2014, 62,400 units were produced instead of the budgeted 52,000 units. This resulted in a favorable production volume variance of $260,000 F [(62,400 –52,000) units ⨯$25 per unit], which, when written off against cost of goods sold, increased gross margin by that amount.2.The breakeven calculation, same for each year, is shown below:Calculation of breakeven volume 2013 2014 2015 Selling price ($2,236,000÷52,000; $2,236,000 ÷59,000; $2,683,000 ÷ 62,400) $43 $43 $43 Variable cost per unit (all manufacturing) 14 14 14 Contribution margin per unit $29 $29 $29 Total fixed costs(fixed mfg. costs + fixed selling & admin. costs) $1,508,000 $1,508,000 $1,508,000 Breakeven quantity =Total fixed costs ÷ contribution margin per unit 52,000 52,000 52,0003.Variable Costing2013 2014 2015 Sales (units) 52,000 52,000 62,400 RevenuesVariable cost of goods soldBeginning inventory $14 ⨯ 0; 0; 10,400 0 0 145,600 Variable manuf. costs $14 ⨯ 52,000; 62,400; 52,000 728,000 873,600 728,000 Deduct ending inventory $14 ⨯ 0; 10,400; 0 0 (145,600) 0 Variable cost of goods sold 728,000 728,000 873,600 Contribution margin $1,508,000 $1,508,000 $1,809,600 Fixed manufacturing costs $1,300,000 $1,300,000 $1,300,000 Fixed selling and administrative expenses 208,000 208,000 208,000 Operating income $ 0 $ 0 $ 301,600 Explaining variable costing operating incomeContribution margin($26 contribution margin per unit ⨯ sales units) $1,508,000 $1,508,000 $1,809,600 Total fixed costs 1,508,000 1,508,000 1,508,000 Operating income $ 0 $ 0 $ 301,600 4.Reconciliation of absorption/variable costingoperating incomes 2013 2014 2015(1) Absorption costing operating income $0 $260,000 $ 41,600(2) Variable costing operating income 0 0 301,600(3) Difference in operating incomes = (1) – (2) $0 $260,000 $(260,000)(4) Fixed mfg. costs in ending inventory under absorptioncosting (ending inventory in units ⨯ $25 per unit) $0 $260,000 $ 0 (5) Fixed mfg. costs in beginning inventory under absorptioncosting (beginning inventory in units ⨯ $25 per unit) 0 0 260,000 (6) Difference = (4) – (5) $0 $260,000 $(260,000) In the table above, row (3) shows the difference between the operating income under absorption costing and the operating income under variable costing, for each of the three years. In 2013, the difference is $0; in 2014, absorption costing income is greater by $260,000; and in 2015, it is less by $260,000. Row (6) above shows the difference between the fixed costs in ending inventory and the fixed costs in beginning inventory under absorption costing; this figure is $0 in 2013, $260,000 in 2014, and –$260,000 in 2015. Row (3) and row (6) explain and reconcile the operating income differences between absorption costing and variable costing.Stuart Weil is surprised at the non-zero, positive net income (reported under absorption costing) in 2014, when sales were at the ‘breakeven volume’ of 52,000; further, he is concerned about the drop in operating income in 2015, when, in fact, sales increased to 62,400 units. In 2014, starting with zero inventories, 62,400 units were produced and 52,000 were sold, i.e., at。