六级之图表作文
六级图表类作文范文

六级图表类作文范文
范文:
第一段,图表揭秘。
一看这图表,就知道近几年那城市居民出行方式可变了不少。
私家车越来越多,公共交通和走路的人越来越少。
第二段,私家车火爆。
说起私家车,那可真是火得一塌糊涂。
从2018年到2023年,
私家车的使用率从30%一路飙升到快50%了。
这背后啊,肯定是大家
生活好了,都想开车方便点。
第三段,公共交通遇冷。
可另一边呢,公共交通就没那么受欢迎了。
图表显示,用公共
交通的人越来越少,可能和私家车多了、公交服务没跟上都有关系。
第四段,步行渐少。
再来说说步行。
以前大家都爱走路,现在可不一样了。
城市的节奏越来越快,大家都想快点到达目的地,所以走路的人就少了。
第五段,环境与健康小忧。
这出行方式一变,环境和健康也跟着受影响。
私家车多了,空气和噪音污染都加重了;走路的人少了,大家运动也少了,健康自然就受影响了。
第六段,未来咋办。
那未来怎么办呢?城市管理者可得好好想想了。
六级图表写作真题及范文

六级图表写作真题及范文六级图表写作真题及范文Part V Writing 图表作文,关于一个美国大学图书馆的图书流动量,给出他们的’流动比例对比,说明原因,并说明你自己喜欢阅读什么样的书。
[范文] From the table based on a survey we made of the reading preferences of students in an American university in 2002, we learnt that, of all kinds of bookds, contemporary university students like ficitions best, which has 65.9 percent of book circulation in library while other kinds of books have low percentage: general nonfiction --18.2, science/technology/education-10.8,art/literature/poetry--5.1. It suggests that contemporary students are much more easily influenced by the fashion than ever before. Its a reasonable and good phenomenon because it reveals that university students like to keep up with the development of society. Thus they will easily adapt themselves into the new life after they graduate from school. Generally, I like reading nonfictions, for it is tightly connected with the reality. To some degree, its no use reading too much fictions which sometimes will take you into fancy fantasy. Fast life pace also dont allow me to read books on art or poetry. To me, nonfiction is even helpful in analyzing society and humanity.。
六级图表作文
六级图表作文
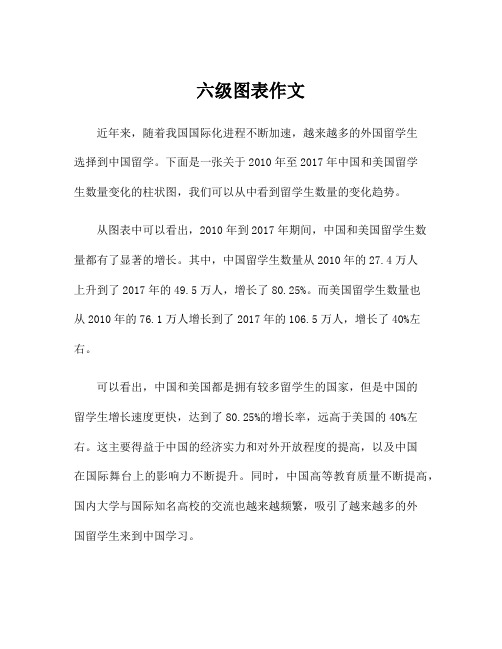
近年来,随着我国国际化进程不断加速,越来越多的外国留学生
选择到中国留学。
下面是一张关于2010年至2017年中国和美国留学
生数量变化的柱状图,我们可以从中看到留学生数量的变化趋势。
从图表中可以看出,2010年到2017年期间,中国和美国留学生数量都有了显著的增长。
其中,中国留学生数量从2010年的27.4万人
上升到了2017年的49.5万人,增长了80.25%。
而美国留学生数量也
从2010年的76.1万人增长到了2017年的106.5万人,增长了40%左右。
可以看出,中国和美国都是拥有较多留学生的国家,但是中国的
留学生增长速度更快,达到了80.25%的增长率,远高于美国的40%左右。
这主要得益于中国的经济实力和对外开放程度的提高,以及中国
在国际舞台上的影响力不断提升。
同时,中国高等教育质量不断提高,国内大学与国际知名高校的交流也越来越频繁,吸引了越来越多的外
国留学生来到中国学习。
相比之下,美国的留学生增长速度虽然较低,但留学生总量依然居于全球第一位。
这主要得益于美国在教育领域的强大实力和学术水平,以及美国在世界范围内所具有的较高的知名度和品牌效应。
总的来说,中国和美国作为全球最大的两个留学目的地,在各自的发展之路上都取得了重要成果。
未来,我们可以预见,中美两国之间的教育交流合作还将不断深化和拓展,为各自的发展和两国人民之间的友好交往做出更多贡献。
英语六级图表作文模板

英语六级图表作文模板英文回答:Introduction.Begin with a general statement about the topic. State the purpose of the chart.Body Paragraph 1。
Describe the first aspect of the chart.Provide specific examples from the data.Body Paragraph 2。
Describe the second aspect of the chart.Provide specific examples from the data.Body Paragraph 3 (Optional)。
If necessary, describe a third aspect of the chart.Provide specific examples from the data.Conclusion.Summarize the main findings of the chart.Restate the purpose of the chart.Example Essay.Topic: The Impact of Social Media on Teenagers.Introduction.In today's digital age, social media has become an integral part of teenagers' lives. It offers a platform for communication, self-expression, and entertainment. However,concerns have been raised about the potential impact of social media on their well-being and development. This chart analyzes data from a recent survey that examined the relationship between social media use and teenage behavior.Body Paragraph 1。
六级英语图表类范文

六级英语图表类范文英文回答:The provided chart illustrates the significant decline in the number of wildlife species in different regions of the world between 1970 and 2018, as reported by the World Wildlife Fund (WWF). The WWF's Living Planet Index (LPI), which measures the abundance of vertebrate species in various biomes, has decreased by an alarming 68% duringthis period.In 1970, the LPI stood at 100, indicating no change from the baseline year. However, by 2018, the index had plummeted to 32, signifying a catastrophic loss of wildlife populations. The decline is particularly pronounced in tropical regions, with the LPI in the Amazon rainforest mengalami a staggering 94% drop and the Congo Basin suffering an 83% reduction.The decline in wildlife populations is primarilyattributed to human activities such as habitat loss, overfishing, and climate change. Deforestation for agriculture, logging, and development has destroyed vast areas of natural habitats, depriving wildlife of their homes and food sources. Overfishing has depleted fish stocks, disrupting marine ecosystems and threatening the livelihoods of coastal communities. Climate change isfurther exacerbating these threats by altering temperatures and precipitation patterns, affecting species' habitats and their ability to survive.The consequences of wildlife decline are far-reaching. Healthy wildlife populations are essential for maintaining ecosystem balance, pollinating plants, and dispersing seeds. Their loss can ripple through entire food webs, leading to the collapse of entire ecosystems. Moreover, wildlifedecline has severe implications for human well-being, as it affects food security, water quality, and the availabilityof natural resources.Addressing wildlife decline requires a concerted effort from governments, organizations, and individuals.Protecting and restoring natural habitats, implementing sustainable fishing practices, and mitigating climate change are crucial steps towards safeguarding wildlife populations. Additionally, raising awareness about the importance of wildlife and encouraging responsible consumption patterns can contribute to reducing humanimpact on the environment.中文回答:根据世界自然基金会(WWF)的报告,图表显示了全球不同地区野生动物种群数量在 1970 年至 2018 年间大幅下降。
英语六级图表作文优秀7篇

英语六级图表作文优秀7篇挫折英语六级作文篇一if there is any single factor that makes for success in living,it is the ability to profit by defeat. every success i know has been achieved because the person was able to analyze defeat and actually profit by it in his net undertaking.confuse defeat with failure, and you are doomed indeed to failure. for it isnt defeat that makes you fail: it is your own refusal to see in defeat the guide and encouragement to success.defeats are nothing to be ashamed of. they are routine incidents in the life of every man who achieves success. but defeat is a dead loss unless you do face it without humiliation, analyze it and learn why you failed. defeat, in other words, can help to cure its own cause. not only does defeat prepare us for success, but nothing can arouse within us such a compelling desire to succeed. if you let a baby grasp a rod and try to pull it away, he will cling more and more tightly until his whole weight is suspended. it is this same reaction which should give you new and greater strength every time you are defeated.if you eploit the power which defeat gives, you can accomplish with it far more than you are capable of.春日漫步六级作文篇二i’ve walked to a hill mile from the house. it’s not really ahill but a mountain slope that heaves up, turns sideways, and comes down again, straight down to a foot-wide creak. every-thing i can see from here used to be a flatland covered with shallow water. used to be.±means several hundred millions years ago, and the land itself was not really 。
2021年6月六级图表作文
2021年6月六级图表作文
段落一。
哎呀,看这柱状图,年轻人真的爱用社交媒体啊!20多岁的那
些小伙子小姑娘们,85%都在用!30多岁的也有70%,不过比起年轻
人还是稍微低了点。
但最让人惊讶的是,40岁以上的大叔大妈们,
他们的使用率竟然从30%涨到了50%!看来社交媒体真的老少皆宜啊!
段落二。
看看这折线图,我发现年轻人在社交媒体上真的是“沉迷”啊。
那些20多岁的,每天竟然要花3.5小时在上面!相比之下,30多
岁的就“理智”多了,日均使用时间2.5小时。
看来年龄越大,越
懂得如何平衡生活和工作啊!
段落三。
哈哈,这饼图真的有意思!看来大家最喜欢在社交媒体上看娱
乐信息了,占了整整40%!生活分享也不赖,占了30%。
不过那些教
育和工作相关的信息,就显得有点“冷清”了,只有20%的人感兴
趣。
看来大家上社交媒体,主要还是为了放松和娱乐啊!
段落四。
哎呀,这条形图真是让人大开眼界!微信竟然有9亿用户,真是个巨无霸啊!微博和抖音也不赖,分别有3亿和2.5亿的用户。
不过那个知乎,虽然用户数量不多,但在知识分享方面可是个“大佬”啊!看来每个平台都有自己的特色和受众啊!
段落五。
总的来说啊,年轻人真的很喜欢用社交媒体,而且更喜欢看娱乐和生活分享的内容。
而随着年龄的增长,大家的使用时间和兴趣都会有所变化。
另外啊,不同的社交媒体平台也有各自的特色和受众,真是个多彩多姿的世界啊!。
近年来六级真题图画作文
近年来六级真题图画作文英文回答:In recent years, the global landscape has undergone a series of transformative shifts, shaping the way weinteract with our surroundings and each other. One of the most significant aspects of this ever-evolving landscape is the rise of technological advancements, which have permeated every facet of our lives, from the way we communicate to the way we work and entertain ourselves.Undoubtedly, the internet has emerged as a pivotal force in this technological revolution, connecting individuals and communities across vast geographical distances. The widespread adoption of smartphones and mobile devices has further propelled the internet's reach, making it an indispensable tool for accessing information, staying connected, and conducting business on the go.Social media platforms have become ubiquitous in ourdaily lives, offering unprecedented opportunities for communication and self-expression. While they havefacilitated the creation of global communities and fostered social movements, they have also raised concerns about privacy, security, and the spread of misinformation.The emergence of artificial intelligence (AI) hasignited both excitement and apprehension. On the one hand, AI holds immense promise for automating tasks, improving efficiency, and enhancing decision-making. On the other hand, it raises ethical questions about job displacement, bias, and the potential for misuse.The rise of virtual and augmented reality (VR/AR) technologies is transforming the way we experience and interact with the world around us. These immersive technologies offer the potential for enhanced entertainment, education, and healthcare. However, they also raiseconcerns about addiction, isolation, and the erosion ofreal-world experiences.Environmental concerns have become increasinglypressing in recent years, prompting a global shift towards sustainability and green technologies. The adoption of renewable energy sources, such as solar and wind power, has gained momentum as we strive to reduce our carbon footprint. Electric vehicles are also gaining popularity, offering a cleaner alternative to traditional gasoline-powered cars.The pursuit of healthy lifestyles has taken centerstage in many societies. The growing emphasis on physical and mental well-being has led to a surge in fitness trackers, wearable health monitors, and health-related apps. These devices and applications empower individuals to take control of their health and improve their overall well-being.The global economic landscape has witnessed a shift towards globalization and interconnectedness. International trade and investment have flourished, creatingopportunities for economic growth and job creation. However, this interconnectedness has also led to increased competition and economic inequality.In the realm of education, the advent of online learning platforms has expanded access to education and created new opportunities for lifelong learning. Remote learning has become increasingly popular, allowing students to pursue their educational goals from anywhere in the world.中文回答:综观近几年来的变化,全球格局发生了深刻的转变,极大地影响着我们与周围环境和彼此之间的互动方式。
六级英语图表类范文
六级英语图表类范文英文回答:I would like to discuss the chart provided, which illustrates the percentage of people in different age groups who use smartphones in a certain country. The chart is divided into three age groups: 18-25, 26-40, and 41-60. The data shows that the younger age group, 18-25, has the highest percentage of smartphone users, followed by the 26-40 age group, and then the 41-60 age group.Looking at the chart, we can see that 85% of people aged 18-25 use smartphones. This high percentage is not surprising, as younger people tend to be more tech-savvy and rely heavily on smartphones for various activities such as social media, online shopping, and entertainment. For example, I am in the 18-25 age group, and I use my smartphone for almost everything from checking my emails to watching movies on Netflix.Moving on to the 26-40 age group, we can see that 70%of people in this age range use smartphones. While the percentage is lower compared to the younger age group, itis still a significant number. This age group consists of individuals who are likely to be working professionals or parents, and smartphones play a crucial role in their daily lives. For instance, my sister is in this age group, andshe relies on her smartphone for work-related emails, scheduling appointments, and staying connected with her family.Lastly, the chart shows that 50% of people aged 41-60 use smartphones. This percentage is the lowest among the three age groups, which can be attributed to the fact that older individuals may not be as comfortable with technology or may prefer traditional methods of communication. However, it is worth noting that the percentage is still substantial, indicating that smartphones are becoming increasingly prevalent even among older generations. My parents, who are in this age group, have recently started using smartphonesto keep in touch with their friends and grandchildren through messaging apps and social media.In conclusion, the chart clearly demonstrates that the usage of smartphones varies across different age groups. The younger age group has the highest percentage of smartphone users, followed by the middle-aged group, and then the older age group. This trend can be explained by factors such as technological familiarity, lifestyle preferences, and the increasing accessibility of smartphones. It is interesting to see how smartphones have become an integral part of our lives, regardless of age.中文回答:我想讨论一下所提供的图表,该图表显示了某个国家不同年龄段使用智能手机的比例。
六级图表式英语作文
六级图表式英语作文I was asked to write a six-level chart-style English essay, and I must say, I was a bit nervous at first. But then I thought, why not give it a try? So here I am, ready to tackle this challenge head-on.英文回答:First of all, let me explain what a six-level chart-style English essay is. It is essentially an essay that is structured in a way that presents information in a clear and organized manner. The essay is divided into six levels, with each level providing more detailed information than the previous one. This format is often used in academic writing to present complex data in a concise and easy-to-understand way.Now, let's talk about how I would approach writing this type of essay. I would start by analyzing the data presented in the chart and identifying any patterns ortrends. For example, if the chart is about the sales performance of a company over a period of time, I would look for any spikes or dips in the sales figures and try to explain the reasons behind them.Next, I would outline the main points I want to cover in each level of the essay. This could include discussing the overall trend shown in the chart, highlighting any key findings, and providing a detailed analysis of the data. I would also make sure to include relevant examples and statistics to support my arguments.In the conclusion of the essay, I would summarize the main points discussed in each level and provide some final thoughts on the topic. I would also consider any implications of the data presented in the chart and discuss any potential future developments.Overall, writing a six-level chart-style English essay requires careful analysis, clear organization, and strong argumentation. It may seem daunting at first, but with the right approach and mindset, it can be a rewarding andinsightful exercise.中文回答:首先,让我解释一下什么是六级图表式英语作文。
- 1、下载文档前请自行甄别文档内容的完整性,平台不提供额外的编辑、内容补充、找答案等附加服务。
- 2、"仅部分预览"的文档,不可在线预览部分如存在完整性等问题,可反馈申请退款(可完整预览的文档不适用该条件!)。
- 3、如文档侵犯您的权益,请联系客服反馈,我们会尽快为您处理(人工客服工作时间:9:00-18:30)。
六级之图表作文 Prepared on 22 November 2020
图表作文图表是科学文献中常用的一种表达手段。
四六级图表作文利用图形(figure)、表格(table)、曲线图(graph)、柱状图(pie chart)和饼状图(pie chart)等作为写作提示,并以此为依据要求用简洁生动的语言把图标中所给出的信息完整而准确地表达出来。
这一类作文通常前半部分说明图标所表达的信息,后半部分进行议论,不论以何种方式出现,图标作文还是遵循一定的模式。
最常见的模式是:第一段:描述现状。
简要地描述图表,概括图表所表现的社会问题。
第二段:分析原因。
剖析图表所反映的深层次问题。
用图表来论证第一段提出的主题,或者分析各个数据产生的原因。
第三段:结论和启示。
从图表中所体现的现象获得结论或者启示,或者对图标所表现的趋势加以预测。
图表作文模式
①As is shown/depicted/described in the picture/chart, 概括图表内容。
②For one thing, 支持这一内容的一个方面。
③For another, 支持这一内容的另外一个方面。
④It is obvious that 图表所反映的内容。
⑤Many remarkable factors contribute to主题。
⑥First of all, 理由一。
⑦In addition, 理由二。
⑧Thirdly,理由三。
⑨Considering all these, I believe that我的看法或偏好。
⑩First of all, 个人看法的依据一。
⑾Furthermore, 个人看法的依据二。
⑿Therefore, 个人的结论或文章的结论。
Example
As is shown in the chart, the number of Chinese people traveling abroad increased gradually. For one thing, in 2001, the number of people traveling abroad was seven point five million, which was increased to ten million in 2002. For another, in 2003, there were twelve point one million Chinese people traveling abroad. It is obvious that China is witnessing an ever prosperous overseas tourism.
The reasons of the increase lie in several aspects.First of all, with the implementation of China’s reform and opening policy, china’s economy has been growing rapidly and steadily. In addition, people’s income has increased tremendously, so more and more people are now eager to see the outside world with their own eyes. Thirdly, the Chinese government has been simplifying the formalities of traveling abroad and has opened more overseas tourist destinations.
As I understand, more and more Chinese people want to travel abroad. One the one hand, at present most people can afford the fees traveling abroad. On the other hand, youngsters especially young couples treat traveling abroad as a new fashion. In conclusion, in light of the development trend of the Chinese economy, the number of outbound travelers in the future will keep increasing.
描写图表和数据的句型
1. 篇首
As we can see from the chart/ As is shown in the table/ According to the table, the price of oil increased dramatically.
The figures in the chart reflect that/ The statistics show that/The numbers in the graph reveal that people’s income has been increasing steadily.
The graph suggests/shows/indicates/illustrates that there has been a sharp decline/rise in the population in this region.
It’s clear/apparent that the output of this type of products is rising/dropping.
2. 数据变化常用句型
数据的增长
The number of ….has grown steadily /has risen from / climbed / went sharply up /soared/ tends to go up / tends to increase….
There was a rapid/sharp /dramatic/gradual/slow increase/rise in the number of students. The number of students is on the rise/on the increase.
数据的降低
The number of …dropped steadily from / declined suddenly / fell/ tends to go down/ shows a tendency to decrease….
There is a sharp fall/ gradual decrease/ sudden reduction / slow decline / drop ..in the number of ..in 2006.
数据的持平
In 2006, the number of …remain the same /steady /stable / constant /level.
There was little change/hardly any change in the number of between …and …/
There was a slight fluctuation in the number of .. from … to…
表示比较级、倍数、比例关系
be in direct ratio to/with 成正比be in inverse ratio to/with成反比
have the largest percentage /proportion of 占最大比例
the number of .. makes up /takes up / accounts for fifty percent of the total.
占总量的50%
Compared with…, … has a higher / lower percentage
与。
相比,。
所占的百分比较大、较小。
.. is twice/ three times as ….as …/ that of …
Double
Treble
The situation reached a peak at ……于。
达到最高值
3. 结论
From the analysis above / From the data, we can conclude that/ we can draw / come to the conclusion that….
According to the information gathered above, we may reach the conclusion that….
We can make a conclusion from the above that….
Homework
Please write a composition on the topic: Annual Expenses on Learning English. You should write at least 150 words, and based your composition on the chart and the outline given below in Chinese:
某城市大学生购买英语资料比例图
容。
2)解释发生以上变化的原因。
3)我的看法。