BSEE 2014 Annual Report
ACCA考试报告分析F2-examreport-2014J
Examiner’s reportF2/FMA Management AccountingFor CBE and Paper exams covering January to June 2014 General CommentsThe structure of the exam changed from previous sittings due to the introduction of multi task questions (MTQs) to both the CBE and paper based examination. From now onwards section A of the paper will contain 35 multiple choice questions (MCQs) – each worth 2 marks, and section B will have 3 MTQs worth ten marks each. All questions are compulsory. The paper remains a two hour examination. A pilot paper reflecting this new structure is available on the ACCA website together with a number of practice MTQsAs always, excellent scores were achieved by some candidates. I congratulate both them and their teachers. I offer my commiserations to those who were not successful.In section A the worst answered MCQ questions were calculation based. Calculation questions accounted for approximately 40% of MCQ questions, and as usual were answered worse than the narrative based MCQs.The best answered questions were of a narrative nature.In section B two thirds of the marks were for calculation. There was little difference in performance between section B calculation and narrative questions.As is usually the case for this paper, F2 candidates on average, performed better than FMA candidates, but on this occasion the difference was narrower than usual.The following questions are ones where the performance of candidates was very weak. Each of these questions relate to a mainstream topic in the Study Guide.Section A Sample questions for discussionExample 1A company uses standard absorption costing. Actual profit last period was $25,000, which was $5,000 less than budgeted profit. The standard profit on actual sales for the period was $15,000. Only three variances occurred in the period: a sales volume profit variance, a sales price variance and a direct material price variance.Which of the following is a valid combination of the three variances?Sales volume Sales price Direct materialprofit variance variance price varianceA $15,000 A $2,000 F $8,000 FB $5,000 A $2,000 A $2,000 FC $15,000 A $2,000 A $8,000 AD $5,000 A $5,000 F $5,000 AThe correct answer is A.The correct answer can be arrived at by looking for a combination of variances that satisfy two criteria(i)The total of the variances must add to $5,000 adverse as actual profit is $5,000 less than budgetedprofit(ii)As budgeted profit is $30,000 ($25,000 actual plus a $5,000 adverse variance) and standard profit on actual sales is $15,000 (given) then the sales volume variance must be $15,000 adverse.Only alternative A meets both of these criteria. D was the most popular choice by candidates, suggesting that most understood criteria 1, but not criteria 2.Questions on standard cost operating statements have been mentioned in previous reports and are a commonly amongst the worst answered questions on the paper.Example 2A company has prepared flexed budgets at two activity levels. The cost per unit of three costs is given below. All three costs behave in a linear manner with respect to activity.Activity level (units)10,000 15,000CostX $3·0 per unit $2·0 per unitY $1·0 per unit $1·0 per unitZ $3·5 per unit $3·0 per unitIs each of the costs variable, semi-variable or fixed?X Y ZA Variable Fixed Semi-variableB Variable Fixed VariableC Fixed Variable Semi-variableVariable FixedD FixedThe correct answer is C.The key to the question is to understand that for variable costs the cost per unit is constant, whilst for fixed costs the total cost is constant. Cost X can quickly be identified as a fixed cost as the total cost between the two output levels is unchanged (10,000 units x $3 = 15,000 units x $2). Cost Y is a variable cost because the cost per unit is constant. Cost D meets neither of these criteria because it contains elements of both fixed and variable cost, and therefore is a semi variable cost. Alternatives A and B were selected by majority of candidates, suggesting some confusion between cost per unit and total cost.Example 3An accountant wishes to use the following spreadsheet to calculate budgeted production units.Which formula should be entered in cell B5?A =B3-C4+B4B =B3-B4C =B3+C4D =B3+C4-B4The correct answer is DTo arrive at this answer candidates had to understand that production units = sales units + closing inventory of finished goods – opening inventory of finished goods, and that the opening inventory for August was the closing inventory for July.Alternative B was the most popular answer presumably on the basis that it totalled the column. Alternatives A and C were selected by only small percentages of candidates.Section BSection B contained 3 questions, one from each of syllabus areas C Budgeting, D Standard Costing and E Performance Measurement. This approach will continue in future papers. The balance of MCQ questions in section A was altered to reflect this change and to preserve the overall balance of the paper. The pilot paper reflects the new weightings. This balance of questions will be used in future papers.Common problems with section B questions included the following∙An apparent lack of knowledge of the net present value (NPV) technique. Many candidates appeared to confuse it with net book value (NBV) and unnecessarily calculated depreciation provisions over the asset’s life. Many candidates were unable to suggest one advantage of using net present value.∙An inability to calculate material price and usage variances and fixed overhead volume variances.∙An inability to explain the causes of variances.∙An imprecise knowledge of commonly used accounting ratios. Return on capital employed should not be calculated by any profit figure divided any asset figure. Its formal definition is operating profit divided by ordinary shareholder’s funds plus non-current liabilities.∙Weak understanding of a businesses’ performance. A significant minority of candidates did not know which ratios measured liquidity and which measured gearing. For the paper exam, many provided weak commentary, such as “the gearing ratio is higher”. This alone does not tell whether this a good or bad, and greater clarity is required for full marks. Again for paper exam only, there were often poor layout of calculations, making it very difficult to understand what candidates were trying to do.Future candidates are advised to:• Study the whole syllabus, because the paper will cover the full syllabus.• Practise as many multiple choice questions as possible.• Read questions very carefully in the examination.• Try to attempt the “easy” examination questions first.• Not to spend too much time on apparently “difficult” questions.• Attempt all questions in the examination (there are no negative marks for incorrect answers).∙For those taking paper exam, present section B answers as tidily as possible∙For those taking CBE exam, read each requirement carefully• Read previous Examiner’s Reports.。
3058749烟台银行2014年年报翻译实践报告

AbstractAn annual report is an important tool for information disclosure, through which international investors can learn about the business scope, operating status and financial situation of their target company. Yantai Bank, a major local commercial bank of Yantai, was required by its foreign strategic investors to release an English version of its annual report for the investors’ reference.This report is based on the translation of the Annual Report of Yantai Bank2014 and is divided into four parts, namely translation task, translation process, case analysis and conclusion. During the process of translation, the lack of financial knowledge was a major obstacle and made the project an arduous task for the translators to deal with. Moreover, how to adjust the differences between Chinese and English so as to ensure the translated version a natural and native one for the target readers was another major problem. To consult with the professionals of Yantai Bank, look up the professional words in dictionaries and search them through search engines were the main ways adopted to understand the report as much as possible.With the aim of providing the target readers with a natural and native translated version, free translation was adopted as the translation strategy, skopos theory was chosen as the guiding theory for the project and many translation techniques such as conversion, amplification, inversion, division, passive voice and so on were used to deal with the differences between the two languages.This project laid a solid foundation for translating similar documents in the future. Specifically, the significance of adopting various translation techniques, which can largely improve efficiency, was realized. Through the analysis of the translation practice and problems, the report aims to summarize the typical translation problems in the translation process of annual report of banks, provide valuable reference for other translators and guide translation practice in the future.Key words: annual report; skopos theory; translation techniques摘要年报是信息公开的重要方式,国际投资者可以通过年报详细了解一家企业的业务范围、经营状态和财务情况等。
32-13页-天津医科大学2014就业质量报告

2014年就业质量年度报告2014Report on Quality of Employment2014年12月目录一、就业基本情况 (1)(一)基本数据 (1)(二)毕业生就业单位性质 (3)(三)毕业生就业地区流向 (4)(四)毕业生就业行业分布 (4)二、2014年就业工作新举措 (5)(一)高度重视,切实落实“一把手”工程 (5)(二)注重引导,实践与服务中筑梦基层 (6)(三)贴近需求,开展特殊群体就业帮扶 (6)(四)全员动员,构建立体就业服务体系 (6)(五)创新途径,搭建优质职业实践平台 (8)(六)整合资源,发挥导师资源引导作用 (8)三、就业状况相关调查及分析 (8)1.求职途径分析 (8)2.专业对口度 (9)3.对工作单位的满意度 (9)4.就业工作满意度 (9)四、就业工作对学校教育教学的反馈 (10)五、2015届毕业生就业趋势 (10)一、就业基本情况2014年天津医科大学深入贯彻落实《国务院办公厅关于做好2013年全国普通高等学校毕业生就业工作的通知》(国办发[2013]35号)及《教育部关于做好2013年全国普通高等学校毕业生就业工作的通知》(教学[2012]11号)精神,发挥学校在就业指导、就业服务、就业市场拓展等方面的主体作用。
加大工作力度,以服务意识贯穿毕业生就业工作全过程,在提高毕业生就业质量上下功夫实现了2014届毕业生整体顺利充分就业。
(一)基本数据2014届全校共有毕业生2176人(其中本科生997人;专科生91人;研究生1088人中,含硕士研究生957人、博士毕业生131人)。
1.毕业生基本情况图1-1毕业生结构层次分布其中,2014届本科毕业生生源来自全国29个省(市、自治区)。
来自东部地区省份的人数最多,占到总人数的49.25%,最少的为东北地区,为5.02%。
生源人数最多的5个省市依次是天津、河南、山西、安徽、内蒙古。
研究生生源人数最多的五个省市依次是山东、河北、天津、山西、河南。
阿里巴巴2014年第四季度财务报表
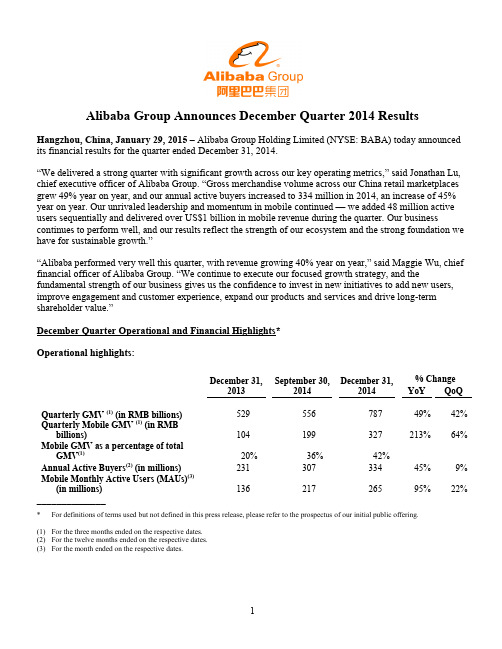
Alibaba Group Announces December Quarter 2014 Results Hangzhou, China, January 29, 2015– Alibaba Group Holding Limited (NYSE: BABA) today announced its financial results for the quarter ended December 31, 2014.“We delivered a strong quarter with significant growth across our key operating metrics,” said Jonathan Lu, chief executive officer of Alibaba Group. “Gross merchandise volume across our China re tail marketplaces grew 49% year on year, and our annual active buyers increased to 334 million in 2014, an increase of 45% year on year. Our unrivaled leadership and momentum in mobile continued — we added 48 million active users sequentially and delivered over US$1 billion in mobile revenue during the quarter. Our business continues to perform well, and our results reflect the strength of our ecosystem and the strong foundation we have for sustainable growth.”“Alibaba performed very well this quarter, with revenue growing 40% year on year,” said Maggie Wu, chief financial officer of Alibaba Group. “We continue to execute our focused growth strategy, and the fundamental strength of our business gives us the confidence to invest in new initiatives to add new users, improve engagement and customer experience, expand our products and services and drive long-term shareholder value.”December Quarter Operational and Financial Highlights*Operational highlights:December 31,2013 September 30,2014December 31,2014% ChangeYoY QoQQuarterly GMV (1) (in RMB billions)529 556 787 49% 42% Quarterly Mobile GMV (1) (in RMBbillions)104 199 327 213% 64% Mobile GMV as a percentage of totalGMV(1)20% 36% 42%Annual Active Buyers(2) (in millions)231 307 334 45% 9% Mobile Monthly Active Users (MAUs)(3)(in millions) 136 217 265 95% 22% ______________* For definitions of terms used but not defined in this press release, please refer to the prospectus of our initial public offering.(1)For the three months ended on the respective dates.(2)For the twelve months ended on the respective dates.(3)For the month ended on the respective dates.Financial highlights:Three months ended December 31,2013 2014RMB RMB US$⑤YoY % Change(in millions, except percentages and per shareamounts)Revenue18,745 26,179 4,219 40% Mobile Revenue 1,171 6,420 1,035 448% Income from Operations 8,801 9,347 1,506 6%Non-GAAP EBITDA⑤⑤11,246 15,103 2,434 34%Non-GAAP EBITDA Margin⑤⑤60% 58% 58%Net Income 8,357 5,983 964 (28%)⑤⑤⑤Non-GAAP Net Income⑤⑤10,463 13,115 2,114 25% Diluted Earnings per Share/ADS(EPS) 3.55 2.29 0.37 (35%)⑤⑤⑤Non-GAAP Diluted EPS⑤⑤ 4.45 5.05 0.81 13%_______________⑤This release contains translation of certain Renminbi (“RMB”) amounts into U.S. dollars (“US$”) for the convenience of the reader, unlessotherwise stated, all translations of RMB into US$ were made at RMB6.2046 to US$1.00, the exchange rate set forth in the H.10 statistical release of the Federal Reserve Board on December 31, 2014. The percentages stated in this release are calculated based on the RMB amounts.⑤⑤See the sections entitled “Non-GAAP Financial Measures” and “Reconciliati on of Non-GAAP Measures to the Nearest Comparable GAAPMeasures” for more information about the non-GAAP measures referred to within this release.⑤⑤⑤D ecrease primarily due to an increase in share-based compensation expense, a one-time charge for financing-related fees and an increase inincome tax expenses in the quarter ended December 31, 2014, as discussed in detail below.GMV –GMV transacted on our China retail marketplaces in the quarter ended December 31, 2014 wasRMB787 billion (US$127 billion), an increase of 49% compared to the same quarter of 2013, and compared to RMB556 billion in the quarter ended September 30, 2014, representing a net addition of RMB231 billion GMV in three months. GMV transacted on Taobao Marketplace in the quarter ended December 31, 2014 was RMB494 billion (US$80 billion), an increase of 43% compared to the same quarter of 2013. GMV transacted on Tmall in the quarter ended December 31, 2014 was RMB293 billion (US$47 billion), an increase of 60% compared to the same quarter of 2013. The GMV growth was primarily driven by an increase in the number of active buyers and also partially attributable to category expansion, for example, auction transactions. On November 11, 2014, our Singles Day promotion generated GMV settled through Alipay of RMB57 billion (US$9.2 billion) on our China and international retail marketplaces within a 24-hour period, an increase of 58% compared to the Singles Day in 2013.Mobile GMV –Mobile GMV in the quarter ended December 31, 2014 was RMB327 billion (US$53 billion), an increase of 213% compared to the same quarter of 2013. Mobile GMV accounted for 42% of total GMV transacted on our China retail marketplaces in this quarter, compared to 36% in the quarter ended September 30, 2014 and 20% in the same quarter of 2013. The growth was primarily driven by an increase in the monthly active users accessing our platforms through mobile devices and an increase in the level of their spending.Annual active buyers–Our China retail marketplaces had 334 million annual active buyers in the twelve months ended December 31, 2014, compared to 307 million in the twelve months ended September 30, 2014 and 231 million in the twelve months ended December 31, 2013, representing an increase of 45% compared to the same period in 2013. The growth in annual active buyers was driven by an increase in active buyers throughout China, with substantially faster growth from lower tier cities.Mobile MAUs–Mobile MAUs grew to 265 million in the month ended December 31, 2014, compared to 217 million in the month ended September 30, 2014, representing a record high net addition of 48 million MAUs in three months, and a 95% increase from 136 million in the month ended December 31, 2013. According to iResearch, our Mobile Taobao App continues to be the No. 1 e-commerce app in China, demonstrating our ability to attract mobile users with strong purchasing intent on a large scale.Revenue–Revenue increased by 40% to RMB26,179 million (US$4,219 million) in the quarter ended December 31, 2014, compared to RMB18,745 million in the same quarter of 2013. Revenue from the China commerce retail business increased by 32% to RMB21,275 million (US$3,429 million), compared toRMB16,149 million in the same quarter of 2013, mainly driven by the growth in commission revenue and online marketing services revenue. Mobile revenue from the China commerce retail business increased by 448% to RMB6,420 million (US$1,035 million) in the quarter ended December 31, 2014, compared to RMB1,171 million in the same quarter of 2013, primarily due to a greater proportion of GMV generated on mobile devices and an increase in the mobile monetization rate.Income from operations – Income from operations in the quarter ended December 31, 2014 was RMB9,347 million (US$1,506 million), an increase of 6% compared to RMB8,801 million in the same quarter of 2013. Operating income growth was lower than revenue growth primarily due to an increase in share-based compensation expense (as discussed in “Share-based compensation expense” below).Non-GAAP EBITDA–Non-GAAP EBITDA increased by 34% to RMB15,103 million (US$2,434 million) in the quarter ended December 31, 2014, compared to RMB11,246 million in the same quarter of 2013. Non-GAAP EBITDA margin was 58% in the quarter ended December 31, 2014, compared to 60% in the December quarter of 2013. The year-on-year decrease in non-GAAP EBITDA margin was primarily due to the consolidation of newly acquired businesses, mainly UCWeb Inc., or UCWeb, and AutoNavi Holding Limited, or AutoNavi, and investments in new business initiatives, such as our mobile operating system, local services and digital entertainment. The quarter-on-quarter increase in non-GAAP EBITDA margin from 51% in the quarter ended September 30, 2014 was primarily due to operating leverage in this seasonally strong quarter.Net income –Our net income in the quarter ended December 31, 2014 was RMB5,983 million (US$964 million), a decrease of 28% compared to RMB8,357 million in the same quarter of 2013. The decrease was primarily due to (i) an increase in share-based compensation expense (including the effect of “mark-to-market” accounting of share-based awards in an amount of RMB1,494 million (US$241 million)) (as discussed in “Share-based compensation expense” below), (ii) an RMB830 million (US$134 million) one-time charge for financing-related fees as a result of the early repayment of our US$8 billion bank borrowings (as discussed in “Interest expense” below), and (iii) an increase in income tax expenses, primarily due to the expiration of an enterprise income tax (“EIT”) exemption period for one of our major subsidiaries (as discussed in “Income tax expenses” below).Non-GAAP net income–Non-GAAP net income increased by 25% to RMB13,115 million (US$2,114 million) in the quarter ended December 31, 2014, compared to RMB10,463 million in the same quarter of 2013.Diluted EPS and non-GAAP diluted EPS –Diluted EPS in the quarter ended December 31, 2014 was RMB2.29 (US$0.37) on 2,588 million diluted shares outstanding, a decrease of 35% compared to RMB3.55 on 2,343 million diluted shares outstanding in the same quarter of 2013. Non-GAAP diluted EPS in the quarter ended December 31, 2014 was RMB5.05 (US$0.81) on 2,588 million diluted shares outstanding, an increase of 13% compared to RMB4.45 on 2,343 million diluted shares outstanding in the same quarter of 2013. The lower non-GAAP diluted EPS growth rate relative to non-GAAP net income growth rate was due to an increase in number of diluted shares outstanding in the quarter ended December 31, 2014 following the completion of our initial public offering in September 2014.December Quarter Financial ResultsRevenue –Revenue for the quarter ended December 31, 2014 was RMB26,179 million (US$4,219 million), an increase of 40% compared to RMB18,745 million in the same quarter of 2013. The increase was mainly driven by the continuing rapid growth of our China commerce retail business. The following table sets forth a breakdown of our revenue for the periods indicated.Three months ended December 31,2013 2014RMB% ofRevenue RMB US$% ofRevenueYoYChange (in millions, except percentages)China commerceRetail 16,149 86% 21,275 3,429 82% 32% Wholesale 612 3% 860 139 3% 41% Total China commerce 16,761 89% 22,135 3,568 85% 32% International commerceRetail 264 2% 554 89 2% 110% Wholesale 1,000 5% 1,209 195 5% 21% Total international commerce 1,264 7% 1,763 284 7% 39% Cloud computing and Internetinfrastructure 196 1% 362 58 1% 85% Others 524 3% 1,919 309 7% 266% Total 18,745 100% 26,179 4,219 100% 40% China commerce retail business –Revenue from our China commerce retail business in the quarter ended December 31, 2014 was RMB21,275 million (US$3,429 million), or 82% of total revenue, an increase of 32% compared to RMB16,149 million in the same quarter of 2013. The increase was mainly driven by the growth in commission revenue and online marketing services revenue. Commissionrevenue accounted for 37% of China commerce retail revenue in the quarter ended December 31, 2014, compared to 30% in the same quarter of 2013. Revenue growth during this period occurred in the context of and reflected an increase of 49% in GMV transacted on our China retail marketplaces, which was primarily driven by a 45% increase in the number of active buyers.The lower revenue growth relative to GMV growth was mainly a result of (i) the higher percentage of total GMV contributed by mobile GMV, which has a lower monetization rate compared to the non-mobile monetization rate, and (ii) lower pay-for-performance (“P4P”) monetization on the personal computer (“PC”) interface compared to the same quarter of 2013. The lower P4P monetization on PC was primarily caused by our continued efforts to improve user experience, which adversely affected cost per click. Our strong momentum in mobile and commitment to improving user experience may slow the growth rate of our online marketing services revenue in the near term, but we believe they will create significant value for both our users and our business in the longer term.Mobile revenue from the China commerce retail business in the quarter ended December 31, 2014 was RMB6,420 million (US$1,035 million), an increase of 448% compared to RMB1,171 million in the same quarter of 2013, representing 30% of our China commerce retail business revenue, compared to 29% in the quarter ended September 30, 2014 and 7% in the same quarter of 2013. The increase in mobilerevenue from the China commerce retail business was primarily due to a greater proportion of GMV generated on mobile devices and an increase in the mobile monetization rate.∙China commerce wholesale business –Revenue from our China commerce wholesale business in the quarter ended December 31, 2014 was RMB860 million (US$139 million), an increase of 41% compared to RMB612 million in the same quarter of 2013. The increase was due to an increase in average revenue from paying members and an increase in paying members.∙International commerce retail business –Revenue from our international commerce retail business in the quarter ended December 31, 2014 was RMB554 million (US$89 million), an increase of 110%compared to RMB264 million in the same quarter of 2013. The increase was primarily due to an increase in GMV transacted on AliExpress, partially attributable to AliExpress’ participation in our Singles Day promotion campaign on November 11, 2014 for the first time.∙International commerce wholesale business –Revenue from our international commerce wholesale business in the quarter ended December 31, 2014 was RMB1,209 million (US$195 million), an increase of 21% compared to RMB1,000 million in the same quarter of 2013. The main reason for this increase was an increase in the number of paying members and an increase in average revenue from payingmembers.∙Others –Other revenue in the quarter ended December 31, 2014 was RMB1,919 million (US$309 million), an increase of 266% compared to RMB524 million in the same quarter of 2013. This increase was primarily due to the consolidation of revenue from acquired business (mainly UCWeb and AutoNavi) and an increase in interest income generated by our SME loan business. When the restructuring of our relationship with Ant Financial closes, which we expect in the March 2015 quarter, we will no longer consolidate revenue generated by the SME loan business in our financial results.Cost of revenue –Cost of revenue in the quarter ended December 31, 2014 was RMB7,520 million(US$1,212 million), or 29% of revenue, compared to RMB4,171 million, or 22% of revenue, in the same quarter of 2013. The increase was primarily due to an increase in share-based compensation expense (as discussed in “Share-based compensation expense” below), an increase in costs associated with our new businesses initiatives, and an increase in payment processing fees resulting from an increase in GMV transacted on our retail marketplaces.Product development expenses – Product development expenses in the quarter ended December 31, 2014 were RMB3,083 million (US$497 million), or 12% of revenue, compared to RMB1,707 million, or 9% of revenue in the same quarter of 2013. The increase was primarily due to an increase in share-based compensation expense (as discussed in “Share-based compensation expense” below). The increase was partially offset by the decrease in royalty fees paid to Yahoo which terminated upon completion of our initial public offering in September 2014.Sales and marketing expenses –Sales and marketing expenses in the quarter ended December 31, 2014 were RMB3,021 million (US$487 million), or 12% of revenue, compared to RMB1,897 million, or 10% of revenue in the same quarter of 2013. The increase was primarily due to an increase in share-based compensation expense (as discussed in “Share-based compensation expense” below). The increase was alsodue to the consolidation of marketing expenses of acquired business (mainly UCWeb and AutoNavi), an increase in advertising and promotional spending mainly to strengthen marketing of our Taobao and Tmall brands, especially in lower tier cities, as well as to promote our new businesses initiatives (e.g., local services) during this quarter.General and administrative expenses – General and administrative expenses in the quarter ended December 31, 2014 were RMB2,419 million (US$390 million), or 9 % of revenue, compared to RMB2,046 million, or 11% of revenue in the same quarter of 2013. The decrease in general and administrative expenses as a percentage of revenue was primarily due to a one-time equity-settled donation expense of RMB1,269 million made in the quarter ended December 31, 2013 relating to the grant of options to purchase 50,000,000 of our ordinary shares to a non-profit organization, which was partially offset by an increase in share-based compensation expense in the quarter ended December 31, 2014 (as discussed in “Share-based compensation expense” below).Share-based compensation expense – Share-based compensation expense included in respective cost or expense items above in the quarter ended December 31, 2014 was RMB4,313 million (US$695 million), or 16% of revenue, an increase of 554% compared to RMB659 million, or 4% of revenue, in the same quarterof 2013. The increase was primarily caused by (1) performance-based and retention grants of share-based awards granted prior to our initial public offering in 2014, with vesting periods of four years for our employees and six years for senior management, (2) the “mark-to-market” accounting of (i) share-based awards we granted to the employees of Zhejiang Ant Small and Micro Financial Services Company Ltd., or Ant Financial, and (ii) Ant Financial’s share-based awards granted by a major shareholding entity of Ant Financial controlled by Jack Ma, our executive chairman, to our employees. The expense arising from such Ant Financial share-based awards granted to our employees represents a non-cash accounting charge to us that will not result in any equity dilution to our shareholders. Without the effect of such “mark-to-market” accounting, our share-based compensation expense would have been RMB2,819 million (US$454 million) in the quarter ended December 31, 2014, compared to RMB2,233 million in the quarter ended September 30, 2014. Pursuant to generally accepted accounting principles in the United States, we are required to perform such re-measurement at each period end. Accordingly, we expect that our share-based compensation expense will continue to be affected by changes in the fair value of our share-based awards as well as the fair value of Ant Financial’s share-based awards granted to our employees.Amortization of intangible assets – Amortization of intangible assets in the quarter ended December 31, 2014 was RMB614 million (US$99 million), a significant increase from RMB123 million in the same quarter of 2013. This increase was due to an increase in intangibles assets primarily as a result of our strategic acquisitions, mainly UCWeb and AutoNavi.Income from operations – Income from operations in the quarter ended December 31, 2014 was RMB9,347 million (US$1,506 million), an increase of 6% compared to RMB8,801 million in the same quarter of 2013. The lower growth of operating income relative to revenue growth in this quarter and the decrease in operating margin to 36% in the quarter ended December 31, 2014 from 47% in the same quarter of 2013 were primarily due to an increase in share-based compensation expense (as discussed in “Share-based compensation expense” above).Non-GAAP EBITDA – Non-GAAP EBITDA increased by 34% to RMB15,103 million (US$2,434 million) in the quarter ended December 31, 2014, compared to RMB11,246 million in the same quarter of 2013.Non-GAAP EBITDA margin was 58% in the quarter ended December 31, 2014, compared to 60% in the December quarter of 2013. The year-on-year decrease in non-GAAP EBITDA margin was primarily due to the consolidation of newly acquired businesses, mainly UCWeb and AutoNavi, and investments in new business initiatives, such as our mobile operating system, local services and digital entertainment. Thequarter-on-quarter increase in non-GAAP EBITDA margin from 51% in the quarter ended September 30, 2014 was primarily due to operating leverage in this seasonally strong quarter. A reconciliation of operating income to non-GAAP EBITDA is included at the end of this release.Interest and investment income, net – Interest and investment income, net in the quarter ended December 31, 2014 was RMB313 million (US$51 million), an increase of 6% compared to RMB296 million in the same quarter of 2013. The increase was primarily due to an increase in interest income as a result of higher cash balance during the period, which in turn was primarily due to the proceeds from our initial public offering in September 2014 and an increase in operating cash flow. This increase was partially offset by an increase in impairment charge of cost-method investments and losses recognized with respect to the periodic revaluation of convertible bonds we held in connection with our strategic investments in publicly traded entities.Interest expense –Interest expense in the quarter ended December 31, 2014 was RMB1,344 million(US$216 million), an increase of 247% compared to RMB387 million in the same quarter of 2013. The increase was primarily due to an RMB830 million (US$134 million) one-time charge for financing-related fees as a result of the early repayment of our US$8 billion bank borrowings with proceeds from our issuance of US$8 billion senior unsecured notes in this quarter.Other income, net –Other income, net in the quarter ended December 31, 2014 was RMB901 million (US$145 million), an increase of 64% compared to RMB548 million in the same quarter of 2013. The increase was primarily due to an increase of RMB101 million (US$16 million) in royalty fees and software technology service fees received from Ant Financial to RMB344 million (US$55 million) in the quarter ended December 31, 2014 from RMB243 million in the same quarter of 2013 as a result of an increase in pre-tax income of Ant Financial, as well as an increase in government grants received from central and local governments in connection with our contribution to technology development and investments in local business districts.Income tax expenses – Income tax expenses in the quarter ended December 31, 2014 were RMB2,429 million (US$392 million), an increase of 228% compared to RMB741 million in the same quarter of 2013. The increase was primarily due to the increase in taxable income from our operations in China. Our effective tax rate increased to 26% in the quarter ended December 31, 2014 from 8% in the same quarter of 2013. Excluding share-based compensation expense, impairment of goodwill, intangible assets and investments, and unrealized gain/loss on investments which are not deductible or assessable for income tax purposes, our effective tax rate would have been 17% in the quarter ended December 31, 2014, compared to 7% in the same quarter of 2013. The increase was primarily due to the expiration of an EIT exemption period for one of our major subsidiaries, upon which the subsidiary became subject to an EIT rate of 12.5% (or 50% of the statutory EIT rate) in calendar year 2014.Net income and non-GAAP net income –As a result of the foregoing, our net income in the quarter ended December 31, 2014 was RMB5,983 million (US$964 million), a decrease of 28% compared to RMB8,357 million in the same quarter of 2013. Excluding the effects of share-based compensation expense, impairment of goodwill and investment in equity investees, the one-time charge for financing-related fees, amortization of intangible assets and certain other items, non-GAAP net income in the quarter ended December 31, 2014 was RMB13,115 million (US$2,114 million), an increase of 25% compared to RMB10,463 million in the same quarter of 2013. A reconciliation of net income to non-GAAP net income is included at the end of this release.Net income attributable to ordinary shareholders – Net income attributable to ordinary shareholders in the quarter ended December 31, 2014 was RMB5,936 million (US$957million), a decrease of 28% compared to RMB8,266 million in the same quarter of 2013.Diluted EPS and non-GAAP diluted EPS –Diluted EPS in the quarter ended December 31, 2014 was RMB2.29 (US$0.37) on 2,588 million diluted shares outstanding, a decrease of 35% compared to RMB3.55 on 2,343 million diluted shares outstanding in the same quarter of 2013. Excluding the effects of share-based compensation expense, impairment of goodwill and investment in equity investees, the one-time charge for financing-related fees, amortization of intangible assets and certain other items, non-GAAP diluted EPS in the quarter ended December 31, 2014 was RMB5.05 (US$0.81), an increase of 13% compared to RMB4.45 in the same quarter of 2013. The lower non-GAAP diluted EPS relative to non-GAAP net income growth rate was due to an increase in the number of diluted shares outstanding in the quarter ended December 31, 2014 following the completion of our initial public offering. A reconciliation of diluted EPS to the non-GAAP diluted EPS is included at the end of this release.Cash –As of December 31, 2014, cash, cash equivalents and short-term investments were RMB130,741 million (US$21,071 million), compared to RMB43,632 million as of March 31, 2014.Cash flow from operating activities and free cash flow – Net cash provided by operating activities in the quarter ended December 31, 2014 was RMB19,408 million (US$3,128 million), an increase of 30% compared to RMB14,922 million in the same quarter of 2013. Capital expenditures in the quarter ended December 31, 2014 were RMB1,513 million (US$244 million), compared to RMB1,601 million in the same quarter of 2013. Capital expenditures in the quarter ended December 31, 2014 included cash outflow for acquisition of land use rights and construction in progress of RMB291 million (US$47 million). Free cash flow, a non-GAAP measurement of liquidity, in the quarter ended December 31, 2014 was RMB22,924 million (US$3,695 million), an increase of 34% compared to RMB17,163 million in the same quarter of 2013. A reconciliation of net cash provided by operating activities to free cash flow, a non-GAAP measure of liquidity, is included at the end of this release.Net cash used in investing activities – During the quarter ended December 31, 2014, net cash used in investing activities of RMB4,817 million (US$776 million) mainly included disbursements for short-term investments of RMB1,944 million (US$313 million), capital expenditure of RMB1,513 million (US$244 million) as well as investment and acquisition activities of RMB2,657 million (US$428 million) primarily in mobile and logistics related businesses.Employee number – As of December 31, 2014, we had a total of 34,081 employees, compared to 33,239 as of September 30, 2014 and 20,884 as of December 31, 2013.Webcast and Conference Call InformationA live webcast of the earnings conference call, which will be held shortly following the release of this announcement, can be accessed at /en/ir/earnings. An archived webcast will be available through the same link following the call. A replay of the conference call will be available for one week (dial-in number: +1 646-254-3697; conference ID: 65377381).Please visit Alibaba Group’s Investor Relations website at /en/ir/home on January 29, 2015 to view the earnings release and accompanying slides prior to the conference call.About Alibaba Group。
6-16 Progress of Electron Accelerators in 2014 at IMP

2014IMP&HIRFL Annual Report·267·CSS software can be used for the development of control system interface based on EPICS architecture,which is widely used in the large-scale scientific apparatus and high energy physics experiments,and has the advantages of high stability,cross platform,open system,etc.In addition,compared to other EPICS based tools such as MEDM, CSS is easier to use and feature rich,so in the C-ADS project,we choose CSS software as the tool for developing control system interface and other functions.The purpose is to get the best running state and control performance.6-16Progress of Electron Accelerators in2014at IMPZhang Zimin,Cao Shuchun and Li ZhongpingIn2014some research works have been carried out by the Electron Accelerator Group at IMP,including the high energy electron radiography(HEER),the electron accelerator design with short pulse for HEER,and a new type low energy electrostatic electron accelerator for industrial applications.The verification experiments of HEER have been accomplished on THU electron accelerator in2013,so more experimental works were proposed to continue with complicated parameters.This year,a specialized beam line for HEER experiment was designed and built,which consists of two dipole magnets,ten quadrapole magnets and some vacuum chambers with diagnostic probes.This beam line uses several uniform quadrupoles as imaging lens to form two imaging mode.Thefirst mode could image an1:1imaging and chromatic dispersion coefficient is very small.The second mode is1:2.84imaging system that use the same lattice with some parameters change of the quadrupoles.Now this beam has been assembled in Lanzhou and the vacuum degree could reach to6.7×10−7Pa. At the same time,we were preparing the future research work for HEER with electron energy up to800∼1000MeV. Firstly,the RF gun with photocathode and pre-acceleration were studied,and the electron energy in this step was supposed to be50∼100MeV.The accelerators with both s-band and c-band were considered to implement the experiments at the beginning,and the c-band one was seemed to be the better choice because of its more compact structure.Then the c-band RF gun and acceleration structure were studied in theoretical approach with Superfish, CST and Parmela.The preliminary design of the c-band linac wasfinished and more detail works are ongoing.In order to satisfy the industrial requirements,a low energy high current dc electron accelerator was developed in2014,which adopting a voltage-doubling type generator to charge the high voltage up to400kV without load and350kV with50mA beam current.The high-voltage generator is designed with multi-player stack,consisting of ten voltage-doubling circuits.A switching-mode power supply based on IGBT inverter for higher efficiency,with 20kHz frequency and20kV AC output voltage,was developed to drive the high-voltage generator.To extract such low energy electron into air for irradiation treatment,the special grid window was designed with20µm Ti-foil.A pair of deflecting magnets was used to make the electron beam into air in perpendicular way to enhance the extraction efficiency and scanning uniformity.In the cooperation with ANL,a pre-research work of the positron target for the international linear collider (ILC)program,named rotation target with friction cooling,was started by EA group.The simulation works show that it is possible to cool down the target heated by10kWγray with friction cooling technology.Meanwhile, the experimental work was also taken into consideration.A prototype rotation plate wheel touched by a pair of graphite pad on both sides near the rim,was running in air instead of vacuum.The pads are connected the wheel with appropriate pressure to keep heat exchange well.On the end of pads there are Cu bodies who calming the pad tightly and cooled byfluid water.A spring assemble is used to support the Cu and pads and adjust the pressure between the pad and wheel.Furthermore,there are some irradiation experiments implemented on the2MeV/40mA electron accelerator in 2014,especially the radiation research for ADS target,which has continued for more than3months.The others were related to material,cell and protection irradiation.All the items mentioned above would be indexed with more detailed description in this annual report.。
2011 Annual Report of China's Paper Industry
2011 Annual Report of China's Paper Industry佚名【摘要】I. Production and Consumption of Paper & Board1. The General Situation of 2011According to the survey made by China Paper Association (CPA), in 2011, there were about 3,500 paper & board manufacturers; their total production of paper & board was 99.30milliontons,【期刊名称】《造纸信息》【年(卷),期】2012(000)008【总页数】14页(P89-102)【关键词】中国造纸协会;年度报告;造纸工业;纸张生产;CPA【正文语种】中文【中图分类】TS7;F426.83According to the survey made by China Paper Association(CPA), in 2011, there were about 3,500 paper & board manufacturers; their total production of paper & board was 99.30 million tons, increased by 7.12% compared to 92.70 million tons in 2010; the total paper & board consumption was 97.52 million tons, increased by 6.31% compared to 91.73 million tons in 2010; paper & board per capita consumption was 73 kg, increased 5 kg. From 2001 to 2011, the total paper & board production of the country increased by 210.31% with an average annual growth rateof 11.99%, total consumption increased by 164.78% with an average annual growth rate of 10.23%. As shown in Fig.1.The production and consumption of the main paper &board grades in 2011 were as follows: The production of newsprint was 3.90 million tons, accounted for 3.93% of the total production and decreased by 9.30% compared to 2010; its consumption was 3.89 million tons, accounted for 3.99% of the total consumption and decreased by 8.04%compared to 2010. The production of uncoated printing& writing papers was 17.30 million tons, accounted for 17.42% and increased by 6.79%; its consumption was 16.87 million tons, accounted for 17.30% and increased by 6.10%.The production of coated printing papers was 7.25 million tons, accounted for 7.30% and increased by 13.28%; its consumption was 5.99 million tons, accounted for 6.14%and increased by 9.11%; of which the production of coated art paper was 6.40 million tons, accounted for 6.45% of the total and increased by 15.32%, its consumption was 5.32 million tons, accounted for 5.46% of the total and increased by 10.83%. The production of household paper was 7.30 million tons, accounted for 7.35% and increased by 17.74%; its consumption was 6.74 million tons, accounted for 6.91% and increased by 18.87%. The production of packaging paper was 6.20 million tons, accounted for 6.24% and increased by 3.33%; its consumption was 6.32 million tons, accounted for 6.48% and increased by 3.27%. The production of white board was 13.40 million tons, accounted for 13.49% and increased by 7.20%; its consumption was 13.22 million tons, accounted for 13.56%and increased by 5.42%; of which the production of coatedwhite board was 12.90 million tons, accounted for 12.99%and increased by 7.50%, its consumption was 12.72 million tons, accounted for 13.04% and increased by 5.65%. The production of liner board was 19.90 million tons, accounted for 20.04% and increased by 5.85%; its consumption was 20.73 million tons, accounted for 21.26% and increased by 6.53%. The production of corrugating medium was 19.80 million tons, accounted for 19.94% and increased by 5.88%;its consumption was 19.91 million tons, accounted for 20.42% and increased by 5.40%. The production of specialty papers & boards was 2.10 million tons, accounted for 2.11%,increased by 16.67%; its consumption was 1.79 million tons,accounted for 1.84% and increased by 9.15%. As shown in Table 1 and Fig.2.The statistic data indicated that the production and consumption of paper & board in 2011 showed a steady growth trend, and the growth rates of production and consumption decreased 0.17 percentage points and 0.74 percentage points respectively compared to 2010.(1) NewsprintIn 2011, the production was 3.90 million tons, decreased by 9.30%. Its consumption was 3.89 million tons, decreased by 8.04% compared to 2010. The average annual growth rates of production and consumption were8.47% and 7.60%respectively from 2001 to 2011. As shown in Fig.3.(2) Uncoated Printing & Writing PapersIn 2011, the production was 17.30 million tons, increased by 6.79%, and the growth amplitude decreased 0.49 percentage points compared to 2010. Its consumption was 16.87 million tons, increased by 6.10% compared to2010,and the growth amplitude decreased 0.11 percentage points compared to 2010. The average annual growth rates of production and consumption were 9.95% and 9.72%respectively from 2001 to 2011. As shown in Fig.4.(3) Coated Printing PapersIn 2011, the production was 7.25 million tons, increased by 13.28%, and the growth amplitude increased 4.81 percentage points compared to 2010. Its consumption was 5.99 million tons, increased by 9.11% compared to 2010,and the growth amplitude decreased 9.46 percentage points compared to 2010. The average annual growth rates of production and consumption were 18.75% and 10.89%respectively from 2001 to 2011. As shown in Fig.5.Of which, the production of coated art paper was 6.40 million tons, increased by 15.32%, and the growth amplitude increased 4.32 percentage points compared to 2010. Its consumption was 5.32 million tons, increased by 10.83%,and the growth amplitude decreased 9.47 percentage points compared to 2010. The average annual growth rates of production and consumption were 19.26% and 10.56%respectively from 2001 to 2011. As shown in Fig.6.(4) Household PaperIn 2011, the production was 7.30 million tons, increased by 17.74%, and the growth amplitude increased 10.84 percentage points compared to 2010. Its consumption was 6.74 million tons, increased by 18.87% compared to 2010,and the growth amplitude increased 11.69 percentagepoints compared to 2010. The average annual growth rates of production and consumption were 10.46% and 9.95%respectively from 2001 to 2011. As shown in Fig.7.(5) Packaging PaperIn 2011, the production was 6.20 million tons, increased by 3.33%, and the growth amplitude increased 1.02 percentage points compared to 2010. Its consumption was 6.32 million tons, increased by 3.27% compared to 2010, and the growth amplitude decreased 0.99 percentage points compared to 2010. The average annual growth rates of production and consumption were 4.48% and 3.09% respectively from 2001 to 2011. As shown in Fig.8.(6) White BoardIn 2011, the production was 13.40 million tons, increased by 7.20%, and the growth amplitude decreased 1.50 percentage points compared to 2010. Its consumption was 13.22 million tons, increased by 5.42% compared to 2010,and the growth amplitude decreased 2.68 percentage points compared to 2010. The average annual growth rates of production and consumption were 16.14% and 12.81%respectively from 2001 to 2011. As shown in Fig.9.Of which, the production of coated white board was 12.90 million tons, increased by 7.50%, and the growth amplitude decreased 1.59 percentage points compared to 2010. Its consumption was 12.72 million tons, increased by 5.65%compared to 2010, and the growth amplitude decreased 2.82 percentage points compared to 2010. The average annual growth rates of production and consumption were 17.83% and 14.17%respectively from 2001 to 2011. As shown in Fig.10.(7) Liner BoardIn 2011, the production was 19.90 million tons, increased by 5.85%, and the growth amplitude decreased 2.82 percentage points compared to 2010. Its consumption was 20.73 million tons, increased by 6.53% compared to 2010,and the growth amplitude decreased 1.04 percentage points compared to 2010. The average annual growth rates of production and consumption were 15.77% and 14.29%respectively from 2001 to 2011. As shown in Fig.11.(8) Corrugating MediumIn 2011, the production was 19.80 million tons, increased by 5.88%, and the growth amplitude decreased 3.16 percentage points compared to 2010. Its consumption was 19.91 million tons, increased by 5.40% compared to 2010,and the growth amplitude decreased 2.05 percentage points compared to 2010. The average annual growth rates of production and consumption were 12.68% and 10.78%respectively from 2001 to 2011. As shown in Fig.12.(9) Specialty Papers & BoardsIn 2011, the production was 2.10 million tons, increased by 16.67%, and the growth amplitude decreased 3.33 percentage points compared to 2010. Its consumption was 1.79 million tons, increased by 9.15%, and the growth amplitude decreased 4.74 percentage points compared to 2010. The average annual growth rates of production and consumption were 12.44% and 7.73% respectively from 2001 to 2011. As shown in Fig.13.According to the statistics released by the National Bureau of Statistics, in 2011, there were 2,620 paper mills which scales are above the statistical threshold. The total number of employees was 708,500. The gross industrial output value was RMB 691.1 billion, increased by 23.10% compared to 2010. The industrial sales value was RMB 674.0billion,increased by 21.60% compared to 2010. The core business income was RMB 671.4 billion, increased by 21.54%compared to 2010. Sales to production ratio was 97.50%,decreased 0.70 percentage points. The products inventory was RMB 28.8 billion, increased by 27.70% compared to 2010. The total pre-tax profits was RMB 55.7 billion,increased by 8.44% compared to 2010, of which total profits was RMB 36.2 billion and increased by 6.20% compared to 2010. The total asset was RMB 699.0 billion, increased by 17.58% compared to 2010. The asset-liability ratio was 59.07%, increased 1.19 percentage points. The total liability was RMB 412.9 billion, increased by 19.99% compared to 2010. 287 mills accounting for 10.95% of 2,620 mills were running with deficit.In 2011, the accomplishment situation of major production and economic indicators is better, the gross industry output value and core business income have a large growth,but the total pre-tax profits and total profits slow down significantly. The products inventory increases significantly,and the sales to production ratio decreases.The major economic indicators from 2001 to 2011 were shown in Fig.14 and Fig.15.According to CPA's survey, in 2011, the total pulp production was 77.23million tons, increased by 5.53%compared to 73.18 million tons in 2010. The total pulp consumption was 90.44 million tons,increased by 6.89% compared to 84.61 million tons in 2010.In which, wood pulp consumption was 21.44 million tons,increased by 15.33%, and the share of wood pulp in total pulp consumption was 24%; non-wood pulp consumption was 12.40 million tons and decreased by 4.39%, accounted for 14% of total pulp consumption; the consumption of pulp from wastepaper was 56.60 million tons and increased by 6.69%, accounted for 62%. The share of imported wood pulp in the total wood pulp increased 1 percentage point;the share of pulp from imported wastepaper in the total pulp from wastepaper decreased 1 percentage point, and the share of pulp from domestic wastepaper was equal to the previous year. In non-wood pulp consumptions, the share of rice & wheat straw pulps decreased 2 percentage points; the share of bamboo pulp was equal to the previous year; the shares of reed pulp and bagasse pulp increased 1 percentage point respectively. In 2011, the total pulp consumption increased 203% compared to 2001, in which the consumption of domestic pulp increased by 210%compared to 2001. As shown in Table 2, Table 3, Fig.16 and Fig.17.1. In 2011, the import amount of paper & board was 3.31 million tons and decreased by 1.49% compared to 3.36 million tons in 2010; the export amount of paper & board was 5.09 million tons and increased by 17.55% compared to 4.33 million tons in 2010; the export amount is 1.78 million tons more than the import. The import amount of pulp was 14.45 million tons, increased by 27.09% from 11.37 million tons in 2010; export amountof pulp was 99,100 tons,increased by 22.35% from 81,000 tons. The import amount of wastepaper was 27.28 million tons, increased by 12.03%from 24.35 million tons; its export amount was 3,600 tons,increased slightly compared to 2010. The import amount of converted paper products was 170,000 tons, decreased by 5.56% from 180,000 tons; its export amount was 2.43 million tons, increased by 6.58% from 2.28 million tons in 2010.In 2011, the total import amount of paper & board, pulp,wastepaper, converted paper products was 45.21 million tons, increased by 15.16% compared to 39.26 million tons in 2010; their total value was USD 23.954 billion, increased by 27.53% compared to USD 18.783 billion in 2010. The average price of imported paper & board was USD 1261.54 per ton, increased by 11.39% compared to USD 1132.52 per ton in 2010. The average price of imported pulp was USD 825.86 per ton, increased by 6.49% compared to USD 775.51 per ton in 2010. The average price of imported wastepaper was USD 255.39 per ton, increased by 16.19% compared to USD 219.80 per ton in 2010.In 2011, the total export amount of paper & board, pulp,wastepaper, converted paper products was 7.6227 million tons, increased by 13.91% compared to 6.6918 million tons in 2010; the foreign currency earned from the export was USD 13.2 billion, increased by 36.08% compared to USD 9.7 billion in 2010. The average price of exported paper & board was USD 1261.04 per ton, increased by 15.32% compared to USD 1093.50 per ton in 2010. The average price of exported pulp was USD 2323.80 per ton, increased by 34.54% compared to USD 1727.18 per ton in 2010. Theaverage price of exported wastepaper was USD 215.79 per ton, increased by 12.51%compared to USD 191.80 per ton in 2010.In 2011, the paper & board grades with larger import amount included liner board, coated white board, coated printing paper and uncoated printing & writing papers, and specialty papers & boards; their total import amount was 2.79 million tons, accounted for about 84% of total import. The paper &board grades with higher export amount included coated printing papers, coated white board, uncoated printing &writing papers, household paper, and specialty papers &boards; their total export amount was 4.69 million tons,accounted for about 92% of total export amount.In 2011, the import amount of pulp and wastepaper increased, in which, the import amount of pulp increased by 27.09% compared to 2010, and the import amount of wastepaper increased by 12.03%. The average prices increased in some extent. The average price of imported pulp increased USD 50.35 per ton, with a growth rate of 6.49%. The average price of imported wastepaper increased USD 35.59 per ton, with a growth rate of 16.19%. But the price of imported pulp and wastepaper began to fall from June, and decreased to USD 752.94 per ton and USD 234.83 per ton respectively in December, already lower than the average price in 2010. The import amount of paper & board decreased slightly,the export amount increased slightly compared to 2010 and was larger than import amount. As shown in Table 4, Table 5,Fig.18 and Fig.19.2. Import and Export of Major Paper Grades from 2001 to 2011In 2011, the main paper & board grades which import amounts were higher than export included packaging paper,liner board, corrugating medium. The main paper & board grades which export amounts were higher than import included newsprint, uncoated printing & writing papers,coated printing papers, household paper, white board,specialty papers & boards and other paper & board.(1) Newsprint: its export exceeded the import and the net export amount was 10,000 tons in 2011, as shown in Fig.20.(2) Uncoated printing & writing paper: its export exceeded the import and the net export amount was 430,000 tons in 2011, as shown in Fig.21. (3) Coated printing papers: its export exceeded the import and the net export amount was 1.26 million tons in 2011,as shown in Fig.22; in which, the export of coated art paper exceeded the import and the net export amount was 1.08 million tons, as shown in Fig.23.(4) Household paper: its export exceeded the import and the net export amount was 560,000 tons in 2011, as shown in Fig.24.(5) Packaging paper: its import exceeded the export and the net import amount was 120,000 tons in 2011, as shown in Fig.25.(6) White board: its export exceeded the import and the net export amount was 180,000 tons in 2011, as shown in Fig.26; in which, the export of coated white board exceeded import and the net export amount was 180,000 tons, as shown in Fig.27.(7) Liner board: the import exceeded the export and the net import amount was 830,000 tons in 2011, as shown in Fig.28.(8) Corrugating medium: its import exceeded the export and the net import amount was 110,000 tons in 2011, as shown in Fig.29.(9) Specialty papers & boards: its export exceeded the import and the net export amount was 310,000 tons in 2011, as shown in Fig.30.According to the survey of CPA, in 2011, the total paper &board production of 12 provinces (regions, cities) in eastern China accounted for 71.7% of the nation's gross, increased 0.1 percentage points compared to 2010; the total production of the 9 provinces (regions, cities) in central China accounted for 20.4%, increased 0.3 percentage points; and the total production of the 10 provinces (regions,cities) in western China accounted for 7.9%, decreased 0.4 percentage point. As shown in Table 6 and Fig.31. There were 16 provinces (regions) where the paper & board production exceeded 1 million tons in 2011: Shandong,Guangdong, Zhejiang, Jiangsu, Henan, Fujian, Hebei, Hunan,Sichuan, Anhui, Hubei, Guangxi, Jiangxi, Chongqing, Tianjin and Hainan, their total production reached 93.05 million tons, accounted for 93.71% of nation's gross, as shown in Table 7, Fig.32.The paper enterprises with paper & board production above 1 million tons in 2011 included Nine Dragons Paper 7.60 million tons, Shandong Chenming Paper Group 3.61 million tons, Lee & Man Paper 3.54 million tons, Shandong Huatai Group 2.55 million tons, Shandong Sun Paper 2.42 million tons, Gold East Paper (Jiangsu) 2.20 million tons, China Paper Corporation 2.10 million tons, Ningbo Zhonghua Paper(including Asia Pulp & Paper) 1.53 million tons, MCC Paper Group 1.31 million tons, ShandongBohui Paper 1.16 million tons, Longchen Paper (China) Co., Ltd. 1.16 million tons.The enterprises with pulp production above 1 million tons in 2011 included Shandong Yataisenbo Pulp & Paper Co.,Ltd. 1.69 million tons, Hainan Jinhai Pulp & Paper 1.24 million tons.In 2011 the regional layout of paper industry changed slightly, the eastern China was still the major paper production region. The production centralization of key provinces/regions and key paper manufacturers increased in some degree. The number of enterprises with paper & board annual production above 1 million tons increased two.According to the industrial statistics of the paper enterprises which scales are above the statistical threshold released by National Bureau of Statistics, in 2011, 65 paper mills were state-owned or state-owned holding, accounted for 2.48% of the total mills, increased 0.33 percentage points compared to 2.15% in 2010; 334 paper mills were“three types of foreign-investment”, accounted for 12.75% and increased 1.63 percentage points compared to 11.12% in 2010; 2221 paper mills were collectivelyowned or other ownerships, accounted for 84.77% and decreased 1.96 percentage points compared to 86.73% in 2010. The core business income of state-owned or stateowned holding paper mills accounted for 11.53% of the nation's total, decreased 0.85 percentage points compared to 12.38% in 2010. The core business income of “three types of foreign-investment” paper mills accounted for 29.41% and increased 0.62 percentage points compared to28.79% in 2010. The core business income ofcollectivelyowned or other ownerships accounted for 59.06% and increased 0.23 percentage points compared to 58.83% in 2010. The total pre-tax profits of state-owned or stateowned holding paper mills accounted for 7.48% of the nation's total, decreased 6.10 percentage points compared to 13.58% in 2010. The total pre-tax profits of “three types of foreign-investment” paper mills accounted for 26.95% and decreased 2.09 percentage points compared to 29.04% in 2010. The total pre-tax profits of collectivelyowned or other ownerships paper mills accounted for 65.57%, increased 8.19 percentage points compared to 57.38% in 2010. In which, the total profit of state-owned or state-owned holding paper mills accounted for 4.54%of the nation's total, decreased 6.82 percentage points compared to 11.36% in 2010; the total profit of “three types of foreign-investment” paper mills accounted for28.86%and decreased 3.14 percentage points compared to 32.00%in 2010; the total profit of collectively-owned or other ownerships paper mills accounted for 66.59%, increased 9.95 percentage points compared to 56.64% in 2010. As shown in Fig.33.Since 2011, National Bureau of Statistics adjusted scale criteria for industrial enterprises only the enterprises with core business income of RMB 20 million or more (RMB 5 million or more in pass years) were included as the statistic data source.In 2011, the number of paper manufacturers which scales were above the statistical threshold was 2,620, and there were 287 paper enterprises operating with deficit in 2011,of which state-owned & state-ownedholding, “three types of foreign-investment” and collectively-owned or other ownerships paper enterprises accounted for 8.71%, 21.60%and 69.69% respectively.The nation's total 2,620 paper enterprises which scales were above the statistical threshold in 2011 could be categorized as large, medium and small scale according to China's standard,435 paper enterprises belongedto large and medium scale,accounted for 16.60% of the total paper & board mills; 2185 paper enterprises belonged to small scale and accounted for 83.40%. The paper & board core business income of large and medium scale paper enterprises accounted for 64.25% of the nation's total, and small-scale accounted for 35.75%; the pre-tax profits of large and medium scale paper enterprises accounted for 62.66% and small-scale accountedfor 37.34%;and the total profits of large and medium scale paper enterprises accounted for 63.62% and small scale accounted for 36.38%, as shown in Table 8.According to the industrial statistics of the Ministry of State Environmental Protection in 2010, the water consumption of pulping & papermaking and paper converting enterprises(the number of surveyed enterprises was 5570, decreased 201 compared with the previous year) was 12.339 billion tons;of which fresh water consumption was 4.615 billion tons and accounted for 8.48% of the total industrial fresh water consumption of 54.395 billion tons. The reused water was 7.724 billion tons and water recycling rate was62.59%, increased 5.55 percentage points compared to 2009. Fresh water consumption per RMB 10,000 output values (current price) was 89.6 tons,decreased by 16.9% (i.e.18.2 tons) compared to 2009. The effluent discharge from paper industry was 3.937 billion tons in 2010, accounted for 18.58% of the nation's total industrial effluent discharge(21.186 billion tons) and decreased 0.2 percentage points.3.78 billion tons of discharged effluent met the discharge regulation, accounted for 96.01% of the total discharge from paper industry and increased 2.48 percentage points.The COD discharge from paper industry was 952,000 tons and decreased 145,000 tons compared to 2009, accountedfor 26.04% of the nation's total industrial COD discharge and decreased 2.89 percentage points. The COD discharge intensity for RMB 10,000 output values (current price) of paper industry was 18 kg, decreased by 28%. As shown in Fig.34. The ammonia nitrogen in discharged effluent was 25,000 tons and decreased 2,400 tons compared to 2009, accounted for 10.19% of the nation′s total industrial ammonia nitrogen emission and decreased 0.99 percentage points. The annual operating cost for wastewater treatment facilities of paper industry was RMB 6.49 billion, increased by 27.25% (i.e. RMB 1.39 billion) compared to previous year.2011 was the first year of the Twelfth Five-Year Plan for National Economic and Social of Development of The People's Republic of China, facing the complex and changeful international economic situation and declining domestic market, some paper enterprises performed poorly, and benefit decreased. However the paper industry achieved steady growth of production and sales after overcoming lots of difficulties such as increasing of energy price, labor cost, raw material price andcomprehensive production cost.In order to keep the steady growth, enhance the overall competitiveness, promote sustainable development,paper industry should accelerate the transformation of development mode, adjust industrial structure, give full play the characteristics of the paper industry “low carbon,gree n and sustainable”, accelerate the transition of paper industry to low-consumption, low-pollution, low-emission,and strive to make breakthroughs at the bottleneck caused by resources, environment and structure.。
动态红黑杂志风格时尚年终汇报PPT模板

HEAD THIS TEXTS
all sunshine without shade, all pleasure without pain,
the happiest
HEAD THIS TEXTS
all sunshine without shade, all pleasure without pain,
the happiest
HEAD THIS TEXTS
all sunshine without shade, all pleasure without pain,
the happiest
HEAD THIS TEXTS
all sunshine witቤተ መጻሕፍቲ ባይዱout shade, all pleasure without pain,
the happiest
2001
2002
2006
2010
2012
2014
CREATIVE PRESENTATION
01
OUR SERVICES
By faith I mean a vision of good one cherishes and the enthusiasm that pushes one to seek its fulfillment regardless of obstacles. By faith I mean a
Content
03 Beginning Say From MO 04 Company & Team Overview
08 Market Analysis 12 Annual Report 2014
20 Facts Of 2014 25 Contact Info
中国造纸工业2014年度报告
5111
3111
1 3116 3117 3118 3119 311: 3121 3122 3123 3124 3125 !ݻ
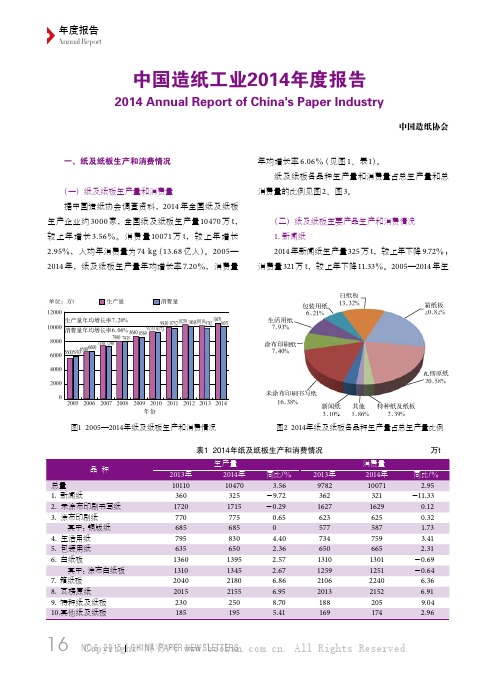
图1 2005—2014年纸及纸板生产和消费情况
ิऄᆩኽ 8/:4&
Ԉጎᆩኽ 7/32&
ӣኽӱ 24/43&
ཱքᆇຘኽ 8/51&
ၒኽӱ 31/93&
ྑᇱኽ 31/69&
ڇ࿋ǖྤu :11
ิׂଉ
ၩݯଉ
911
811
711
611
511
411
311
211
1 3116 3117 3118 3119 311: 3121 3122 3123 3124 3125 ݻ
图6 2005—2014年涂布印刷纸生产量和消费量
ڇ࿋ǖྤu 911
ิׂଉ
ၩݯଉ
811
711
611
174
万t
同比/% 2.95
-11.33 0.12 0.32 1.73 3.41 2.31
-0.69 -0.64
6.36 6.91 9.04 2.96
16 NCOo.6py2r01i5ghCtH©I博NA看PA网. All Rights Reserved.
511
411
311
211
1 3116 3117 3118 3119 311: 3121 3122 3123 3124 3125 ݻ
图7 2005—2014年铜版纸生产量和消费量
ڇ࿋ǖྤu :11
ิׂଉ
ิׂଉ
ၩݯଉ
23111
21111 9111
ิׂଉሺ୲8/31&
- 1、下载文档前请自行甄别文档内容的完整性,平台不提供额外的编辑、内容补充、找答案等附加服务。
- 2、"仅部分预览"的文档,不可在线预览部分如存在完整性等问题,可反馈申请退款(可完整预览的文档不适用该条件!)。
- 3、如文档侵犯您的权益,请联系客服反馈,我们会尽快为您处理(人工客服工作时间:9:00-18:30)。
12Letter from the DirectorI am very pleased to present the Bureau of Safety and Environmental Array Enforcement (BSEE) 2014 Annual Report, the first such report producedby the bureau since its formation in 2011. This report highlights BSEE’sactivities in promoting safety, protection of the environment, andconservation of offshore resources. It also provides a useful summaryof safety performance and environmental compliance trends on theOuter Continental Shelf (OCS), as well as BSEE’s priorities going forward.Our intention is that this will be the first of many periodically producedreports focused on OCS performance.As will be evident as you read through the report, BSEE is focused on thereduction of risk offshore. We pursue this objective through acomprehensive program of regulations, technical assessments,inspections, and incident investigations. In addition, we place greatemphasis on the establishment of a safety culture throughout industry,the cornerstone of this effort being the Safety and EnvironmentalManagement System, or SEMS. SEMS is performance based, and formsa necessary counterpart to our more traditional regulatory oversight activities. We believe this hybrid approach is the most realistic way to take safety to the next level.Part of managing risk is monitoring the trends we are seeing offshore, and gauging the effectiveness of our approach. This not only provides a valuable perspective on risks, it helps direct our future efforts. Moreover, information of this nature needs to be shared among all stakeholders, so that we have a common appreciation for the progress that has been made as well as the challenges ahead. It is in this spirit that we developed this report.In the coming year, you can expect to see further development of many concepts presented in this report, and which BSEE has advanced during 2014. Concepts such as: risk-based inspections, near-miss reporting, a strengthened ability to assess emerging technology, and continued investment in environmental response capability. We will continue to refine the SEMS program. All of these initiatives support a culture of safety and the management of risk, and all will add to our ability to assess trends and share information.A necessary pre-condition for continual improvement is having the necessary talent within our organization. Therefore we will maintain a long-term strategic focus on our workforce, and strive to attract the best talent our Nation has to offer. We will engage with youth, college and university students, returning veterans, and industry professionals in this effort. This will serve not only the internal interests of our Bureau, but more importantly the needs of the public and the industry, both of whom demand a highly knowledgeable and adaptable regulator. We would welcome interest from academia, industry and non-governmental organizations in this regard.It was an exciting year at BSEE in 2014, and 2015 and beyond promise to be equally so. Please review this report and feel free to give us your feedback on how we can improve it to better suit your interests. We value our engagement with you!Sincerely,Brian SalernoDirector3ContentsLetter from the Director (3)Overview of BSEE (6)Mission (6)BSEE Structure (7)Contributing to America’s Energy Needs (8)Focus Areas for BSEE in 2014 (9)Risk Management (9)Safety and Environmental Compliance (10)Organizational Effectiveness (11)Ensuring Transparency (12)People (13)Report from the Regions (14)Gulf of Mexico (15)Pacific (17)Alaska (18)Regulatory Activity in 2014 (19)Inspections (20)Oil Spill Preparedness Verification Audits and Exercises (21)Incidents of Non-Compliance (INCs) (22)Civil Penalties (23)Safety Performance on the OCS (24)Fatalities (26)Injuries (27)Loss of Well Control (30)Fires and Explosions (32)Collisions (35)Spills (38)Lifting Incidents (43)Gas and Hydrogen Sulfide Releases (45)Muster for Evacuation (47)Investigations and Root Causes of Major Incidents (49)Looking Forward (52)45Overview of BSEEMissionThe Bureau of Safety and Environmental Enforcement (BSEE) promotes safety, protects the environment, and conserves energy resources offshore through vigorous regulatory oversight and enforcement.BSEE, a bureau within the U.S. Department of the Interior (DOI), is the United States’ regulator of offshore energy exploration, production, and development. BSEE’s jurisdiction and regulatory responsibilities are defined by the Outer Continental Shelf Lands Act (OCSLA), which outlines federal responsibility over the submerged lands of the Outer Continental Shelf. BSEE ensures compliance with provisions of other federal laws, including the National Environmental Policy Act, the Clean Air Act, the Clean Water Act, the Federal Oil and Gas Royalty Management Act, and Oil Pollution Act of 1990. BSEE uses the full range of authorities, policies, and tools to compel safety, emergency preparedness, environmental responsibility, and appropriate development of offshore oil and natural gas resources. Key functions include:•An offshore regulatory program that develops standards and regulations, and emphasizes a culture of safety in all offshore activities;•Oil spill prevention and preparedness including evaluation of industry oil spill response plans to ensure compliance with regulatory requirements;•Funding scientific research to enhance the information and technology needed to build and sustain the organizational, technical, and intellectual capacity within and across BSEE’s keyfunctions that keeps pace with industry technological improvements, innovates regulation and enforcement, and reduces risk through systematic assessment and regulatory and enforcement actions in order to better carry out the BSEE mission;•Investigations of serious incidents and allegations of unsafe and/or illegal conduct during offshore operations; and•Enforcement of all applicable environmental and operational regulations, as well as ensuring that operators adhere to the stipulations of their approved leases, plans, and permits.6BSEE StructureFigure 1: The organizational structure of BSEE as of December 2014.BSEE’s mission is supported by national offices and divisions located in the Washington, D.C., metro area and three regional offices located in Anchorage, Alaska; New Orleans, Louisiana; and Camarillo, California. The regional offices review and grant permits, perform inspections, issue citations, prepare and refer civil penalties, and investigate incidents. The three headquarters-based divisions—Office of Offshore Regulatory Programs, Oil Spill Preparedness Division, and Environmental Enforcement Division—work with the regional offices to ensure that BSEE’s regulatory responsibilities are carried out effectively. The Office of Offshore Regulatory Programs develops standards and regulations to enhance operational safety and environmental protection for the exploration, production, and development of oil and natural gas on the OCS. The Oil Spill Preparedness Division develops and enforces requirements for offshore operators’ Oil Spill Response Plans, conducts research, and oversees the oil spill response exercise programs. The Environmental Enforcement Division provides sustained regulatory oversight to ensure compliance with all applicable environmental regulations, as well as lease, plan, and permitterms.78Contributing to America’s Energy NeedsThe resources and activity under BSEE’s jurisdiction are vast. Five hundred and twenty-eight million barrels of oil and 1.3 trillion cubic feet of natural gas were produced on the OCS from January toDecember 2014 (Table 1). This offshore oil and gas production accounted for 16 percent of America’s domestic oil production and 5 percent of gas production 1. Table 2 illustrates the diverse types of activities that occur in each of the regions.Table 1: Production by Region in 2014. Alaska Region Gulf ofMexico Region Pacific RegionTotal OCSOil (barrels) 603,698 509,304,746 18,439,833 528,348,277Gas (MCF 2) 30,744,323 1,273,521,681 28,191,781 1,332,457,785Table 2: Offshore Activity and Infrastructure on the OCS by Region in 2014.Alaska Gulf ofMexico PacificDesignated Operators 4 133 6Platforms 13 2,481 23Total Wells Drilled 0 329 21Weekly Average Number ofWorking Drilling Rigs 0 116 14Miles of Pipelines 0 27,267 213The Energy Information Administration projects offshore production will continue to grow through2040, as the pace of development activity quickens and new large development projects, predominantly in the deepwater and ultra-deepwater areas of the Gulf of Mexico (GOM), are brought into production. BSEE approved 317 drilling permits in 2014. Before a permit to drill can be granted, however, there are many direct and related approvals, including environmental compliance that must be in place. To that end, the well may not be drilled within the same calendar year. As a result of current and past approvals, operators drilled 330 wells in 2014.1Data percentages were derived from total domestic oil and gas production numbers listed at .2 MCF = thousands of cubic feet.3 The Alaska Region has one producing project that consists of six producing wells on the Federal OCS from a gravel island located in Alaska State waters.“The resources and activity under BSEE’s jurisdiction arevast. Five hundred and twenty-eight million barrels of oiland 1.3 trillion cubic feet of natural gas were produced onthe OCS from January to December 2014.”Focus Areas for BSEE in 2014In 2014, the Bureau set organizational priorities based on focus areas outlined by Director Salerno: risk management, safety and environmental compliance, organizational effectiveness, transparency, and people. These focus areas strategically prioritize the Bureau’s actions, and are strengthened by BSEE’s guiding principles of clarity, consistency, predictability, and accountability to the American public and the regulated community.Risk ManagementRisk management is critical for BSEE to achieve its mission. In 2014, BSEE made progress to reduce both internal risks to the organization and external risks that the Bureau influences through its operational activities. BSEE reduced internal risks by investing in its people, increasing transparency in its decision-making processes, and implementing lessons learned from previous offshore incidents. BSEE’s ability to recognize, assess, manage, and drive mitigation of external operating risks throughout all offshore activities is critical for effective inspections and permit evaluation and processing. BSEE is able to more efficiently and effectively manage its internal resources and build its capacity to take a proactive position for ensuring safe and responsible offshore energy development by applying a risk management methodology and selectively shifting BSEE oversight from assessing compliance to assessing the effectiveness of operations, technologies, and procedures.The Bureau has undertaken a number of projects to improve risk management and reduce risk. One project is to identify the multiple physical barrier system for all the major modes of offshore operations. This means identifying the successful approach required to fulfill each major mode; to date BSEE has done this for the comparison of conventional drilling and managed pressure drilling, and for production platforms for the flow path of hydrocarbons. Hand in hand with this effort is another project to identify safety critical equipment associated with offshore operations under BSEE’s oversight responsibility.In order to reduce risk, both industry and BSEE need information that can be used to compare outcomes and identify effective mitigation strategies. BSEE helped increase information available to identify and quantify risk across the offshore industry by partnering with the Bureau of Transportation Statistics (BTS) to develop the near-miss reporting system, Safe OCS. BTS is developing the reporting system and will act as a third-party repository of the reported data when operational. The system will provide anonymity to the reporting source and impose substantial legal penalties for anyone who breaks these protections. Safe OCS has enormous potential to increase understanding of potentially severe safety problems that are averted. The aggregate data provided by this system will be publically available on the BTS website, will assist with the identification of leading indicators for incidents, and will inform prevention and mitigation efforts.Cutting-edge offshore technologies also create risks that must be quantified and understood in order to better protect lives and the environment. BSEE invested over $23 million4 to ensure that emerging technologies are thoroughly evaluated through 35 research studies5, strategic partnerships, and providing the start-up funds for the Ocean Energy Safety Institute6 (OESI). The OESI is a collaborative4 During Fiscal Year 2014, extending from October 1, 2013 to September 30, 2014.5 Technology Assessment Programs at BSEE: /Technology-and-Research/Technology-Assessment-Programs/index/6 Ocean Energy Safety Institute at Texas A&M University: /9initiative involving government, academia, and scientific experts. It facilitates research and development, training federal workers on identification and verification of Best Available and Safest Technology (BAST), and implementation of operational improvements in the areas of offshore drilling safety and environmental protection, blowout containment, and oil spill response. From investing in employees and processes to building industry-wide tools, BSEE has actively worked to reduce both internal and external risks throughout 2014.Safety and Environmental ComplianceBSEE continued to promote a robust safety culture and environmental stewardship across the offshore industry in 2014 through its various compliance and research tools.The Safety and Environmental Management Systems (SEMS) program is an important element in these efforts, and forms the cornerstone of a hybrid regulatory approach that emphasizes performance in order to achieve risk reduction offshore. This year, BSEE analyzed the first round of SEMS audits concluded in 2013. BSEE found that system maturity and the level of SEMS awareness and understanding varied significantly among operators. BSEE will continue to work with industry stakeholders on meeting their SEMS requirements, to ensure that companies working offshore create a safety culture that enables operations over and above regulatory compliance. BSEE also will continue to train its own inspectors to look for evidence of a robust safety culture and to evaluate how well the workforce adheres to an operator’s SEMS when they conduct their annual inspections.BSEE continues to verify environmental compliance of permits in order to protect the marine environment. BSEE continued to engage our international regulatory counterparts to share lessons learned, enhance pollution prevention, and coordinate preparations for potential oil spill responses. By engaging U.S. neighbors and other key international partners, BSEE is reducing risks to the shared marine environment, and promoting safety and environmental stewardship that extends beyond international boundaries.Ensuring that appropriate technologies exist to respond to an oil spill is critical for mitigating environmental risks. BSEE invested nearly $14 million in 30 new projects in Fiscal Year 20147 to develop and assess oil spill mitigation options.8 Studies funded by BSEE evaluated the feasibility of response strategies in the Arctic, dispersant efficacy, and remote sensing options that may be used to track oil after a spill. The National Academy of Sciences vetted a BSEE-funded research study9that revised the method and variables that are evaluated in determining whether appropriate capabilities are available to respond to an offshore oil spill. BSEE began to implement these results as practical tools that could support future planning requirements. BSEE continued to manage Ohmsett10, which is the premiere facility for testing, research, and training for oil spill responses. It is the only U.S. facility where full-scale oil spill response equipment can be used in a safe, controlled, and contained simulated marine condition. Using the Ohmsett facility, BSEE researchers conducted six weeks of critical training for oil7 Fiscal Year 2014 extended from October 1, 2013, to September 30, 2014.8 Oil Spill Response Research at BSEE: /Technology-and-Research/Oil-Spill-Response-Research/index/9 A description of the research can be found at: /Technology-and-Research/Oil-Spill-Response-Research/Projects/Project-673/10 More information concerning Ohmsett can be found at: /1011spill response personnel and a large-scale independent testing of dispersant effectiveness under cold water conditions. Through its oil spill response research, BSEE is working to reduce the risk that potential spills could pose to the marine environment.Organizational EffectivenessOver the course of 2014, staff across BSEE contributed to planning strategic program realignments that will help BSEE reduce risk inherent to our internal processes and increase the Bureau’s ability to mitigate external risk across the OCS. These realignments focus on a national program model for core functions such as technology, investigations, enforcement, environmental compliance, and data stewardship. This approach will increase coordination and consistency across BSEE regions, and help BSEE enhance safety and environmental stewardship across the OCS. Planning was completed in 2014, and the national program model will be implemented in 2015.BSEE, recognizing the need to evolve with a dynamic industry, bolstered its technological capacity by establishing the Engineering Technology Assessment Center (ETAC) in Houston. The center, when fully staffed, will serve as a focal point for emerging technology evaluation and provide additional capability for BSEE to enhance its current technology assessment functions. The technology center will leverage BSEE's internal expertise with contract support, while providing a primary point of interaction with the Ocean Energy Safety Institute on technology projects. ETAC will work with industry to increase technologically-focused research and development that could lead to improved technologies that reduce risk across all operations offshore.12Ensuring Transparency BSEE undertakes its mission on behalf of the American public. The Bureau is committed to ensuring that its decisions and actions are driven by data, and are transparent to the public we serve. As such, we must enhance our use of data and make that data readily available to the public, while protecting privacy, proprietary, and business confidential information. To meet these important objectives, BSEE has placed a significant focus on creating a Data Stewardship team, whose primary responsibility is to focus on improving the overall quality and use of our data. Additionally, we are working to ensure the availability of the necessary tools for effective data management and use of data. In 2014, BSEE completed a Business Intelligence pilot to prove the viability of such a tool in our current technology architecture. The pilot was highly successful in demonstrating how we could better use data, and the Bureau is now working to deploy the pilot across the Bureau.BSEE is refining its definition of enforcement and clarifying the objectives of its enforcement function. It also is developing transparent policies for when and how to administer various enforcement tools, which may increase the impact of enforcement on risky industry behaviors. An effective compliance program requires clear and understandable standards, sufficient reporting and recordkeeping to measure compliance, an effective oversight program in the field, a range of enforcement tools graduated to risk, and incentives to move beyond baseline compliance to an effective safety and environmental protection management system.To achieve greater accountability within the federal framework, the Bureau has undertaken a series of agreements with other federal partners over the past several years. BSEE and the U.S. Coast Guardrecognize the importance of consistency for ensuring transparent regulation offshore. In 2014, the two agencies, who share regulatory jurisdiction on the OCS, signed a Memorandum of Agreement (MOA) in 2014.11 The MOA clearly outlines the responsibilities of each agency for inspection and oversight of systems and sub-systems for fixed facilities on the OCS. This memorandum will ensure acomprehensive joint approach in the regulation of these facilities, and offer transparent and consistent expectations to all OCS stakeholders.11MOA between BSEE and the USCG:/uploadedFiles/BSEE/International_and_Interagency_Collaboration/Interagency/Agreements /MOA-2014-USCG-Fixed%20OCS%20Facilities.pdf“BSEE undertakes itsmission on behalf of theAmerican public. TheBureau is committed toensuring that its decisionsand actions are driven bydata, and are transparent tothe public we serve.”13PeopleBSEE is taking steps to meet the consistent challenge of recruiting and retaining top talent. BSEE offers comprehensive technical training, and provides advancement opportunities for employees to become leaders in their fields. In 2014, BSEE initiated a Bureau-wide program that fosters a more inclusive work environment and encourages employees to embrace the value of diversity. Additionally, BSEEcontinues to offer special higher salary rates for grades GS-5 through GS-15 for Petroleum Engineers, Geologists, and Geophysicists within the BSEE Gulf of Mexico Region to more effectively compete with industry for talent. Despite inherent challenges, BSEE was successful in 2014 recruitment efforts. The Bureau hired 88 personnel, a net gain of nine full time equivalent employees, of which 56 were from critical scientific, inspection, and engineering fields. BSEE continues to implement a nationwidetargeted campaign to aggressively recruit from university and professional job fairs. BSEE participates in the Department of the Interior's Youth Initiative and has helped to bring "The offshore" to classrooms in 2014. Moving forward, BSEE will remain committed to hiring, retaining, and fostering the next generation of a highly skilled, qualified, and diverse workforce dedicated to accomplishing BSEE's mission.The Bureau is committed to employee development, as well as retention of a highly technical workforce. BSEE staff leveraged in-house training and external training opportunities held by third parties, including academia, other federal agencies, and industry. We make our training classes available to other federal agencies and, in certain circumstances, other international regulators. In calendar year 2014, BSEE offered 105 training courses with 24,486 contact training hours conducted. One hundred forty five engineers attended an average of three classes each, while 124 inspectors attended an average of approximately four classes each. Additionally, 16 members of the United States Coast Guard (USCG) and three foreign nationals participated.Report from the RegionsBSEE’s three regional offices are: the Gulf of Mexico Region (New Orleans, Louisiana); the Alaska Region (Anchorage, Alaska); and The Pacific (Camarillo, California). Each BSEE region has a common mission and similar responsibilities; however, each Region is charged with oversight of oil and gas operations that present unique challenges and circumstances. The Gulf of Mexico Region has the most extensive exploratory and production activities on the OCS and, as such, involves oversight of a broad range of upstream oil and gas activities. The Pacific Region has not had any new exploration activities in years, yet it continues to have responsibility over a variety of different types of production facilities. In particular, The Pacific staff specialize in the maintenance of maturing assets and the conservation of reservoir resources. The Alaska Region is BSEE’s youngest region, in terms of the stage of exploration and development activities occurring or proposed to occur. The oversight of these frontier operations is critically important as companies explore and plan to develop oil and gas resources in the Alaska OCS.1415Gulf of MexicoThe majority of exploration, production, and development activities occur in the Gulf of Mexico Region. BSEE’s Gulf of Mexico Region faces increasing levels of activity, with deeper wells at higher pressures and temperatures in both shallow and deepwater.During 2014, activity in the Region remained robust, despite the turbulence in the oil and gas markets. There was an increase in deepwater floating drilling rig activity from 40 (19 drill ships and 21semisubmersibles) in 2013 to 52 (33 drill ships and 19 semisubmersibles in 2014). In addition, six new drill ships are expected to start work in the Gulf of Mexico in 2015. The number of deepwater floating production facilities in the Region also increased with the installation of two production spars and two semisubmersible facilities. These new facilities (and associated pipeline infrastructure) have required increased inspection and oversight to ensure the protection of personnel and the environment. BSEE’s Gulf of Mexico Region oversight responsibilities include a readiness to deploy teams of inspectors and investigators in response to offshore incidents. During 2014, Region personnel, along with personnel from BSEE’s Investigations and Review Unit, investigated a number of offshore incidents, including a gas blowout and an explosion resulting in a fatality. Incidents resulting in environmental harm and injuries to personnel also were investigated. The Region reviews and assesses new technologies and theinnovative use of existing technology when projects are still in the concept design phase. To do this, the Region coordinates with headquarter program managers to ensure that BSEE is positioned to effectively and efficiently assess the proposed use of new technologies and operations to identify any risks tooffshore personnel and the environment. During 2014, the Region supported Bureau-wide initiatives to engage international regulators and market participants to share information on risks and common safety and environmental protection priorities. This included meetings with regulators from Denmark, Norway, and the United Kingdom, as well as international oil and gas operators and contractors on specific areas of mutual interest including risks associated with shallow water operations.“BSEE’s Gulf of Mexico Regionfaces increasing levels of activity,with deeper wells at higherpressures and temperatures inboth shallow and deepwater.”BSEE’s Gulf of Mexico Region also continued in 2014 its efforts to engage the next generation of offshore scientists, engineers, and investigators by participating in a number of STEM-related events. In late 2014, the Region hosted seniors from a local high school and taught them about BSEE’s mission toensure safe and responsible offshore operations.1617The BSEE Pacific Region has mature fields and aging infrastructure that are located in close proximity to sensitive marine environments and the coastline. As facilities age and primary production declines, BSEE’s Pacific Region performs increased oversight and focuses on resource conservation . In 2014, the Pacific Region took steps to prepare for aging facility operations and eventual decommissioning. The Pacific Region enhanced its incident investigation program and implemented a preventative program that directly addresses the root causes of recurring incidents. The lessons learned from investigations in the Pacific Region were used to inform issuance of two safety alerts in 2014.12 By initiating studies that augment the investigations process, and enhancing communications to both the public and industry, the Pacific Region worked to balance the concerns of the California community with the responsible development of offshore resources.12 Safety alerts for all regions can be found at /Regulations-and-Guidance/Safety-Alerts/Safety-Alerts/。