Tecplot360培训教程
Tecplot360培训教程
Tecplot360培训教程Tecplot360是一款数据可视化软件,广泛应用于工程、科学和数据分析领域中。
想要掌握Tecplot360的使用技巧和应用方法,就需要接受培训教程的指导,以下是有关Tecplot360培训教程的详细介绍。
一、培训目的Tecplot360培训教程目的是为了让学员能够更好的理解和学习如何使用Tecplot软件对工程和科学数据进行可视化,帮助学员在复杂数据处理和分析中达到更好的效果。
二、培训对象适用于工程师、科学家、学者以及其他需要对数据进行可视化展示和分析的用户。
三、培训内容1. Tecplot360软件介绍对Tecplot360软件的基本介绍,包括软件的特性、功能和应用环境,学员将会了解Tecplot360在数据处理和分析方面的优势和适用范围。
2. Tecplot360软件基础操作对于Tecplot360软件的使用方法和基本操作进行讲解,包括如何创建数据文件、导入数据文件、修改数据文件以及如何使用图形对象等基础操作。
3. Tecplot360软件高级操作除了基础操作以外,还需要学会使用Tecplot360进行高级操作,包括如何创建动态效果、分析大型数据集以及如何使用宏和脚本进行自动化处理等高级操作。
4. Tecplot360应用案例分析通过实际案例展示Tecplot360在工程、科学和数据分析领域的应用,让学员能够更深入的理解Tecplot360的实际应用场景和应用方法。
五、培训形式Tecplot360培训教程采用线上和线下相结合的形式进行,学员可以根据自己的需求选择适合自己的培训方式。
线上培训会通过在线直播、视频教程以及网络课堂等途径进行,线下培训则可以通过实地授课、实际案例分析等方式进行。
六、培训费用Tecplot360培训教程费用根据不同的时间段、培训方式和授课内容而不同,具体费用可以咨询Tecplot360官方渠道或者授权培训机构。
七、结论Tecplot360培训教程是一项非常专业的技能培训,通过接受Tecplot360培训教程的指导,学员将能够更好地掌握Tecplot360软件的使用技巧和应用方法,更好的应对和解决复杂的数据处理和分析问题。
2024版Tecplot360中文教程(最全)

24
可视化效果呈现与优化技巧
01
优化技巧
2024/1/30
02
1. 在制作图表时,应注意数据的量纲和单位,确保图表的准确性和可 读性。
03
2. 对于大量数据,可以使用数据聚合或降维技术,减少图表中的数据 点,提高图表的加载速度和呈现效果。
2024/1/30
图形绘制
图形编辑
支持各种2D和3D图形 绘制,包括线图、散点
图、曲面图等。
19
提供丰富的图形编辑工 具,如缩放、旋转、平
移、裁剪等。
自定义界面风格与快捷键设置
01
自定义界面风格
04
快捷键设置
02
通过“视图”菜单或工具栏中的“界面风格”选项,可以选 择不同的界面风格,如经典风格、现代风格等。
• 安装完成后,启动Tecplot360,进行初步设置,如语言、 单位等。
2024/1/30
15
安装与启动方法
2024/1/30
01
启动方法
02
在桌面或开始菜单找到Tecplot360图标,双击打开。
03
如果是首次启动,可能需要输入许可证信息进行激 活。
16
界面布局及功能区域划分
要点一
菜单栏
包含文件、编辑、视图、工具、窗口和帮助等菜单。
2024/1/30
灵活性
支持多种数据格式和绘图类型,可根据用户需求进行个性化定 制。
7
功能特点与优势分析
2024/1/30
高效率
强大的数据处理和分析功能可大大提 高工作效率和准确性。
跨平台性
可在Windows、Linux和Mac OS等 多个操作系统上运行,方便用户在不 同平台间进行协作和交流。
2024年Tecplot360培训教程(含多场合)

Tecplot360培训教程(含多场合)Tecplot360培训教程一、概述Tecplot360是一款功能强大的科学数据可视化软件,广泛应用于工程计算、流体力学、热力学等领域。
为了帮助用户更好地掌握Tecplot360的使用方法,本文将详细介绍Tecplot360的基本操作、数据处理、可视化设置以及常见问题解决方法。
二、软件安装与启动1.安装包:访问Tecplot官方网站,适用于您操作系统的Tecplot360安装包。
2.安装软件:双击安装包,按照提示完成安装。
安装过程中,请确保安装路径不含中文和空格,以免影响软件运行。
3.启动软件:安装完成后,双击桌面图标或从开始菜单中找到Tecplot360并启动。
4.许可证激活:启动软件后,根据提示输入许可证信息,完成激活。
三、基本操作1.文件操作:新建、打开、保存、另存为等。
2.视图操作:放大、缩小、旋转、平移等。
3.数据导入:支持多种数据格式,如CSV、DAT、TXT等。
4.数据查看:查看数据集、变量、网格等信息。
5.数据处理:数据过滤、插值、计算等。
6.绘图设置:坐标轴、图例、等。
7.输出设置:图片、动画、报告等。
四、数据处理与分析1.数据集操作:合并、拆分、复制、删除等。
2.变量操作:新建、删除、重命名、计算等。
3.网格操作:创建、编辑、删除等。
4.数据分析:统计、曲线拟合、相关性分析等。
5.数据筛选:根据条件筛选数据。
五、可视化设置1.图形类型:散点图、线图、柱状图、等值线图等。
2.颜色映射:自定义颜色映射方案。
3.网格设置:网格线颜色、线型、线宽等。
4.坐标轴设置:坐标轴范围、刻度、标签等。
5.图例设置:图例位置、字体、颜色等。
6.设置:内容、字体、颜色等。
7.动画设置:帧率、播放顺序、输出格式等。
六、常见问题解决方法1.数据导入失败:检查数据格式是否正确,确保数据文件无损坏。
2.图形显示异常:检查数据范围、坐标轴设置是否正确。
3.软件运行缓慢:关闭其他不必要的应用程序,提高计算机性能。
Tecplot360培训教程(PDF 124页)
Manufacturing 3M Applied Materials Caterpillar Ford Motor Company Intel John Deer Monsanto Dept of Defense & US Gov. Electric Boat Edwards AFB Naval Research Lab Naval Surface Warfare Center NIH NIST US ARL US பைடு நூலகம்ood & Drug Admin. Wright Patterson AFB
TECPLOT 专业的绘图与数据分析软件.
GRIDGEN(POINTWISE)专业的网格划分软件
FLOWNEX 管网系统优化设计软件
PHOENICS 建筑通风/暖通/安全 专业的CFD软件
Tecplot 是Tecplot公司推出的绘图和数据分析的通用软件 Tecplot 对于进行数值模拟、数据分析和测试是理想的工具
1.1 工作区 Workspace
文件名 菜单栏
工具栏
边框工具栏
工作区
状态栏
1.2 菜单栏、工具栏、边框工具栏
菜单栏
文件 视图 插入 数据 设置 工具 帮助
编辑
画图
动画
控制框
脚本
分析
工具栏
选择
放大
切片
等值线
输入文本
创建Frame
创建域
调整
移动
旋转
流线
探测
插入几何形状
导出数据
边框工具栏
二维视图: 图形属性 网格图 云图 矢量图 散点图 阴影 边界 域设置 流线图 时间轴 曲线图 标符 柱状图 XY曲线图:
Tecplot360软件界面教程

1.1 工作区 Workspace 文件名
菜单栏 工具栏
边框工具栏
工作区
状态栏
1.2 菜单栏、工具栏、边框工具栏
菜单栏
文件
视图
插入
数据
设置
工具
帮助
编辑
画图
动画
控制框
脚本
分析
工具栏
选择 放大
切片 等值线 输入文本
创建Frame 创建域
调整 移动 旋转
流线
探测 插入几何形状 导出数据
二维视图:
图形属性 网格图 云图 矢量图 散点图 阴影 边界 域 设置 流线图
Zone Style:域性质 Streamtraces:轨迹 Slices:切片 Iso-Surfaces:等值面 Contour/Multi-Coloring:网格、矢量、等高线、散列及颜色设置 Vector:矢量 Scatter:散点 RGB Coloring:颜色设置 Edge Details:边界 Blanking:将图形 消隐 Time Details:时间控制 Light Source:灯光 Advanced 3D Control:三维控制 Label Points and Cells:点和面 标签 Style Linking:轴、网格和域相互关联
时间轴
快速编辑
自动重画
边框工具栏
XY曲线图:
曲线图 标符 柱 状图 图形设置
三维视图增加的部分:
灯光 透明度
等值图 切片图 流线图
1.2.1、File
菜单栏界面具体介绍
New Layout:新建文本框(注意保存) Open Layout:打开文本框 Save Layout:保存 Save Layout as:保存为 Load Data File(s):输入数据文件 Write Data File:输出数据文件 Print Preview: 打印预览 Print:打印 Paper Setup:纸张设置 Publish:输出 超文本格式 Export:输出avi, eps, jpeg等格式 Preferences:参数设置 Exit:退出
Tecplot 360软件界面解读
注: 除最后一个选项外,其他选项的操作都只局限于Tecplot内部
1.2.2、Copy plot to clipboard
4.2、Edit All frame
Work area
1.2.3、View
Redraw Frame/all:刷新当前的图片框 Zoom:放大(平 移键和“-”:缩小) Fit to full size:放大图形使之填满整个图片框 Nice Fit to full size:最佳放大图形使之填满整个图片框 Data fit:适合文本框 Make Current View Nice使当前视图最佳 Center:可以把文本框的图形置于中心位置 Translate/Magnify:平移/放大 Last:恢复Tecplot视图栈中先前的一个视图 Copy View复制视图 Paste View粘贴视图 Workspace工 作空间 调整所选控制框使适合工作空间 调整所有控制框使适 合工作空间 调整纸张使适合工作空间 工作空间最大化
Tecplot 360软件界面
Tecplot 是Tecplot公司推出的绘图和 数据分析的通用软件
Tecplot 对于进行数值模拟、数据分 析和测试是理想的工具
Tecplot 360 主要功能
XY曲线图
Polar图
散点图
2D矢量图
3D Contour图
流线图
等值图
切片图
地形图
粒子图
动画
1.1 工作区 Workspace 1.2 边框工具栏、菜单栏、工具栏 1.3 数据读入与输出 1.4 Excel插件 1.5 创建域(Zones) 1.6 创建框架(Frames) 1.7 创建图案文件(Layouts & Style) 1.8 打印与输出
Tecplot-360软件界面解析讲课稿
1.1 工作区 Workspace
文件名
菜单栏 工具栏
边框工具栏
工作区
状态栏
1.2 菜单栏、工具栏、边框工具栏
菜单栏
文件
视图
插入
数据
设置
工具
帮助
编辑
画图
动画
控制框
脚本
分析
工具栏
选择 放大
切片 等值线 输入文本
创建Frame 创建域
调整 移动 旋转
流线
探测 插入几何形状 导出数据
二维视图:
图形属性 网格图 云图 矢量图 散点图 阴影 边界 域 设置 流线图
注: 除最后一个选项外,其他选项的操作都只局限于Tecplot内部
1.2.2、Copy plot to clipboard
4.2、Edit All frame
Work area
1.2.3、View
Redraw Frame/all:刷新当前的图片框 Zoom:放大(平 移键和“-”:缩小) Fit to full size:放大图形使之填满整个图片框 Nice Fit to full size:最佳放大图形使之填满整个图片框 Data fit:适合文本框 Make Current View Nice使当前视图最佳 Center:可以把文本框的图形置于中心位置 Translate/Magnify:平移/放大 Last:恢复Tecplot视图栈中先前的一个视图 Copy View复制视图 Paste View粘贴视图 Workspace工 作空间
时间轴
快速编辑
自动重画
边框工具栏
XY曲线图:
曲线图 标符 柱 状图 图形设置
三维视图增加的部分:
灯光 透明度
Tecplot 360 Quick Reference Guide
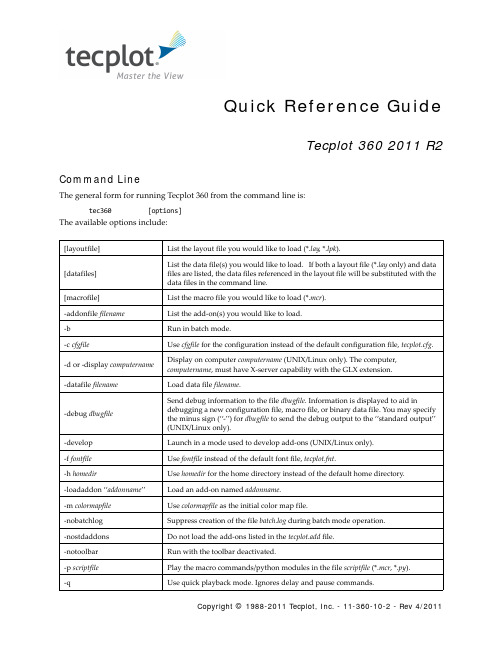
Copyright © 1988-2011 Tecplot, Inc. - 11-360-10-2 - Rev 4/2011Command LineThe general form for running Tecplot 360 from the command line is:tec360[options]The available options include:[layoutfile]List the layout file you would like to load (*.lay , *.lpk ). [datafiles]List the data file(s) you would like to load. If both a layout file (*.lay only) and data files are listed, the data files referenced in the layout file will be substituted with the data files in the command line.[macrofile]List the macro file you would like to load (*.mcr ). -addonfile filenameList the add-on(s) you would like to load.-bRun in batch mode.-c cfgfileUse cfgfile for the configuration instead of the default configuration file, tecplot.cfg . -d or -display computernameDisplay on computer computername (UNIX/Linux only). The computer, computername , must have X-server capability with the GLX extension.-datafile filename Load data file filename .-debug dbugfile Send debug information to the file dbugfile . Information is displayed to aid indebugging a new configuration file, macro file, or binary data file. You may specifythe minus sign (“-”) for dbugfile to send the debug output to the “standard output”(UNIX/Linux only).-develop Launch in a mode used to develop add-ons (UNIX/Linux only).-f fontfile Use fontfile instead of the default font file, tecplot.fnt .-h homedir Use homedir for the home directory instead of the default home directory.-loadaddon “addonname ”Load an add-on named addonname .-m colormapfile Use colormapfile as the initial color map file.-nobatchlog Suppress creation of the file batch.log during batch mode operation.-nostdaddons Do not load the add-ons listed in the tecplot.add file.-notoolbar Run with the toolbar deactivated.-p scriptfile Play the macro commands/python modules in the file scriptfile (*.mcr , *.py ).-qUse quick playback mode. Ignores delay and pause commands.Quick Reference GuideTecplot 360 2011 R22Mouse & Keyboard Shortcuts3D Rotate ToolsContour Add Tool -qm quickpanelfilePlace the macro functions in quickpanelfile in the Quick Macro Panel, instead of using the macros from the default file, tecplot.mcr .-quietTurns off all standard-out messages (UNIX/Linux only).-r printfileSet the filename for routing Print Files to printfile .-s stylefileUse stylefile as a stylesheet for the first frame (*.sty ).-showpanelOpen the Quick Macro Panel upon startup.-v Display the version number.-xRun in full screen mode.-y exportfileSet the filename for export files to exportfile . -z Display macro commands in the Macro Viewer. This allows you to see macrocommands prior to their launch.Click-and-dragRotate about the rotation origin.ALT-Click-and-dragRotate about the viewer position using the active Rotate tool.Middle-click-and-drag/ALT-Right-click-and-dragSmoothly zoom in and out of the data.Right-click-and-dragTranslate the data.CMove the rotation origin to the probed point, ignoring zones.OSet the center of rotation.RSwitch to Rollerball rotation.SSwitch to Spherical rotation.TSwitch to Twist rotation.XSwitch to X-axis rotation.YSwitch to Y-axis rotation.Z Switch to Z-axis rotation.ALT-clickPlace a contour line by probing on a streamtrace, slice, or iso-surface.ClickPlace a contour line.CTRL-clickReplace the nearest contour line with a new line.Click-and-dragMove the new contour line.-Switch to the Contour Remove tool.3Contour Remove ToolGeometry Polyline ToolProbe Tool ClickRemove the contour line nearest to the probed location.+Switch to the Contour Add tool.AAllow translation of polyline segments in all directions.HRestrict translation of the current polyline segment to horizontal.UEnd the current polyline and start a new one.V Restrict translation of current polyline segment to vertical.Click If the pointer is over a single valid cell, the interpolated field values from all nodesin the cell are returned.If multiple cells are candidates, the action is dependent upon the plot type:For 2D, the cell from the highest number zone is used.For 3D, the cell closest to the viewer is used.CTRL-click If the pointer is over a single valid cell, the field values from the nearest node in thecell are returned.If multiple cells are candidates, the action is dependent upon the plot type:For 2D, the cell from the highest number zone is used.For 3D, the cell closest to the viewer is used.If the pointer is not over any cell, then the field values from nearest data point (asmeasured in distance on the screen) are returned.SHIFT-CTRL-click The field values from the nearest point on the screen are returned (ignoringsurfaces, zone number, and depth of the point).This is useful in 3D for probing on data points that are on the back side of a closedsurface without having to rotate the object. In 2D, this is useful for probing on datapoints for zones that may be underneath other zones.ALT-click Probe only on streamtraces, iso-surfaces, or slices.If multiple cells are candidates, the action is dependent upon the plot type:For 2D, the cell from the highest number zone is used.For 3D, the cell closest to the viewer is used.ALT-CTRL-clickProbe only on streamtraces, iso-surfaces, or slices.If multiple cells are candidates, the action is dependent upon the plot type:For 2D, the cell from the highest number zone is used.For 3D, the cell closest to the viewer is used.If the pointer is not over any cell, then the field values from nearest data point (asmeasured in distance on the screen) are returned.4Slice ToolStreamtrace Placement tools (3D Cartesian plots only)Translate/Magnify Tool ALT-CTRL-SHIFT-clickProbe only on streamtraces, iso-surfaces, or slices. The field values from the nearest point on the screen are returned. X, YT, R When probing, press X or Y in XY Line to switch dependencies, or R or T in Polar Line.+Turn on start/end slices, or increment the number of intermediate slices.-Turn off start/end slices, or decrement the number of intermediate slices.Click If no slices are displayed for the current slice group, place the primary slice. Otherwise, move the closest displayed start, end, and primary slice from its currentposition to the clicked position.ALT-click Place the start, end, or primary slice (whichever is closer to the click position) on thenearest derived object (streamtrace, slice or iso-surface).CTRL-click Place the start, end, or primary slice (whichever is closer to the click position) on thenearest data point.I, J, K Switch to slicing constant I, J, or K-planes, respectively. Available for ordered zonesonly.X, Y, Z Switch to slicing constant X-, Y-, or Z-planes, respectively.1-8Switch between slice groups.(Slice groups are available in Tecplot 360 only.)DChange the streamtrace style to streamrods.RChange the streamtrace style to streamribbons.SChange the streamtrace style to surface lines.VChange the streamtrace style to volume lines.1-9Change the number of streamtraces to be added when placing a rake ofstreamtraces.-Reduce the magnification of the data.+Increase the magnification of the data.DragTranslate the data.SHIFT-dragTranslate the paper.SHIFT - -Reduce the magnification of the paper. SHIFT - +Increase the magnification of the paper.5Zoom ToolPicked Object OptionsOther Keyboard Operations ClickCenter the zoom around the location of your click.CTRL-clickCenter the zoom around the location of your click and zoom out.Drag Draw a box to set the frame view.-Reduce the size of the object. If multiple objects are selected, all object positions will be shifted towards the first object selected.+Increase the size of the object. If multiple objects are selected, all object positions will be shifted away from the first object selected.DELDelete picked object(s).CTRL-CCopy picked object(s) to the clipboard.CTRL-VPaste picked object(s) from the clipboard.CTRL-X Cut picked object(s).CTRL-APaste View - Paste stored frame view to current frame.CTRL-D Redraw all frames.CTRL-F Fit Surfaces (3D Only) - Resize plot so that all surfaces are included in the frame, excluding any volume zones.Fit to Full Size (2D, XY, Polar, Sketch) - Fit the entire plot into the frame (including data, text and geometries).CTRL-E Fit Surfaces (3D Only) - Resizes plot so that all data points, text, and geometries are included in the frame.CTRL-L Last - Restore the last frame view.CTRL-O Open a layout file.CTRL-P Print.CTRL-Q Exit.CTRL-R Redraw the current frame.CTRL-S Save the current layout to a file.CTRL-WSave the current layout to a specified file.Macro VariablesVariables Notes|AUXDATASET:Auxname|Retrieves auxiliary data named Auxname from a dataset. For example, |AUXDATASET:Reynolds| retrieves auxiliary data “Reynolds”.|AUXFRAME:Auxname|Retrieves auxiliary data named Auxname from a frame. For example,|AUXFRAME:MyFrame| retrieves auxiliary data “MyFrame” from the active frame.|AUXZONE:Auxname|Retrieves auxiliary data named Auxname from a specific zone. For example, |AUXZONE[3]:BC| retrieves auxiliary data "BC" from zone 3.|AXISMAX n|Maximum value of the n-axis range, where n is one of: A a, R, X, Y or Z.|AXISMIN n|Minimum value of the n-axis range, where n is one of: A a, R, X, Y or Z.|BYTEORDERING|Returns the byte ordering (INTEL or MOTOROLA).|DATASETFNAME|Returns the dataset file name.|DATASETTITLE|Returns the title of the dataset, or “No Data Set” if a dataset does not exist.|DATE|Returns the date in the form of dd Mmm yyyy.|ENDSLICEPOS|Returns the position of the end slice.|EXPORTISRECORDING|Returns YES/NO to help macros complete record commands in the proper order. |FRAMENAME|Returns the name of the active frame.|INBATCHMODE|Returns 1 if in batch mode, 0 if in interactive mode.|ISDATASETAVAILABLE|Returns 1 if a dataset exists, and 0 otherwise.|ISOSURFACELEVEL|Returns the current iso-surface’s iso-value.|LAYOUTFNAME|Returns the current layout file name.|LOOP|Innermost loop counter.|MACROFILEPATH|Returns the path to the directory containing the most recently opened macro file. |MAXB|Maximum value of the blanking variable.|MAXC|Maximum value of the contour variable.|MAXI|, |MAXJ|, |MAXK|[I, J or K]-dimension of the first active zone (2D or 3D Cartesian plots only). For finite-element zones, MAXI returns the total number of nodes, MAXJ returns the total number of elements and MAXK returns the number of nodes per face (cell-based) or total number of faces (face-based).|MAX n|Maximum value of the variable assigned to the n-axis, where n is one of: A a, R, X, Y,or Z.|MAXS|Maximum value of the scatter sizing variable in the active zones.|MAXU|, |MAXV|, |MAXW|Maximum value of the variable assigned to the [X, Y, Z]-vector component of the active zones.|MAXVAR[nnn]|Maximum value of the variable nnn.|MINB|Minimum value of the blanking variable.6|MINC|Minimum value of the contour variable.|MINS|Minimum value of the scatter sizing variable for the active zones.|MINU|, |MINV|, |MINW|Minimum value of the variable assigned to the [X, Y, Z]-vector component for the active zones.|MINVAR[nnn]|Minimum value of the variable nnn.|MIN n|Minimum value of the variable assigned to the n-axis, where n is one of: A a, R, X, Y, or Z.|NUMFRAMES|Number of frames.|NUMFIELDMAPS|Number of fieldmaps assigned to the active frame. |NUMLINEMAPS|Number of linemaps assigned to the active frame.|NUMPROCESSORSUSED|Number of processors used. This may be different than the total number on the machine because of the $!Limits MaxAvailableProcessors configuration file command, or because of a product limitation. Tecplot Focus is limited to one processor, while Tecplot 360 is limited to eight.|NUMVARS|Number of variables in the current dataset.|NUMZONES|Number of zones in the current dataset.|OPSYS|Returns 1=UNIX/Linux/Macintosh, 2=Windows.|PAPERHEIGHT|The height of the paper (in inches).|PAPERSIZE|The size of the paper (e.g. Letter or A4).|PAPERWIDTH|The width of the paper (in inches).|PLATFORMNAME|Returns the type of platform (e.g. SGI or Windows).|PLOTTYPE|Returns the plot type. 0 = Sketch, 1 = XY Line, 2 = 2D, 3 = 3D, 4 = Polar Line. |PRINTFNAME|Returns the file name of the last file sent for printing.|SLICEPLANETYPE|Plane type to which slices are assigned.|SOLUTIONTIME|The current solution time.|SOLUTIONTIME[[ACTIV EOFFSET=]nnn]|Returns the solution time of zone nnn. If ACTIVEOFFSET= is used, the integer value indicates the first zone associated with the nnn th active field map.|STARTSLICEPOS|Position of the first slice.|STREAMSTARTPOS|Streamtrace starting position in X, Y, Z coordinates.|STREAMTYPE|Returns the streamtrace type such as “Surface Line” or “Surface Ribbon”.|TECHOME|Path to the home directory.|TECPLOTVERSION|The version number.|TIME|The current time in the form of hh:mm:ss.|VARNAME|The name of a specified variable.78Dynamic Text |ZONEMESHCOLOR[nnn ]|Returns the color of the mesh for zone nnn .|ZONENAME[nnn ]|Returns the name of zone nnn .a.where A represents the theta (or angle) axis variable in Polar Line plots.VariablesNotes &(AUXDATASET:name )The value of the named auxiliary data attached to the dataset.&(AUXFRAME:name )The value of the named auxiliary data attached to the frame.&(AUXPAGE:name )The value of the named auxiliary data attached to the page.&(AUXVAR[nnn ]:name ) The value of the named auxiliary data attached to variable nnn .&(AUXLINEMAP[Q]:name )The value of the named auxiliary data attached to linemap Q, where Q = either nnn or ACTIVEOFFSET = nnn and nnn = linemap number. If ACTIVEOFFSET= is used, the integer value indicates the first linemap associated with the nnn th activefieldmap.&(AUXZONE[Q]:name )The value of the named auxiliary data attached to Q, where Q = either nnn orACTIVEOFFSET = nnn and nnn = zone number. If ACTIVEOFFSET= is used, theinteger value indicates the first zone associated with the nnn th active fieldmap.&(AXISMAX n )Maximum value of the current n -axis range, where n is one of: A a , R, X, Y, or Z.&(AXISMIN n )Minimum value of the current n -axis range, where n is one of: A a , R, X, Y, or Z.&(BYTEORDERING)Displays the platform’s byte ordering (INTEL or MOTOROLA).&(DATE)The current date, in the format dd Mmm yyyy .&(DATASETFNAME[nnn ])Filename of the nnn th file associated with the current dataset. If nnn is omitted, then all dataset filenames are shown, separated by new lines.&(DATASETTITLE)The current dataset title.&(ENDSLICEPOS[<slice grouporactiveoffset>])The position of the ending slice plane.&(EXPORTISRECORDING)Returns “YES” if recording is active, otherwise returns “NO”.&(FRAMENAME)The frame name.&(INBATCHMODE)Returns a value of 1 if the software is in batch mode, 0 if interactive.&(ISDATASETAVAILABLE)Returns a value of 1 if a dataset exists for the current frame, 0 if nonexistent.&(ISOSURFACELEVEL[<iso surfacegrouporactiveoffset>][nnn])The value of the contour variable on the nnn th iso-surface.&(LAYOUTFNAME)The name of the current layout file.&(LOOP)Innermost loop counter.&(MACROFILEPATH)Path to the folder containing the most recently opened macro file.&(MAX n)Maximum value of the n variable, where n is one of: A a, R, X, Y, or Z. For 2D or 3D Cartesian plots, the value is calculated from all active zones. For line plots, the value is calculated from the zone assigned to the first active linemap.&(MAXB)Maximum value of the blanking variable for the first active constraint. For 2D or 3D Cartesian plots, the value is calculated from the active zones. For line plots, the value is calculated from the zone assigned to the first active linemap.&(MAXC)Maximum value of the contour variable for contour group 1. For 2D or 3D Cartesian plots, the value is calculated from the active zones. For line plots, the value is calculated from the zone assigned to the first active linemap.&(MAXI), &(MAXJ), &(MAXK)[I, J, K]-dimension of the first active zone for 2D and 3D Cartesian plot types. For finite-element data, I represents the number of nodes in the first active zone, J represents the number of elements in the first active zone, and K represents the number of nodes per element (cell-based) or total number of faces (face-based) in the first active zone.&(MAXS)Maximum value of the scatter sizing variable of the active zones.&(MAXU), &(MAXV), &(MAXW)Maximum value of the variable assigned to the [X, Y, Z]-vector component of the active zones.&(MAXVAR[nnn])Maximum value of variable nnn.&(MIN n)Minimum value of the n variable, where n is one of: A a, R, X, Y, or Z. For 2D or 3D Cartesian plots, the value is calculated from all active zones. For line plots, the value is calculated from the zone assigned to the first active linemap.&(MINB)Minimum value of the blanking variable of the first active blanking constraint. For 2D or 3D Cartesian plots, the value is calculated from all active zones. For line plots, the value is calculated from the zone assigned to the first active linemap.&(MINC)Minimum value of the contour variable of contour group 1. For 2D or 3D Cartesian plots, the value is calculated from all active zones. For line plots, the value is calculated from the zone assigned to the first active linemap.&(MINS)Minimum value of the scatter sizing variable for the active zones.&(MINU), &(MINV), &(MINW)Minimum value of the variable assigned to the [X, Y, Z]-vector component for the active zones.&(MINVAR[nnn])Minimum value of variable nnn. &(NUMFRAMES)Number of frames.&(NUMPROCESSORS USED)Number of processors used. This may be different than the total number on the machine because of the $!Limits MaxAvailableProcessors configuration file command, or because of a product limitation. Tecplot Focus is limited to one processor, while Tecplot 360 is limited to eight.&(NUMVARS)Number of variables in the current dataset.&(NUMXYMAPS)Number of XY-linemaps assigned to the current frame.&(NUMZONES)Number of zones in current dataset.&(OPSYS)Displays the current operating system. 1=UNIX/Linux/Macintosh, 2=Windows.&(PAPERHEIGHT)The paper height (in inches).9&(PAPERWIDTH)The paper width (in inches).&(PLATFORM)The platform type (e.g. SGI or WINDOWS).&(PLOTTYPE)Plot type of the current frame: 0 for Sketch, 1 for XY Line, 2 for Cartesian 2D, 3 for Cartesian 3D, and 4 for Polar Line.&(PRIMARYSLICEPOS[<slicegrouporactiveoffset>])The primary slice position.&(PRINTFNAME)The name of the current print file.&(SLICEPLANETYPE[<slicegrouporactiveoffset>])The type of the slice plane (X, Y, Z, I, J or K-planes). &(SOLUTIONTIME)The current solution time.&(SOLUTIONTIME[Q])Solution time of Q, where Q = either nnn or ACTIVEOFFSET = nnn and nnn = zone number. If ACTIVEOFFSET= is used, the integer value indicates the fist zone associated with the nnn th active fieldmap. &(SOLUTIONTIME[5]) displays the solution time of the 5th zone. &(SOLUTIONTIME[ACTIVEOFFSET=3]) displays the solution time of the first zone in the 3rd active fieldmap.&(STARTSLICEPOS[<slicegrouporactiveoffset>])The position of the starting slice plane.&(STRANDID[x])The strandID of a zone in dynamic text.&(STREAMSTARTPOS[nnn])Starting position (X, Y, Z) of the nnn th streamtrace.&(STREAMTYPE[nnn])Type (Surface Line, Volume Line, Volume Ribbon, Volume Rod) of the nnn th streamtrace.&($string)The value of the system environment variable string. &(TECHOME)Path to the home directory.&(TECPLOTVERSION)Displays the version number.&(TIME)The current time, in the format hh:mm:ss.&(VARNAME[nnn])The variable name of variable nnn.&(ZONEMESHCOLOR[Q])Color of the mesh for Q, where Q = either nnn or ACTIVEOFFSET = nnn and nnn = zone number. If ACTIVEOFFSET= is used, the integer value indicates the nnn th active zone for field plots or the zone associated with the nnn th active linemap for line plots.&(ZONENAME[Q])The zone name of Q, where Q = either nnn or ACTIVEOFFSET = nnn and nnn = zone number. If ACTIVEOFFSET= is used, the integer value indicates the nnn th active zone for field plots or the zone associated with the nnn th active linemap for line plots.a.where A represents the theta (or angle) axis variable in Polar Line plots.10Custom Characters11Python Scripting ExamplePython scripts can be run either as macro commands or from the Quick Python Scripts dialog. Consider the following Python module (saved as helloworld.py):import TecUtilimport TecVals#Prepend the name of a module with “TP_” in order to allow the module#to be visible in the Quick Python Scripts dialog.def TP_hello_world():message = "Hello World"TecUtil.DialogMessageBox(message, TecVals.MessageBox_Information)To run the above module, either call the module from a macro file or launch the module from the Quick Python Scripts dialog.Macro FileTo call the Python script helloworld.py from a macro file, add this syntax to the macro file:$!ADDONCOMMANDADDONID = 'Python Utility'COMMAND = 'RUNPYFUNCTION MODULE="helloworld" FUNCTION="hello_world"'Quick Python ScriptsYou can also call a stand-alone Python module using “Quick Python Scripts” in the Scripting menu. To run the Python file helloworld.py, perform the following steps:1.Choose “Quick Python Scripts” from the Scripting menu.2.Click the Browse button and navigate to the folder containing helloworld.py.3.Click the Load button to load the module.4.Choose “hello_world” from the Function window.5.Click the Run button to execute the module.For detailed information on working with Python scripts, please refer to the Scripting Guide. Additional Python examples are available for download at /python. Also, refer to http:// /addons/codegen for a code generator you can use to help create Python script snippets.Additional ResourcesFor detailed information on any of the topics discussed in this guide, refer to the User’s Manual (included in your installation package).For additional information or help with your product, please visit our Tecplot Talk forum(). Tecplot Talk hosts a collection of user-supported forums for each of the Tecplot products. Forums also cover macros, data visualization concepts, installation issues, and more. Tecplot Talk also offers sample add-ons and Python modules freely available for download.12。