WinDbg安装与配置教程
windbg 调试驱动教程
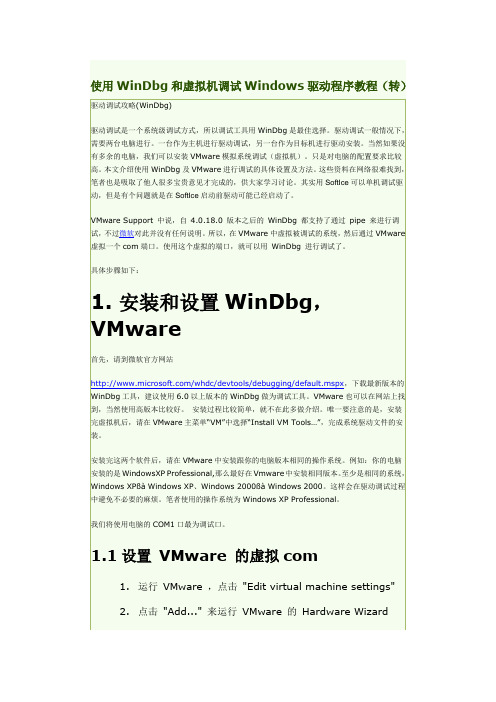
使用WinDbg和虚拟机调试Windows驱动程序教程(转)驱动调试攻略(WinDbg)驱动调试是一个系统级调试方式,所以调试工具用WinDbg是最佳选择。
驱动调试一般情况下,需要两台电脑进行。
一台作为主机进行驱动调试,另一台作为目标机进行驱动安装。
当然如果没有多余的电脑,我们可以安装VMware模拟系统调试(虚拟机)。
只是对电脑的配置要求比较高。
本文介绍使用WinDbg及VMware进行调试的具体设置及方法。
这些资料在网络很难找到,笔者也是吸取了他人很多宝贵意见才完成的,供大家学习讨论。
其实用SoftIce可以单机调试驱动,但是有个问题就是在SoftIce启动前驱动可能已经启动了。
VMware Support 中说,自4.0.18.0 版本之后的WinDbg 都支持了通过pipe 来进行调试,不过微软对此并没有任何说明。
所以,在VMware中虚拟被调试的系统,然后通过VMware 虚拟一个com端口。
使用这个虚拟的端口,就可以用WinDbg 进行调试了。
具体步骤如下:1. 安装和设置WinDbg,VMware首先,请到微软官方网站/whdc/devtools/debugging/default.mspx,下载最新版本的WinDbg工具,建议使用6.0以上版本的WinDbg做为调试工具。
VMware也可以在网站上找到,当然使用高版本比较好。
安装过程比较简单,就不在此多做介绍。
唯一要注意的是,安装完虚拟机后,请在VMware主菜单“VM”中选择“Install VM Tools…”,完成系统驱动文件的安装。
安装完这两个软件后,请在VMware中安装跟你的电脑版本相同的操作系统。
例如:你的电脑安装的是WindowsXP Professional,那么最好在Vmware中安装相同版本。
至少是相同的系统,Windows XPßà Windows XP、Windows 2000ßà Windows 2000。
WinDbg使用教程-英文版
------------------------------------------------------ Kernel Debugging with WinDbgGetting Set UpFundamentalsSelected TechniquesGetting More InformationThe debuggers in Debugging Tools for Windows are powerful, but they have a steep learning curve. This is particularly true for WinDbg and KD, the kernel debuggers used by driver developers (CDB and NTSD are user-space debuggers). The aim of this tutorial is to give a developer experienced with other debuggers enough information to get launched into kernel debugging and to use the Debugging Tools for Windows help file as a reference. The developer is assumed to be familiar with the general concepts of the Windows operating system and the build process.The focus will be mainly on WinDbg, a kernel-mode and user-mode debugger with a graphical interface. KD is more useful for scripts and automated debugging and enjoys the reputation of being the tool of choice of the most serious programmers, but this tutorial will focus on WinDbg and will merely allude to KD from time to time.The target operating system is Windows 2000 or later. Much of what is described here works for Windows NT 4.0, too. Furthermore, the target computer's processor uses x86 architecture. While much here will work for 64-bit targets, no specific attention will be given them.In overview, the tutorial begins with a brief description of setting up for debugging. The bulk of the tutorial is two sections, fundamentals and selected techniques. Fundamentals are the basic and most-often used debugger commands. Selected techniques are those other commands and investigative approaches that will be useful in many situations. This latter section is not, however, an exploration of substantive techniques that might be used to investigate things like deadlocks, memory corruption or resource leaks. On first reading of the tutorial, you may want to skip the selected techniques. The tutorial concludes by pointing to the Microsoft debugger discussion group and the debugger feedback e-mail address for further questions.Getting set upGet the latest!Obtain the latest debugger, and update it regularly. The value of having the latest release can hardly be overstated, because the debugger enjoys frequent improvements and fixes.The debugger can be downloaded at/whdc/devtools/debugging/default.mspx.Host and target connectionThe debugging setup will be a two computer arrangement, connected by a null-modem cable or by a 1394 cable. This tutorial does not examine “local” debugging on a single system (where the debugger examines the computer it is running on). Three computer debugging (target, debugging server and debugging client) will be briefly discussed.A debugging session is a cooperative process between the host-side debugging application (WinDbg or KD) and the target operating system; each party must do something. More specifically, WinDbg is not a “hypervisor operating system” that runs the target as a guest and is a real operating system in its own right. WinDbg is a debugging application in partnership with a target operating system that is aware of its role in the debugging process. In that partnership, the target sends information to and receives information from WinDbg. The communication mechanism must be good, and it must be efficient.A serial protocol is the tried-and-true mechanism for communication between the debugger application and the target system. You connect the host and target machines with a null-modem cable at a COM port at each end. An alternative communication mechanism is 1394. The Debugging Tools for Windows help file describes each of these and how to configure the target system in the topic “Configuring Software on the Target Computer.”Your first sessionYour host computer is assumed to be running Windows 2000 or later. The host operating system can be a different version of Windows than the target operating system. The host computer may be where you do your usual development, maintenance or troubleshooting.It should be connected to the network if you want access to symbol and source servers (see symbols and source).From a Command Prompt window, change the current directory to the installation directory of Debugging Tools for Windows. This is the directory in which windbg.exe and kd.exe arelocated. Type windbg and press Enter. You should see this:WindowingAt this point you can arrange your windows. The following example involves floating windows. Start with the combined window that is the first above. Click on the bar labeled “Command” and drag that bar and its window away from the main frame. Then shrink the main frame, since you can use keystrokes instead of directly using the menu or the buttons.Then use File Kernel Debug to get the protocol popup, and choose 1394 with channel 1. At this point, your desktop looks like this:Then click OK in the Kernel Debugging window.Making the connection activeNow you are ready to make a connection between host and target. Go to the target machine and boot Windows from one of the debugging entries. Immediately go back to the host system, touch the WinDbg command window with the cursor to make it active, and press CTRL+BREAK. In a few seconds you should see this:Don't worry for now about the messages concerning symbols. You have a WinDbg connection to a Windows Server 2003 system. You're in business!A small but crucial thing to understand: The area at the very bottom of the command window shows the “kd>” prompt. That means that WinDbg is ready to accept commands there. If no prompt is displayed, WinDbg cannot process commands at this moment, although any commands you type will be stored in a buffer and executed as soon as possible. You must wait for “kd>” to appear to be sure WinDbg is ready to respond. It is a fact of WinDbg‟s life that sometimes it is busy doing something you cannot see (such as getting information from the target, and the information can be voluminous). The absenceof “kd>” is your only clue that WinDbg is busy. One possibility is that WinDbg is working to resolve a symbol and taking longer than you might expect. Unfortunately, there is also the occasional situation where WinDbg is waiting for something such as connection with a target that will never respond (maybe boot.ini was configured badly, or the wrong option was chosen). You will have to decide when enough time has passed to resort to drastic measures like pressing CTRL+BREAK or, conceivably, stopping WinDbg and starting a new instance.Finding symbols and sourceBy now you are probably eager to start debugging, but there are a few more things you should do, since they will improve your debugging experience enormously.The first thing is to ensure that WinDbg can find the symbols for a module of interest. Symbols indicate to what statement a binary instruction corresponds and what are the variables in force. Symbols map, in other words. You have available the symbols and the source files for your own modules, if they are in the same place as they were at build time. But what if you need to step through some other code that may have been built long before now? Or, for that matter, what if your code isn‟t in the same location where it was built?To explicitly set a location for symbols, use the .sympath command. Break (CTRL-BREAK) in the command window and type.sympathSRV*<DownstreamStore>*/download/symbolsto tell WinDbg to look for symbols on the Microsoft public symbols server. To get WinDbg to use that server and to keep a copy of downloaded symbols in a local store, for example, in D:\DebugSymbols, you would do:.sympath SRV*d:\DebugSymbols*/download/symbols Occasionally you may have trouble in getting symbols from the symbols server. In such a case, begin with the !sym noisy command to get more information about what WinDbg is trying to do to obtain symbols. Next, use !lmi to see what WinDbg knows about the one essential Windows module, ntoskrnl. Then try to get symbols for ntoskrnl, using .reload /f. Thus:kd> !sym noisynoisy mode - symbol prompts onkd> !lmi ntLoaded Module Info: [nt]Module: ntoskrnlBase Address: 80a02000Image Name: ntoskrnl.exeMachine Type: 332 (I386)Time Stamp: 3e80048b Mon Mar 24 23:26:03 2003Size: 4d8000CheckSum: 3f6f03Characteristics: 10eDebug Data Dirs: Type Size VA PointerCODEVIEW 25, ee00, e600 RSDS - GUID: (0xec9b7590,0xd1bb, 0x47a6, 0xa6, 0xd5, 0x38, 0x35, 0x38, 0xc2, 0xb3, 0x1a)Age: 1, Pdb: ntoskrnl.pdbImage Type: MEMORY - Image read successfully from loaded memory.Symbol Type: EXPORT - PDB not foundLoad Report: export symbolsThe syntax of the commands used here is described in the Debugging Tools for Windowshelp file.Exported symbols are usually pretty meager. Debugging Tools for Windows includes asymbol server that can connect to a public symbol store on Microsoft's internet site. Addthis to your symbol path, and then load symbols:kd> .sympathSRV*d:\DebugSymbols*/download/symbolsSymbol search path is: SRV*d:\ DebugSymbols*/download/symbolskd> .reload /f ntSYMSRV:\\symbols\symbols\ntoskrnl.pdb\EC9B7590D1BB47A6A6D5383538C2B31A1\file.ptrSYMSRV: ntoskrnl.pdb from \\symbols\symbols: 9620480 bytes copied DBGHELP: nt - public symbolsd:\DebugSymbols\ntoskrnl.pdb\EC9B7590D1BB47A6A6D5383538C2B31A1\ntoskrnl .pdbkd> !lmi ntLoaded Module Info: [nt]Module: ntoskrnlBase Address: 80a02000Image Name: ntoskrnl.exeMachine Type: 332 (I386)Time Stamp: 3e80048b Mon Mar 24 23:26:03 2003Size: 4d8000CheckSum: 3f6f03Characteristics: 10eDebug Data Dirs: Type Size VA PointerCODEVIEW 25, ee00, e600 RSDS - GUID: (0xec9b7590,0xd1bb, 0x47a6, 0xa6, 0xd5, 0x38, 0x35, 0x38, 0xc2, 0xb3, 0x1a)Age: 1, Pdb: ntoskrnl.pdbImage Type: MEMORY - Image read successfully from loaded memory.Symbol Type: PDB - Symbols loaded successfully from symbolserver.d:\DebugSymbols\ntoskrnl.pdb\EC9B7590D1BB47A6A6D5383538C2B31A1\ntoskrnl .pdbCompiler: C - front end [13.10 bld 2179] - back end [13.10 bld2190]Load Report: public symbolsd:\DebugSymbols\ntoskrnl.pdb\EC9B7590D1BB47A6A6D5383538C2B31A1\ntoskrnl .pdbWhile symbols will give you some information, they do not provide source code. In the simplest case, source files will be found in the same place they were at build time (the location will be in the binary and symbol files). But in many cases, they cannot be foundthere (they may have been moved), and you must specify where to look. For that you need a source path, for example,.srcpath e:\Win2003SP1That means: For source files, look in the e:\Win2003SP1 directory.Another solution is to name a source server, if you have one:.srcpath \\MySrcServerIf you experience trouble in getting source files, you should do .srcnoisy 1 to get more information about what the debugger is doing to find them.WorkspacesYou‟ve not begun act ual debugging, yet you have done a good deal of typing already. A lot of the settings can be kept in a workspace. So you might use File Save to save the settings in a workspace, perhaps one you name kernel1394Win2003. After that, you could start WinDbg with that workspace:windbg -W kernel1394Win2003 -k 1394:channel=1where –W specifies a workspace and –k gives the communication protocol (refer to the Debugging Tools for Windows help file under “WinDbg Command-Line Options”). Note: You should be careful to preserve lower and upper case in the command-line options you give to WinDbg or KD.To make things easier, you can put a shortcut on your desktop to start WinDbg with the desired workspace, for example, with a 1394 connection:The contents of the file above are:cd /d "d:\Program Files\Debugging Tools for Windows"start windbg.exe -ySRV*d:\DebugSymbols*/download/symbols -Wkernel1394Win2003The first line makes the Debugging Tools for Windows installation directory the current directory, to ensure that debugger modules will be found. The second line starts WinDbg, specifying a symbol path (-y) and workspace (-W).A sample driverIt will be helpful to exercise WinDbg with the sample driver IoCtl. This can be found in the Windows Device Driver Kit (DDK) and its successor, the Windows Driver Kit (WDK). Install this kit and look in the src\general\Ioctl subdirectory. The advantages of IoCtl are that it is simple and that it is a “legacy” driver, that is, one loaded by the Service Cont rol Manager (SCM) and not a part of Plug-and-Play (the in‟s and out‟s of PnP are not of interest here).You should build both the user-space executable (ioctlapp.exe) and the kernel-space driver (sioctl.sys), since the former will load the latter.Here is something fairly important to understand. The build process is quite smart about optimizing code, and optimization can result in code movement (logic is of course preserved) and in keeping variable values solely in registers. To ensure a straightforward debugging experience, you should produce a checked build with this compiler directive given in the build window or in the appropriate sources file:MSC_OPTIMIZATION=/Od(That is “Oh d” and not “zero d.”)Sometimes the above will result in a build problem with intrinsic functions like memcmp. If you run into that problem, try:MSC_OPTIMIZATION=/OdiPlease understand that preventing optimization is not a good choice for a production build. With the above directive, you would not be creating and would not be testing a production-type build. It is nonetheless a good practice to start testing with non-optimized builds and, once you are familiar with the code and have eliminated the simpler errors, to advance to production builds. When you have to deal with optimized code, you will find some assistance in dealing with optimized code.Starting to debug the sample driverSet a breakpoint in IoCtl at DriverEntry. Before starting the driver, break into the WinDbg command window and type this:bu sioctl!DriverEntryThe bu(“Breakpoint Unresolved”) command defers the actual setting of the breakpoint until the module is loaded; at that point, WinDbg will look in it for “DriverEntry.” Since there is nothing more to do now, hit F5 (or you could type g, “Go”).Next, copy ioctlapp.exe and sioctl.sys to a place on the target system such asC:\Temp\IOCTL, log in with Administrator privileges on that system, and makeC:\Temp\IOCTL the current directory in a command window there. (You need not put thispath into a symbol path or source path in WinDbg.) In that same command window, type ioctlapp and press Enter; in WinDbg you will see:In the above, after execution stopped at the breakpoint, the !lmi command showed that WinDbg did pick up the symbols from a DDK build. The timestamp is about what you would expect, and the location of the symbol file is exactly that expected.Depending on your docking arrangement, it may not be obvious, since windows can be hidden by other windows, but you will have a source code window somewhere (the key sequence …alt-Ke ypad *‟ ― without single quotation marks ― will bring that window to the front):The line marked in pink (the Debugging Tools for Windows help file calls it purple) is where the breakpoint was set and is where execution stopped. Have execution proceed down to IoCreateDevice (controlling execution says how this might be accomplished):Here you see again the original breakpoint (highlighted in red, since now control is stopped there), and you see the current statement marked in dark blue.FundamentalsThat was a “test drive” in a debugging session. Here are the debugger‟s basic operations. Commands, extensions, etc.Commands come in several families: Plain (unadorned), ones beginning with a period (“.”) and ones beg inning with an exclamation point (“!”). The Debugging Tools for Windows help file describes these families as commands, meta-commands and extension commands, respectively. For present purposes, the families are pretty much the same.BreakpointsCausing an interruption in execution is one of the basic capabilities of the debugger. Here are some ways that can be done.∙Breakin at operating system startup.To get a break at the earliest point in operating system startup, be sure WinDbg isproperly connected, and do the key sequence CTRL-ALT-K repeatedly until you see:At the next boot, the operating system will halt very shortly after ntoskrnl hasstarted but before any drivers have been loaded, and WinDbg will get control. This is when you may wish to define breakpoints for drivers to be started at boot time.∙Ordinary breakpointsThe simplest breakpoints are those set via the bp(“Breakpoint”) command. For example:bp MyDriver!xyzbp f89adeaaIn the first, the breakpoint is at a name in a module (<module>!<name>); in the second, it is at the given address. When execution reaches one of those points, the operating system halts and gives control to WinDbg. (You will see how to get the address for the second command in finding a name.)Note: The syntax of the first command assumes that the operating system hasloaded the module and that enough information is available through a symbol file or through external names to identify xyz. If xyz cannot be found in the module, the debugger will say so.∙Deferred breakpoints.Speaking of drivers that haven‟t loaded, your very first breakpoint, set by bu (see starting to debug the sample driver above), was a “deferred” breakpoint. The bu command takes as a parameter the module and a name in it, for example:bu sioctl!SioctlDeviceControlwhere SioctlDeviceControl is an entry point or other name in the module sioctl.sys.This form assumes that when the module is loaded, enough information will beavailable to identify SioctlDeviceControl so that the breakpoint can be set. (If the module is already loaded and the name is found, the breakpoint is set immediately.) If the operating system cannot find SioctlDeviceControl, the debugger will say so, and there will be no halt at SioctlDeviceControl.A useful characteristic of deferred breakpoints is that they operate onmodules!names, whilst ordinary breakpoints operate on addresses or onmodules!names immediately resolved into addresses. Another feature of deferred breakpoints is that they are remembered across boots (that wouldn‟t make sense for address-expressed breakpoints). Yet another characteristic is that a deferredbreakpoint is remembered if the associated module is unloaded, whilst an ordinary breakpoint is removed when the module is unloaded.∙Another way to set an ordinary breakpoint is via a source window. Return to sioctl.sys. When you broke at DriverEntry, you could have scrolled the window down to some place where you wished to stop, placed the cursor on the desired line and hit F9:The line in red is the breakpoint set via F9.To see all the breakpoints you‟ve defined, use the bl(“Breakpoint List”) command: kd> bl0 e [d:\winddk\3790\src\general\ioctl\sys\sioctl.c @ 123]0001 (0001) SIoctl!DriverEntry1 e [d:\winddk\3790\src\general\ioctl\sys\sioctl.c @ 338]0001 (0001) Sioctl!SioctlDeviceControl+0x103Notice a couple of things: Each breakpoint has a number, and breakpoint status is shown, “e” for “enabled” or “d” for “disabled.”∙Now suppose you wish to take a breakpoint temporarily out of operation. bd (“Disable Breakpoint”) would do the trick. You have to specify just the breakpoint number:kd> bd 1kd> bl0 e [d:\winddk\3790\src\general\ioctl\sys\sioctl.c @ 123]0001 (0001) SIoctl!DriverEntry1 d [d:\winddk\3790\src\general\ioctl\sys\sioctl.c @ 338]0001 (0001) SIoctl!SioctlDeviceControl+0x103∙In a similar way, to remove breakpoint number 1 permanently, use bc 1(“Clear Breakpoint”). Now that breakpoint will be gon e from the breakpoint list.∙Well and good. Sometimes, however, a breakpoint is set at a very busy place in the operating system or a driver, and you may want to apply some conditions orconditional actions so that the breakpoint stops only under those circumstances.Here is the basic form:bp SIoctl!SioctlDeviceControl+0x103 "j (@@(Irp)=0xffb5c4f8) '';'g'"The meaning of this is: Break only if the pointer Irp equals the address 0xFFB5C4F8;if that condition is not met, proceed.To go deeper into the above, the breakpoint is not itself conditional. Rather, thebreakpoint has an action clause (in double quotation marks); in that clause, thecommand j(“Execute IF/ELSE”) is a conditional action. j's function is to execute its TRUE|FALSE clauses (in single quotation marks). In the above, the TRUE clause (first) is empty, so that when the breakpoint fires and the TRUE condition is met, WinDbg would do nothing more than the default of halting. If the FALSE clause (second) is met, execution would proceed, by executing g. One action or the other would bedone, depending on the condition in force.Consider next this slightly more elaborate form of the above:bp SIoctl!SioctlDeviceControl+0x103 "j (@@(Irp)=0xffb5c4f8)'.echo Found the interesting IRP' ; '.echo Skipping an IRP of nointerest; g' "Here the TRUE clause puts out a message and stops. The FALSE clause puts out a message and continues (a message is helpful because WinDbg would evaluate the condition to FALSE and would otherwise go on silently).Something to note: The following breakpoint, where register Eax is tested (you will find registers treated more thoroughly in registers), won‟t work as you might expect: bp SIoctl!SioctlDeviceControl+0x103 "j (@eax=0xffb5c4f8) '.echoHere!' ; '.echo Skipping; g' "The reason is that evaluation may “sign-extend” the register‟s value to 64 bits, i.e., to 0xFFFFFFFF`FFB5C4F8, and that would not match 0x00000000`FFB5C4F8. This will be a issue only if the highest bit of the 32-bit value is 1 and if some otherconditions (for example, a 32-bit register) apply. “Sign Extension” in the Debugging Tools for Windows help file gives details (see also “Setting a Conditional Breakpoint”there).A breakpoint may have conditions, with or without conditional actions. One conditionis “one-shot” firing: The breakpoint is to fire only once (it is cleared after being hit).This is handy for a very high-traffic piece of code where you are interested in the first hit only.bp /1 SIoctl!SioctlDeviceControl+0x103Another useful condition is a test for a process or thread:bp /p 0x81234000 SIoctl!SioctlDeviceControl+0x103bp /t 0xff234000 SIoctl!SioctlDeviceControl+0x103which mean, respectively, Stop at the indicated point only if the process block(EPROCESS) is at 0x81234000, and Stop at the indicated point only if the thread block (ETHREAD) is at 0xFF234000.Conditions can be combined:bp /1 /C 4 /p 0x81234000 SIoctl!SioctlDeviceControl+0x103The meaning here is, Break once but only when the call stack depth is greater than four (here capitalization of “C” is significant, because “c” means “less than”) and the process block is at 0x81234000.A different kind of breakpoint is one that is specified for access. For example,ba w4 0xffb5c4f8+0x18+0x4The address was taken from the IRP whose address you saw above, and at the offset 0x18+0x4 into the IRP is the rmation member. So the breakpoint willfire when something attempts an update of the four bytes constitutingrmation in that IRP. Such breakpoints are called data breakpoints(because they are triggered by data access) or processor breakpoints (because they are implemented by the processor, not the debugger itself).Expressions: MASM versus C++You will probably agree that it is handy to use a variable in a driver program to provide a parameter value like process address. Doing that, however, demands that you understand something of debugger expressions.The debugger has two ways of evaluating expressions, referred to “MASM” (Microsoft Ma cro Assembler) and “C++.” To quote the Debugging Tools for Windows help file under “MASM Expressions vs. C++ Expressions”:In a MASM expression, the numerical value of any symbol is its memory address. Ina C++ expression, the numerical value of a variable is its actual value, not itsaddress.Reading and re-reading that section will repay your time well.An expression will be evaluated by MASM rules, C++ rules or a combination. In brief,1.The default expression type is MASM.2.The default type can be changed by .expr (see the Debugging Tools for Windowshelp file).3.Certain commands always use C++ evaluation.4.Evaluation of a specific expression (or part of an expression) can be changed tothe form opposite to the usual expression type by prefixing the expression with“@@.”Even this summary is fairly involved, and you should refer to “Evaluating Expressions” in the Debugging Tools for Windows help file for the details. For now, here are a few examples to give a sense of how evaluation works.Earlier you were stopped at Sioctl!SioctlDeviceControl+0x103, so use dv to look at a variable known there (see the dv command for more information):kd> dv IrpIrp = 0xff70fbc0The response means, The variable Irp contains 0xFF70FBC0. Further, dv is interpreting its parameter in C++ terms, in that the response is based on the variable‟s content and not on its address. You can confirm that so:kd> ?? Irpstruct _IRP * 0xff70fbc0since ?? always functions on the basis of C++ (see the ?? command). For the MASM type of evaluation, try ? (see the ? command):kd> ? IrpEvaluate expression: -141181880 = f795bc48which means, The variable Irp is located at 0XF795BC48. You can confirm that the variable at that location truly does contain the value 0xFF70FBC0 by displaying memory via dd (see the dd command):kd> dd f795bc48 l1f795bc48 ff70fbc0And the storage pointed to is:kd> dd 0xff70fbc0ff70fbc0 00940006 00000000 00000070 ff660c30ff70fbd0 ff70fbd0 ff70fbd0 00000000 00000000ff70fbe0 01010001 04000000 0006fdc0 00000000ff70fbf0 00000000 00000000 00000000 04008f20ff70fc00 00000000 00000000 00000000 00000000ff70fc10 ff73f4d8 00000000 00000000 00000000ff70fc20 ff70fc30 ffb05b90 00000000 00000000ff70fc30 0005000e 00000064 0000003c 9c402408This indeed looks like an IRP, as dt shows (see the dt command), since the Type and Size members have plausible values:kd> dt IrpLocal var @ 0xf795bc48 Type _IRP*0xff70fbc0+0x000 Type : 6+0x002 Size : 0x94+0x004 MdlAddress : (null)+0x008 Flags : 0x70+0x00c AssociatedIrp : __unnamed+0x010 ThreadListEntry : _LIST_ENTRY [ 0xff70fbd0 - 0xff70fbd0 ]+0x018 IoStatus : _IO_STATUS_BLOCK+0x020 RequestorMode : 1 ''+0x021 PendingReturned : 0 ''+0x022 StackCount : 1 ''+0x023 CurrentLocation : 1 ''+0x024 Cancel : 0 ''+0x025 CancelIrql : 0 ''+0x026 ApcEnvironment : 0 ''+0x027 AllocationFlags : 0x4 ''+0x028 UserIosb : 0x0006fdc0+0x02c UserEvent : (null)+0x030 Overlay : __unnamed+0x038 CancelRoutine : (null)+0x03c UserBuffer : 0x04008f20+0x040 Tail : __unnamedSometimes you will want to employ C++ evaluation inside a MASM expression. The “@@” prefix achieves that. Since extensions always use parameters as MASM expressions, you can see the effect of @@ when it is employed with the extension!irp (see IRPs): kd> !irp @@(Irp)Irp is active with 1 stacks 1 is current (= 0xff70fc30)No Mdl System buffer = ff660c30 Thread ff73f4d8: Irp stack trace.cmd flg cl Device File Completion-Context>[ e, 0] 5 0 82361348 ffb05b90 00000000-00000000\Driver\SIoctlArgs: 00000064 0000003c 9c402408 00000000。
WinDbg的安装、配置和功能
WinDbg的安装、配置和功能⼀、WinDbg简介WinDbg是微软发布的⼀款免费⽽⼗分强⼤的调试⼯具。
既然是微软⾃⼰发布的调试⼯具,那它对微软产品的调试当然是⼗分的强⼤。
Windows 调试器 (WinDbg) 可⽤于调试内核模式和⽤户模式代码,来分析故障转储,并检查代码时 CPU 寄存器执⾏,同时也是⼀款相当优秀的源码级(source-level)调试⼯具。
相⽐较于Visual Studio,它是⼀个轻量级的调试⼯具,所谓轻量级指的是它的安装⽂件⼤⼩较⼩,但是其调试功能,却⽐VS更为强⼤。
⼆、获取和安装2.1、获取途径可以将Windows调试⼯具作为开发⼯具包的⼀部分或作为独⽴⼯具集获取:作为WDK的⼀部分Windows的调试⼯具包含在Windows驱动程序⼯具包(WDK)中。
.作为Windows SDK的⼀部分Windows软件开发⼯具包(SDK)中包含Windows调试⼯具。
要下载安装程序或ISO映像,请参阅Windows开发⼈员中⼼上的作为独⽴的⼯具集通过开始安装Windows SDK,然后在要安装的功能列表中仅选择Windows的调试⼯具(并清除所有其他功能的选择),可以在不安装Windows SDK或WDK的情况下单独安装Windows的调试⼯具。
要下载安装程序或ISO映像,请参阅Windows开发⼈员中⼼上的2.2、安装安装过程略下⾯是安装后的截图作为独⽴⼯具集安装后作为SDK⼀部分安装后启动后的界⾯三、配置安装好之后就需要配环境变量,打开环境变量配置界⾯我的电脑->右键属性->⾼级系统设置->环境变量设置->在系统变量⾥找到path,把你的WinDbg安装⽬录写上去启动Windbg 打开⼀个exe看到这个说明配置成功四、功能Windbg是Microsoft公司免费调试器调试集合中的GUI的调试器,⽀持Source和Assembly两种模式的调试。
Windbg不仅可以调试应⽤程序,还可以进⾏Kernel Debug。
windbg使用方法

windbg使用方法Windbg是一款由Microsoft开发的强大的调试工具,它可以帮助开发人员诊断和解决Windows平台上的各种软件问题。
本文将介绍Windbg的基本使用方法,希望能够帮助读者更好地利用这一工具进行调试和分析。
首先,我们需要下载并安装Windbg工具。
可以在Microsoft官方网站上找到Windbg的安装包,并按照提示进行安装。
安装完成后,我们可以在开始菜单或者桌面上找到Windbg的快捷方式,双击打开即可进入工具界面。
在使用Windbg进行调试之前,我们需要先了解一些基本概念和操作。
首先是符号文件的设置,符号文件包含了程序中各个函数和变量的调试信息,可以帮助我们更好地进行调试。
在Windbg中,可以通过设置符号路径和加载符号文件来进行符号文件的管理。
接着是源代码的设置,如果我们有程序的源代码,可以通过设置源代码路径来进行源代码级别的调试。
最后是调试目标的设置,可以通过Attach或者Open Crash Dump来加载需要调试的程序。
接下来,我们来看一下Windbg的一些常用命令和功能。
在Windbg的命令行窗口中,可以输入各种命令来进行调试操作,比如设置断点、查看变量的值、跟踪函数的调用等。
此外,Windbg还提供了丰富的图形化界面,可以通过菜单栏和工具栏来进行各种调试操作,比如查看内存、查看寄存器、查看线程信息等。
除了基本的调试功能,Windbg还提供了一些高级的调试工具和扩展,比如分析内存泄漏、分析崩溃转储、分析性能问题等。
通过这些工具和扩展,我们可以更深入地了解程序的运行情况,找出潜在的问题并加以解决。
在使用Windbg进行调试的过程中,我们可能会遇到各种各样的问题和挑战,比如调试信息不够详细、调试速度太慢、调试过程中出现崩溃等。
针对这些问题,我们可以通过调整符号文件的设置、优化调试环境、使用合适的调试工具等方式来进行解决。
总的来说,Windbg是一款功能强大的调试工具,可以帮助我们更好地进行程序调试和分析。
windows系统蓝屏分析修复工具WinDbg(32位64位)及教程
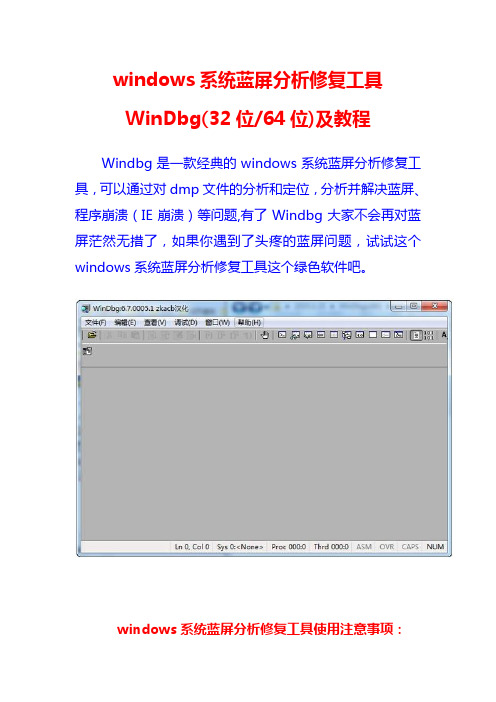
windows系统蓝屏分析修复工具WinDbg(32位/64位)及教程Windbg是一款经典的windows系统蓝屏分析修复工具,可以通过对dmp文件的分析和定位,分析并解决蓝屏、程序崩溃(IE崩溃)等问题,有了Windbg大家不会再对蓝屏茫然无措了,如果你遇到了头疼的蓝屏问题,试试这个windows系统蓝屏分析修复工具这个绿色软件吧。
windows系统蓝屏分析修复工具使用注意事项:符号表是Windbg关键的“数据库”,如果没有它,WinDbg基本上就是个废物,无法分析出更多问题原因。
所以使用Windbg设置符号表,是必须要走的一步。
1、运行Windbg软件,然后按【Ctrl+S】弹出符号表设置窗2、将符号表地址:SRV*C:\Symbols*/download /symbols粘贴在输入框中,点击确定即可。
温馨提示:红色字体为符号表本地存储路径,建议固定路径,可避免符号表重复下载。
windows系统蓝屏分析修复工具简单的使用教程简介:当你拿到一个dmp文件后,可使用【Ctrl+D】快捷键来打开一个dmp文件,或者点击WinDbg界面上的【File=>Open Crash Dump...】按钮,来打开一个dmp 文件。
第一次打开dmp文件时,可能会收到如下提示,出现这个提示时,勾选“Don't ask again in this WinDbg session”,然后点否即可。
当你想打开第二个dmp文件时,可能因为上一个分析记录未清除,导致无法直接分析下一个dmp文件,此时你可以使用快捷键【Shift+F5】来关闭上一个dmp分析记录。
到这里关于windows系统蓝屏分析修复工具的使用已经介绍完了,简单的Windbg使用相信大家已经没有任何问题了。
windbg gflags操作流程
windbg gflags操作流程Windbg是一种Windows操作系统的调试工具,它可以帮助开发人员分析和调试应用程序的崩溃和性能问题。
Gflags是Windbg的一个重要组成部分,它提供了一种简便的方式来配置系统的全局标志和调试标志。
本文将介绍如何使用Windbg和Gflags进行调试和性能分析的操作流程。
第一步:安装Windbg和配置符号文件路径我们需要安装Windbg调试工具,并配置符号文件路径。
符号文件包含了应用程序的调试信息,可以帮助开发人员更方便地分析崩溃和性能问题。
在Windbg安装目录下,找到“sym”文件夹,将符号文件下载到该文件夹中。
然后,在Windbg的命令行中输入以下命令来配置符号文件路径:.sympath+ C:\Sym其中,C:\Sym是符号文件路径的根目录,可以根据实际情况进行修改。
第二步:启动Windbg并加载应用程序打开Windbg,选择“文件”菜单中的“打开进程”选项,然后在弹出的对话框中输入应用程序的可执行文件路径。
点击“确定”按钮后,Windbg会加载该应用程序并暂停在入口点处。
第三步:设置断点和观察点在Windbg的命令行中,输入以下命令来设置断点:bp symbol其中,symbol是要设置断点的函数名或地址。
通过设置断点,我们可以在应用程序执行到特定位置时中断程序的执行,以便进行调试和分析。
除了设置断点,我们还可以设置观察点来监视特定的变量或内存地址的值。
在Windbg的命令行中,输入以下命令来设置观察点:ba r/w size address其中,size是要监视的内存块的大小,address是要监视的内存地址。
通过设置观察点,我们可以在特定的内存地址发生变化时中断程序的执行,以便进行调试和分析。
第四步:运行应用程序并触发断点和观察点在Windbg的命令行中,输入“g”命令来继续执行应用程序。
当应用程序执行到设置的断点或观察点处时,Windbg会中断程序的执行,并显示相关的调试信息。
windbg使用方法

windbg使用方法Windbg是一款由微软公司开发的调试工具,它可以帮助开发人员分析和诊断Windows操作系统和应用程序的问题。
本文将介绍Windbg的基本使用方法,希望能够帮助读者更好地利用这个工具进行调试和分析。
首先,我们需要了解如何安装Windbg。
通常情况下,Windbg是作为Windows驱动程序开发工具包(Windows Driver Kit)的一部分发布的,也可以在微软的官方网站上下载到独立安装包。
安装完成后,我们可以在开始菜单或者安装目录中找到Windbg的可执行文件。
接下来,我们需要了解如何打开并配置Windbg。
在打开Windbg 后,我们可以通过“文件”菜单中的“符号文件路径”选项来设置符号文件的路径,以便Windbg能够正确地加载符号文件。
符号文件对于调试非常重要,它包含了源代码和可执行文件之间的映射关系,能够帮助我们更好地理解程序的运行状态。
在Windbg中,我们可以通过“文件”菜单中的“打开转储文件”选项来打开需要分析的转储文件(dump file)。
转储文件是程序崩溃时生成的一种内存快照,包含了程序崩溃时的内存状态和调用栈信息。
通过分析转储文件,我们可以找出程序崩溃的原因,并进行相应的调试和修复。
除了分析转储文件外,我们还可以通过“调试”菜单中的“附加到进程”选项来附加到正在运行的进程,以实时地监视和分析程序的运行状态。
这对于调试一些无法通过转储文件分析的问题非常有帮助,比如内存泄漏、死锁等问题。
在Windbg中,我们可以使用各种命令来进行调试和分析。
比如,通过“!analyze”命令可以自动分析转储文件,并给出可能的崩溃原因;通过“kb”命令可以查看当前线程的调用栈信息;通过“!heap”命令可以查看进程的堆内存分配情况等等。
熟练掌握这些命令对于高效地进行调试和分析非常重要。
除了命令之外,Windbg还提供了丰富的调试工具,比如内存窗口、寄存器窗口、线程窗口等,这些工具可以帮助我们更直观地了解程序的运行状态。
Windbg 使用教程
详解用法详解第30章WinDBG用法WinDBG是个非常强大的调试器,它设计了极其丰富的功能来支持各种调试任务,包括用户态调试、内核态调试、调试转储文件、远程调试等等。
WinDBG具有非常大的灵活性和可扩展性,用来满足各种各样的调试需求,比如用户可以自由定义调试事件的处理方式,编写调试扩展模块来定制和补充WinDBG的调试功能。
尽管WinDBG是个典型的窗口程序,但是它的大多数调试功能还是以手工输入命令的方式来工作的。
目前版本的WinDBG共提供了20多条标准命令,140多条元命令(Meta-commands),和难以计数的大量扩展命令。
学习和灵活使用这些命令是学习WinDBG的关键,也是难点。
上一章我们从设计的角度分析了WinDBG,本章将从使用(用户)的角度介绍WinDBG。
我们先介绍工作空间的概念和用法(第1节),然后介绍命令的分类和不同种类的命令提示符(第2节)。
第3节介绍不同的调试模式,也就是如何与不同特征的调试目标建立调试会话。
第4节介绍上下文的概念和在调试时应该如何切换和控制上下文。
第5节介绍调试事件和如何定制调试事件的处理方式。
从第6节到第9节我们将分别介绍如何在WinDBG中完成典型的调试操作,比如控制调试目标(第6节)、设置断点(第7节)、观察栈(第8节)以及如何观察和修改数据(第9节)。
30.1 工作空间WinDBG使用工作空间(Workspace)来描述和存储一个调试项目的属性、参数、以及调试器设置等信息。
其功能类似于集成开发环境的项目文件。
分类30.1.1分类WinDBG定义了两种工作空间,一种称为缺省的工作空间(Default Workspace),另一种称为命名的工作空间(Named Workspace)。
当没有明确使用某个命名的工作空间时,WinDBG总是使用缺省的工作空间,因此缺省的工作空间也叫隐含的(implicit)工作空间,命名的工作空间也叫显式的(explicit)工作空间。
- 1、下载文档前请自行甄别文档内容的完整性,平台不提供额外的编辑、内容补充、找答案等附加服务。
- 2、"仅部分预览"的文档,不可在线预览部分如存在完整性等问题,可反馈申请退款(可完整预览的文档不适用该条件!)。
- 3、如文档侵犯您的权益,请联系客服反馈,我们会尽快为您处理(人工客服工作时间:9:00-18:30)。
方案一:
WinDbg配置和使用基础
WinDbg是微软发布的一款相当优秀的源码级(source-level)调试工具,可以用于Kernel模式调试和用户模式调试,还可以调试Dump文件。
1. WinDbg介绍:
Debugging Tools and Sy mbols: Getting Started
/whdc/devtools/debugging/debugstart.mspx
A word for WinDbg
/communityserver/blogs/mike_taultys_blog/archive/2004/08/03/4656.aspx
2. WinDbg下载:
Install Debugging Tools for Windows 32-bit Version
/whdc/devtools/debugging/installx86.mspx
Install Debugging Tools for Windows 64-bit Versions
/whdc/devtools/debugging/install64bit.mspx
3. 配置WinDbg:
运行WinDbg->菜单->File->Symbol File Path->按照下面的方法设置_NT_SYMBOL_PATH变量:
在弹出的框中输入“C:\MyCodesSymbols;
SRV*C:\My LocalSy mbols*/download/symbols”(按照这样设置,WinDbg将先从本地文件夹C:\MyCodesSymbols中查找Symbol,如果找不到,则自动从MS的Symbol Serv er上下载
Sy m bols)。
另一种做法是从这个Symbol下载地址中
/whdc/devtools/debugging/symbolpkg.mspx,下载相应操作系统所需要的完整的Sy m bol安装包,并进行安装,例如我将其安装在D:\WINDOWS\Sy m bols,在该框中输入
“D:\WINDOWS\Sy m bols”。
(这里要注意下载的Symbols的版本一定要正确,在我的Win2003+Sp1上,我曾经以为安装Win2003+Sp2的Symbols可能会牛×点,但结果证明我错了,用WinDbg打开可执行文件时,提示“PDB sy m bol for m scorwks.dll not loaded;Defaulted to export symbols for ntdll.dll”的错误,我有重新装上
Win2003+Sp1的Sy mbols, 现在一切运行正常^_^)
4. 使用WinDbg:
WinDbg提供了图形界面和命令行两种运行方式。
这里介绍使用图形界面的WinDbg来调试应用程序:
File->OpenExecutable->可以选择一个
可执行文件进行调试;
File->Attache to a Process->可以选择
一个运行中的进程,并对其进行调试;
至此,我们就可以在上图中用红色方框标记的文本框中输入各个功能指令了(有关指令的帮助文档,可以参考:Help->Contents->Debugging Tools for Windows->Debuggers->Debugger Reference,该目录下列集了所有指令机器功能说明!)。
方案二:
安装与配置windbg的symbol(符号)
写这篇的动机:在网上找了一上午的windbg配置符号教程.楞是没找到详细的,都讲的太模糊而且互相抄袭.不适合新手看.终于靠自己的努力弄懂了一点,呵呵写出来新手们分享.
安装与配置windbg的symbol(符号)
第一步是从/ddk/debugging 下载最新版本的WinDBG,因为符号服务器二进制文件是由WinDBG 小组开发的。
您将需要检查是否有WinDBG更新版本,因为该小组似乎具有相当紧凑的发布日程安排,并且每隔几个月就会发布更新版本。
第二步双击下载的文件安装windbg.安装时注意记住安装到那里了.
第三步windbg访问符号需要两个文件(SYMSRV.DLL 和SYMSTORE.EXE)所以添加主path环境变量中它们的路径进去,即:你的windbg安装目录.
操作方法:在桌面我的电脑点右键--属性--高级--环境变量,在系统变量列表框中找到path双击,在变量值最后面加一个分号再把你的安装目录写上.点确定. 这一步是告诉windbg那两个文件放在什么地方.
第四步新建一个环境变量:
_NT_SYMBOL_PATH
值为:
SRV*c:\mysymbol*/download/symbols
操作方法:桌面我的电脑点右键--属性--高级--环境变量 ,点击新建,把上面的变量名和变量值填上.这一步的意思是说告诉windbg,我的符号文件存放在c:mysymbol中(当然其实里面什么也没有,甚至这个文件夹也不存在,不过没关系,系统找不到的话会给你创建一个,并在上面的网址中去帮你下载符号文件放在里面)
第五步运行windbg 打开一个exe文件或者附加到一个进程里去, 你会看到
Symbol search path is:SRV*c:\mysymbol* /download/symbols
打开c盘看到有一个新目录mysymbol,里面有windbg新下载的文件.
恭喜说明配置成功了.。