CFD典型案例共46页文档
空调设计中的CFD应用
空调设计中的CFD应用作者:日本Flakt K.K 谭洪卫,村田敏夫1概述以建筑空间为对象的计算机数值模拟,根据解析的着眼点不同可分为时间变动特性解析和空间分布解析,也可从规模上分为宏观解析。
前者一般用于负荷预测解析,后者用于气流分布、温湿度、气体浓度分布的解析。
本文主要涉及后者。
在一些先进国家,包括空调系统、设备设计在内的建筑设计上的计算机模拟技术得到文泛应用,其中室内热环境计算机模拟技术,特别是计算流体力学(CFD: Computational fluid Dynamics)技术,已进入了实用阶段。
2 CFD技术在日本空调方面的应用现状最早是用于建筑热负荷计算法的开发,尔后使用这项技术开发了标准气象参数,并逐步应用到动态热负荷数值模拟(HASP)中,此后研制了气流数值解析CFD,这些技术在日本均已进入了实用化阶段。
从对“采用动机”的调查得知,因为市场、业务需要的增加而采用CFD的回答居位,其次为因为软件的普及、计算机环境的改善而采用。
从解析对象来看,以室内空间对象的占压倒多数,从解析物理现象分析来看,强制对流、通风换气的超过半数。
但对空气品质的解析用例尚不多见,这有待于解析手法的完善、计算机能力的进一步改善和提高。
可以预测,IAQ问题的解析将会是今后的一个热点。
在所使用的CFD软件中几乎包罗了所有现行的解析手法、数学物理模型,因此体现了CFD软的通用性。
用于实际离散化法的主要是MAC法和SIMPLE法,紊流模型则以标准k-ε模型居多,解析坐标系多采用直交坐标。
3 CFD在空调设计中的应用3.1 CFD的应用方法概述空调设计的最终目的是以经济技术合理的系统设计及设备选型实现所要求的室内气候环境(温湿度、气流、污染物质浓度等的分布)。
实现对这些环境参数的合理控制,有必要把握其分布特征。
应用计算机技术对流体基础方程进行数值解析,计算流体力学(CFD)便是除模型实验外的可详细解析三次元室内气流的唯一手段。
CFD在隧道工程中的应用

content
CFD在隧道安全方面的研究现状 案例分析 总结
一:CFD在隧道安全方面的研究现状
• 在早年的隧道设计中,通风工程师们主要关注于一些普通 的通风问题。然而近十年来,随着机动车排放物的明显减 少以及安全意识的提高,他们的注意力逐渐转向了隧道中 的防火安全问题。 • 由于隧道火灾规模对烟气控制的影响很大,因而国外学者 的试验研究主要集中于不同火灾场景时对热释放速率 (HRR:Heat Release Rate)的确定,以及临界风速与热释 放速率关系式的拟合。由于隧道火灾时主要利用纵向通风 气流控制隧道内烟气流向,因此,临界风速的确定一直是 各国学者研究的重点之一。与国外相比,我国也进行了一 系列的火灾试验研究,但由于火灾的全尺寸试验研究需要 耗费大量的人力物力,所以主要以小尺寸的模型试验为主 。主要研究内容着重于通风控制火灾时隧道的温度以及隧 道火灾的消防方法。
2.3纵向通风对上游烟气分布的影响
从图中可以看出, 由于冷空气以及 隧道拱璧的阻力 以及纵向通风的 存在,随着距火 源距离的增大, 烟气浓度不断减 小,而对于某些 风速的情况下, 烟气浓度在很短 的距离内就减小 为0,
2.4温度场随时间变化规律
. 2.5纵向温度场分布
• 通风风速、火灾规模对温度场的纵向分布具有重要的影响 。在不同的通风条件下,隧道纵向温度场的分布也不尽相 同。通风风速、火灾规模与隧道内纵向温度场分布的关系 如下图3.38-3.40中所示。
[5]涂文轩.铁路隧道火灾的试验研究.消防技术与产品信息,1997.10 [6]柴永模.隧道内发生火灾时的温度分布规律初探.消防技术与产品信息,2002.3 [7]柴永模.铁路隧道消防技术研究十年回顾.消防技术与产品信息,2002.4 [ 8]曹智明,杨其新.秦岭终南山特长公路隧道火灾模式下的通风组织试验方案研究. 公路,2003(7):177-180 [9]S.Kumar,G .Cox,Radiant Heat and Surface Roughness Effects in the Numerical Modeling of Tunnel Fires.6th International Symposium on the Aerodynamics&Ventilation of VehicleTunnels,1988
ansys-cfd流体分析实例
3.Generation the O grid
4.Mesh the model and check quality of mesh
5.Extrude the mesh
6.Reset the BC’s (boundary conditions)
7.Output toCFX5.7.1
6.Constant air density
Pre-processing stage
In this stage, we implement the“ICEM CFD”to perform the pre-processing work. The basic steps as follow:
1.Establish geometry model
Assumption and Boundary Conditions:
1.2 dimensional problems
2.Steady state condition
3.The uniform flow velocity
4.No Heat transfer
5.Neglect the gravitational force
Now you can create curves
Click button“Createeate Curve”
Note:the left corner of the black screen:Select locations with left button, middle=done, right=cancel
Draw the cylinder by middle button(B).
See tree widget:
ClosePoints name
《CFD典型案例》课件
火箭发动机设计
CFD模拟可以优化火箭发动 机的外形和喷口,有效提高 推力和性能。
CFD在建筑设计中的应用案例
1 高性能建筑设计
CFD模拟能够预测和 优化大楼的空气流动 和热特性,降低能源 消耗。
2 吸烟和火灾安全
研究
3 热舒适性分析
CFD可以分析和优化
CFD模拟可以研究室
各个房间的温度和颗
内烟雾和火灾,为防
CFD在航空航天工程中的应用案例
气动外形优化
通过CFD模拟优化飞机的气动外形设计, 优化几何形状,降低飞行噪音。
机翼设计
利用CFD对飞机机翼的气体流动进行模拟, 以获得合适的机翼面积、攻角和形状。
喷气发动机燃烧过程
使用CFD研究喷气发动机燃烧过程,分析 燃料的消耗量,改善燃烧效率。
空气动力学分析的推进器件和空 气船
CFD的应用
它被广泛应用于空气动 力学、船舶和海洋工程、 汽车、化学工程、建筑 和能源领域等。
CFD在工程领域的应用案例
风力涡轮机设计
通过CFD模拟风场容易的拟 合不同风力条件下涡轮的强 线上的成本和时间, 预测管道的压降,选择合适 的管道尺寸。
通过CFD分析热交换器的效 率,最大程度上降低了冷却 和加热过程中的压力损失。
《CFD典型案例》PPT课 件
欢迎来到《CFD典型案例》PPT课程!在这期课程中,我们将深入研究计算流 体力学的概括和应用。
CFD概述
什么是CFD?
计算流体力学(CFD)是 应用数学、物理和计算 机科学知识解决流体力 学问题的方法。
CFD的工作原理
通过分割流体域来确定 计算格点,然后使用数 值方法求解支配流体运 动的方程的方法来模拟 流体力学问题。
建筑风环境CFD模拟案例
某小区区建筑风环境模拟报告目录1. 模拟过程及使用软件介绍 (2)1.1 建筑风环境模拟使用软件介绍 (2)1.2 建筑风环境模拟过程 (2)1.2.1 几何模型的建立 (3)1.2.2 网格的划分 (5)1.2.3 求解参数设置 (6)2. 模拟结果 (12)3. 建筑风环境模拟研究思路及问题 (16)附录I 从百度地图获取三维几何模型的尝试 (17)附录2 Fluent入口边界速度UDF命令 (19)REFERENCE (19)建筑风环境的研究主要有三种方式:现场实测、数值模拟和风洞试验。
随着计算机软硬件技术水平的发展,计算能力及计算精度不断提高,计算流体力学(Computational Fluid Dynamics:CFD)的理论和方法得到了不断改进。
基于CFD 技术对流场进行模拟具有操作周期短,操作成本低,可反复修改的特性,相比较于现场实测和风洞试验具有更广阔的应用前景。
但是由于数值模拟技术对输入的参数十分敏感,必须辅以现场实测或风洞试验的验证。
本次模拟区域直径500m,模拟的工况为10m高度处风速为10m/s,风向为225°,输出结果查看高度10m,20m,40m,78m,100m处的速度云图、速度矢量图和压力云图。
1. 模拟过程及使用软件介绍1.1 建筑风环境模拟使用软件介绍(1)前处理软件ANSYS ICEM CFD 15.0ICEM是ANSYS CFD软件族中前处理软件之一。
具有强大的网格划分功能,接口丰富,可接受绝大多数几何模型格式导入,例如AUTO CAD、SolidWorks、PRO/E等。
(2)求解软件ANSYS Fluent 15.0占据CFD领域绝对领先地位的流体仿真软件。
具有多种物理算法、物理模型。
在医学、航天、机械工程等领域均应用广泛。
(3)后处理软件Tecplot 360提供丰富的绘图格式,具备强大的CFD结果可视化功能,图形美观。
1.2 建筑风环境模拟过程使用计算流体力学对建筑室外风场进行数值模拟一般包括以下四个步骤:(1)几何模型的建立(2)对几何模型进行合适的网格划分(3)将划分网格后的模型导入Fluent,设置求解参数并求解(4)结果的后处理(速度云图、速度矢量图、压力云图等)1.2.1 几何模型的建立在几何模型的建立部分,现阶段采用的是陈宸的模型,他是根据彰武校区附近区域的城规图建立CAD 三维模型(据陈宸描述来自他建筑学院的朋友提供)。
cfd案例

cfd案例CFD(Computational Fluid Dynamics,计算流体动力学)是将流体的运动和相关物理现象数值模拟的一种方法。
它可以广泛应用于工业、工程、环境等领域,解决流体流动和热传导等问题。
下面将介绍一个CFD案例。
最近一家电子产品公司开发了一种新型的笔记本电脑,想要了解电脑的散热性能,并进行优化设计。
由于电脑的散热部分涉及到流体流动和热传导等多个物理过程,因此他们决定采用CFD进行模拟分析。
首先,他们使用CAD软件对电脑的三维几何模型进行建模,并导入CFD软件中进行网格划分。
在初始模拟中,他们假设电脑的流体流动是单相、不可压缩的,并施加边界条件和气体的初始温度分布。
接下来,他们设置了模拟的求解器和物理模型,如流体力学方程、能量方程等。
在进行CFD模拟后,他们获得了电脑内部流体的速度、压力和温度分布。
通过分析结果,他们发现电脑内部存在一些热点区域,温度较高,可能会影响电脑的散热性能和稳定性。
同时,他们也发现一些流体流动的不均匀现象,可能导致热量不能有效地传递出去。
基于这些分析结果,他们开始进行优化设计。
他们尝试了多种改进措施,如增加散热片的数量和改变流体的进出口位置等。
通过一系列CFD模拟和优化设计,他们最终得到了一个散热性能更好的电脑设计方案。
通过CFD模拟分析和优化设计,该公司成功地提高了电脑的散热性能和稳定性,并减少了产品开发的时间和成本。
同时,他们也得到了一些有关流体流动和热传导等物理过程的理论和实践经验,为后续产品的开发提供了参考。
总而言之,CFD技术在工业和工程领域有着广泛的应用,通过模拟分析和优化设计,可以解决流体流动和热传导等问题,提高产品的性能和品质。
该电子产品公司的案例表明,CFD 在电子设备散热设计中的应用具有重要的意义。
ANSYS CFD管道流体分析经典算例 Fluid

Fluid #2: Velocity analysis of fluid flow in a channel USING FLOTRAN Introduction:In this example you will model fluid flow in a channelPhysical Problem:Compute and plot the velocity distribution within the elbow. Assume that the flow is uniform at both the inlet and the outlet sections and that the elbow has uniform depth.Problem Description:T he channel has dimensions as shown in the figureThe flow velocity as the inlet is 10 cm/sUse the continuity equation to compute the flow velocity at exitObjective:T o plot the velocity profile in the channelT o plot the velocity profile across the elbowYou are required to hand in print outs for the aboveFigure:IMPORTANT: Convert all dimensions and forces into SI unitsSTARTING ANSYSC lick on ANSYS 6.1in the programs menu.S elect Interactive.T he following menu comes up. Enter the working directory. All your files will be stored in this directory. Also under UseDefault Memory Model make sure the values 64 for Total Workspace, and 32 for Database are entered. To change these values unclick Use Default Memory ModelMODELING THE STRUCTUREG o to the ANSYS Utility Menu (the top bar)Click Workplane>W P Settings…The following window comes up:o Check the Cartesian and Grid Only buttonso Enter the values shown in the figure aboveGo to the ANSYS Main Menu (on the left hand side of the screen) and click Preprocessor>Modeling>Create>Keypoints>On Working PlaneCreate keypoints corresponding to the vertices in the figure. The keypoints look like below.Now create lines joining these key points.M odeling>Create>Lines>Lines>Straight lineT he model looks like the one below.Now create fillets between lines L4-L5 and L1-L2.C lick Modeling>Create>Lines>Line Fillet. A pop-up window will now appear. Select lines 4 and 5. Click OK. The following window will appear:T his window assigns the fillet radius. Set this value to 0.1 m.Repeat this process of filleting for Lines 1 and 2.The model should look like this now:N ow make an area enclosed by these lines.M odeling>Create>Areas>Arbitrary>By LinesS elect all the lines and click OK. The model looks like the followingT he modeling of the problem is done.ELEMENT PROPERTIESSELECTING ELEMENT TYPE:Click Preprocessor>Element Type>Add/Edit/Delete... In the 'Element Types' window that opens click on Add... The following window opens.∙Type 1 in the Element type reference number.∙Click on Flotran CFD and select 2D Flotran 141. Click OK. Close the Element types window.∙So now we have selected Element type 1 to be solved using Flotran, the computational fluid dynamics portion of ANSYS. This finishes the selection of element type.DEFINE THE FLUID PROPERTIES:∙Go to Preprocessor>Flotran Set Up>Fluid Properties.∙On the box, shown below, set the first two input fields as Air-SI, and then click on OK. Another box will appear. Accept the default values by clicking OK.∙Now we’re ready to define the Material PropertiesMATERIAL PROPERTIESW e will model the fluid flow problem as a thermal conduction problem. The flow corresponds to heat flux, pressurecorresponds to temperature difference and permeability corresponds to conductance.Go to the ANSYS Main MenuClick Preprocessor>Material Props>Material Models. The following window will appearA s displayed, choose CFD>Density. The following window appears.F ill in 1.23 to set the density of Air. Click OK.Now choose CFD>Viscosity. The following window appears:N ow the Material 1 has the properties defined in the above table so the Material Models window may be closed.MESHING: DIVIDING THE CHANNEL INTO ELEMENTS:G o to Preprocessor>Meshing>Size Cntrls>ManualSize>Lines>All Lines.I n the window that comes up type 0.01 in the field for 'Element edge length'.N ow Click OK.Now go to Preprocessor>Meshing>Mesh>Areas>Free. Click the area and the OK. The mesh will look like thefollowing.BOUNDARY CONDITIONS AND CONSTRAINTSG o to Preprocessor>Loads>Define Loads>Apply>Fluid CFD>Velocity>On lines. Pick the left edge of theouter block and Click OK. The following window comes up.E nter 0.1 in the VX value field and click OK. The 0.1 corresponds to the velocity of 0.1 meter per second of air flowingfrom the left side.R epeat the above and set the Velocity to ZERO for the air along all of the edges of the pipe. (VX=VY=0 for all sides)O nce they have been applied, the pipe will look like this:∙Go to Main Menu>Preprocessor>Loads>Define Loads>Apply>Fluid CFD>Pressure DOF>On Lines.∙Pick the outlet line. (The horizontal line at the top of the area) Click OK.∙Enter 0 for the Pressure value.∙Now the Modeling of the problem is done.SOLUTIONG o to ANSYS Main Menu>Solution>Flotran Set Up>Execution Ctrl.∙The following window appears. Change the first input field value to 300, as shown. No other changes are needed. Click OK.G o to Solution>Run FLOTRAN.W ait for ANSYS to solve the problem.C lick on OK and close the 'Information' window.POST-PROCESSINGP lotting the velocity distribution…Go to General Postproc>Read Results>Last Set.Then go to General Postproc>Plot Results>Contour Plot>Nodal Solution. The following window appears:∙Select DOF Solution and Velocity VSUM and Click OK.∙This is what the solution should look like:∙Next, go to Main Menu>General Postproc>Plot Results>Vector Plot>Predefined.The following window will appear:∙Select OK to accept the defaults. This will display the vector plot to compare to the solution of the same tutorial solved using the Heat Flux analogy. Note: This analysis is FAR more precise as shown by the followingsolution:∙Go to Main Menu>General Postproc>Path Operations>Define Path>By Nodes∙Pick points at the ends of the elbow as shown. We will graph the velocity distribution along the line joiningthese two points.∙The following window comes up.∙Enter the values as shown.∙Now go to Main Menu>General Postproc>Path Operations>Map onto Path. The following window comes up.∙Now go to Main Menu>General Postproc>Path Operations>Plot Path Items>On Graph.∙The following window comes up.∙Select VELOCITY and click OK.∙The graph will look as follows:。
ansys CFD 实例
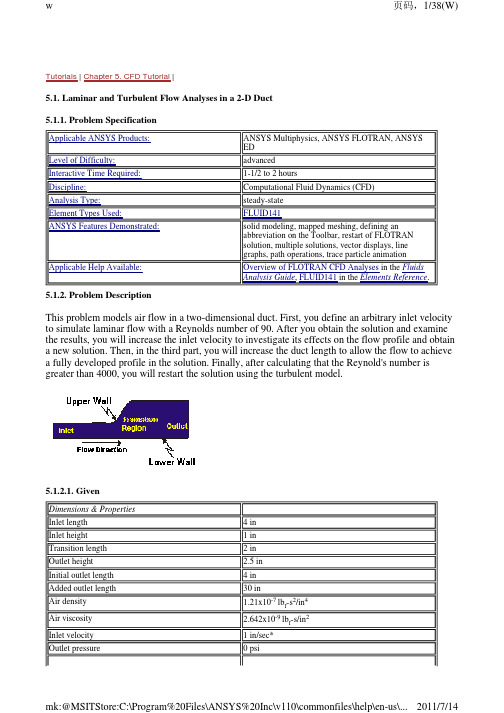
5.1. Laminar and Turbulent Flow Analyses in a 2-D Duct5.1.1. Problem SpecificationApplicable ANSYS Products:ANSYS Multiphysics, ANSYS FLOTRAN, ANSYSEDLevel of Difficulty:advancedInteractive Time Required:1-1/2 to 2 hoursDiscipline:Computational Fluid Dynamics (CFD)Analysis Type:steady-stateElement Types Used:FLUID141ANSYS Features Demonstrated:solid modeling, mapped meshing, defining anabbreviation on the Toolbar, restart of FLOTRANsolution, multiple solutions, vector displays, linegraphs, path operations, trace particle animationApplicable Help Available:Overview of FLOTRAN CFD Analyses in the FluidsAnalysis Guide, FLUID141 in the Elements Reference.5.1.2. Problem DescriptionThis problem models air flow in a two-dimensional duct. First, you define an arbitrary inlet velocity to simulate laminar flow with a Reynolds number of 90. After you obtain the solution and examine the results, you will increase the inlet velocity to investigate its effects on the flow profile and obtain a new solution. Then, in the third part, you will increase the duct length to allow the flow to achieve a fully developed profile in the solution. Finally, after calculating that the Reynold's number is greater than 4000, you will restart the solution using the turbulent model.5.1.2.1. Given*Initial value of 1 will be changed to 50 upon restart.5.1.2.2. Approach and AssumptionsYou will perform two-dimensional analyses using the FLOTRAN element FLUID141. This problem is divided into four parts:A laminar analysis of the flow of air with a Reynolds number of 90An investigation of how a higher inlet velocity affects the flow profile using the laminar modelA laminar analysis of air with a longer duct length to observe a more fully developed flow profileA turbulent analysis of the flow of air with a Reynolds number of ~4600For all solutions, you will apply a uniform velocity profile at the inlet. This includes specification of a zero velocity condition at the inlet in the direction normal to the inlet flow. You will apply no-slip (zero velocity) conditions all along the walls (including where the walls intersect the inlets and outlets). The fluid is considered incompressible and you can assume that the properties will be constant. In such cases, only the relative value of pressure is important, and a zero relative pressure is applied at the outlet.For the initial analysis, the flow is in the laminar regime (Reynold's number < 3000). To compute the Reynolds number of the flow for internal duct flows, the equation is as follows:(Note that in a two-dimensional geometry, the hydraulic diameter is twice the inlet height.)You will increase the inlet velocity to 50 in/s for the second analysis (which will increase the Reynolds number accordingly) and you will rerun the solution.The flow profile for the second analysis shows that the flow is not fully developed, therefore the logical next step would be to increase the duct length in order to allow for a more complete profile. You will increase the length of the duct by 30 inches and rerun the solution.For internal flows, the transition to turbulence occurs within the Reynolds number range of 2000-3000. Therefore for the last solution of air in the duct (Reynolds number ~4,500), the flow will be turbulent. For the last analysis, you will initiate the solution using the turbulent model. You will restart the analysis here (instead of rerunning it) because the problem domain has not changed.5.1.2.3. Summary of StepsUse the information in the problem description and the steps below as a guideline in solving the problem on your own. Or, use the detailed interactive step-by-step solution by choosing the link for step 1.Before you begin, delete any results files (.rfl) from previous CFD analyses that still reside in your working directory. If you begin an ANSYS session to start a new CFD analysis, and use the same jobname from a file stored from a previous CFD analysis, the program will not start from scratch, but will restart and append to files with the same name (Jobname.rfl and Jobname.pfl). To avoid this situation, delete these results files when starting a new CFD analysis. Another way of avoiding thissituation is to change the jobname to one that was not used in a previous CFD analysis. You can change the jobname in the product launcher before starting ANSYS, or during an ANSYS session by choosing Utility Menu> File> Change Jobname.Preprocessing (Laminar Analysis)1. Set preferences.2. Define element type.3. Create rectangle for the inlet region.4. Create the outlet rectangle.5. Create the transition region between the rectangles.6. Establish mesh patterns.7. Create the finite element mesh.8. Create command on the Toolbar.9. Apply boundary conditions.Back To Top Solution (Laminar Analysis)10. Establish fluid properties.11. Set execution controls.12. Change reference conditions.13. Execute FLOTRAN solution.Back To Top Postprocessing (Laminar Analysis)14. Read in the results for postprocessing.15. Plot velocity vectors.16. Plot total pressure contours.17. Animate velocity of trace particles.18. Make a path plot of the velocity through the outlet.Back To Top Solution (Laminar Analysis with Change in Inlet Velocity)19. Increase the inlet velocity.20. Run the analysis.Back To Top Postprocessing (Laminar Analysis Using New Inlet Velocity)21. Plot total pressure contours.22. Animate velocity of trace particles.23. Make a path plot of the velocity through the outlet.Back To Top Preprocessing (Laminar Analysis with Increase in Duct Length)24. Delete pressure boundary condition.25. Construct additional outlet region.26. Establish mesh divisions for the new rectangle and mesh.27. Apply boundary conditions on new region.Back To Top Solution (Laminar Analysis Using New Duct Length)28. Change the jobname and execute solution.Back To Top Postprocessing (Laminar Analysis Using New Duct Length)29. Read in the new results and plot velocity vectors.30. Plot total pressure contours.31. Animate velocity of trace particles.32. Make a path plot of the velocity through the outlet.33. Calculate Reynolds number.Back To Top Solution (Turbulent Analysis)34. Specify FLOTRAN solution options and execution controls.35. Restart the analysis.Back To Top Postprocessing (Turbulent Analysis)36. Plot total pressure contours.37. Animate velocity of trace particles.38. Make a path plot of the velocity through the outlet.39. Exit the ANSYS program.5.1.3. Preprocessing (Laminar Analysis)5.1.3.1. Step1: Set preferences.You will now set preferences in order to filter quantities that pertain to this discipline only.1.Main Menu >Preferences2.Turn on FLOTRANCFD filtering.3.OK.5.1.3.2. Step 2: Define element type.5.1.3.3. Step 3: Create rectangle for the inlet region.4.Choose 2DFLOTRAN element (FLUID141). 5.OK. 6.Close.1.Main Menu>Preprocessor>Modeling> Create> Areas> Rectangle> By Dimensions 2.Enter the following:X1 = 0页码,6/38(W)wX2 = 43.Enter the following:Y1 = 0Y2 = 14.Apply to create the firstrectangle and preservethe dialog box for thesecond rectangle.5.1.3.4. Step 4: Create the outlet rectangle.5.1.3.5. Step 5: Create the transition region between the rectangles.The transition region, where the flow expands, is bordered on the top by a smooth line tangent to the upper line of both rectangles. This line is created with the "Tangent to 2 lines" option. Note that the prompt in the Input Window will indicate what is to be picked (lines, ends of lines).The area is then created as an arbitrary area through the four keypoints. Note that the area will be bounded by existing lines through those keypoints.3.OK (in picking menu).4.Pick the tangency end of the first line (upper right corner).5.OK (in picking menu).6.Pick the second line (upper line of the larger rectangle.7.OK (in picking menu).8.Pick the tangency end of the second line.9.OK to create the lineThe result is a smooth line between the two areas.Now create the third area as an arbitrary area through keypoints.10.Main Menu> Preprocessor> Modeling> Create> Areas>Arbitrary> Through KPs11.Pick 4 corners in counterclockwise order.12.OK in the picking menu.13.Toolbar: SAVE_DB5.1.3.6. Step 6: Establish mesh patterns.To create a mapped mesh, set the specific size controls along the lines (LESIZE command). The establishment of a good finite element mesh is quite important in CFD analyses.The general finite element philosophy of putting more elements in regions with higher solution gradients applies here. The mesh density should be sufficient to enable the program to capture the nature of the phenomena. For example, a small recirculation region is likely to develop in the expansion region. The greater the number of applied elements implies a higher level of flow details that will be captured.Apply 10 elements in the transverse direction (Y) and bias them slightly towards the top and bottom boundaries. This will help capture boundary layer effects. For high Reynolds number problems, finer meshes should be used. Along the inlet flow direction (X) in the inlet, use the number of divisions tabulated below.Mesh Division StrategyTransverse (Y) direction10 divisions - bias towards wallsInlet region, flow direction (X)15 divisions - bias towards inlet and transitionTransition region12 divisions - uniform spacingOutlet region (initial)15 divisions - larger elements near outletBefore attempting this step, plot the lines for clarity.1.Utility Menu> Plot> Lines2.Main Menu> Preprocessor> Meshing>Mesh Tool 3.Choose Lines Set.4.Pick lines in flow direction along the inlet.5.Apply (in the picking menu).6.Enter 15 as the No. of element divisions.7.Enter -2 as the Spacing ratio (this producessmaller elements near both ends of the line). 8.Apply.The mesh ratio chosen results in smaller elements near the inlet, where the flow is developing, and near the expansion, in which more elements will be placed because of the high solution gradients in that region. There should be a relatively smooth transition in element size from region to region throughout the entire problem domain. You will repeat this process of picking the lines and entering the number of divisions and the ratios, using the mesh division strategy above. Note that the mesh division ratio is applied to the direction of the lines, the larger elements being at the end of the line. This is the reason for the use of a number less than 1 for the upper line of the outlet region and a number greater than 1 for the lower line. (The line directions follow a counterclockwise direction, according to how they were generated.) Transition region:9.Pick the top and bottom lines in the centerarea.10.Apply (in the picking menu).11.Enter 12 as the No. of element divisions.12.Enter 1 as the Spacing ratio (uniformspacing).13.Apply. Outlet region:14.Pick the top and bottom lines in the outletregion.15.Apply (in the picking menu).16.Enter 15 as the No. of element divisions.17.Enter 3.0 as the Spacing ratio (bias towardsoutlet).18.OK.Notice that the upper line is not biasedtowards the transition. The line bias needs tobe "flipped."19.Choose Flip in the Mesh Tool. (toggle toMesh Tool as necessary.)20.Pick the upper line only.页码,11/38(W)w5.1.3.7. Step 7: Create the finite element mesh.21.OK (in the picking menu).Transverse direction:22.Choose Lines Set.23.Pick the 4 transverse direction lines.24.OK to close picking menu.25.Enter 10 as the No. of element divisions.26.Enter -2 as the Spacing ratio (bias towardstop and bottom walls).27.OK.28.Toolbar: SAVE_DB.5.1.3.8. Step 8: Create command on the ANSYS Toolbar.The ANSYS Toolbar contains a set of buttons that execute commonly used ANSYS functions. It is convenient to establish a command on the ANSYS Toolbar that turns off the display of the triad at the origin. You will accomplish this by accessing the menu controls on the Utility Menu and then choosing to edit the Toolbar.Enter the command name and command itself as an abbreviation.页码,13/38(W)w5.1.3.9. Step 9: Apply boundary conditions.A velocity of 1 inch/second is applied in the X direction (VX) at the inlet, and a zero velocity is applied in the transverse direction at the inlet (VY in the Y direction). Zero velocities in both directions are applied all along the walls, and a zero pressure is applied at the outlet. These boundary conditions are being applied to the lines now so that they do not have to be applied again if remeshing is required.Apply the inlet boundary condition.1.Main Menu> Preprocessor> Loads > DefineLoads> Apply> Fluid/CFD> Velocity> OnLines2.Pick the inlet line (the vertical line at the farleft).3.OK in the picking menu.4.Enter 1.0 for VX.5.Enter 0.0 for VY.6.OK.Apply the wall boundary conditions. Choosethe lines which make up the walls and thenapply zero velocities in the X and Y directions.7.Main Menu> Preprocessor> Loads> DefineLoads> Apply> Fluid/CFD> Velocity> OnLines8.Pick the six lines on the top and bottom.9.OK in picking menu.10.Enter 0.0 for VX and VY.11.OK to apply the condition.You will subsequently see that the wallcondition of zero velocity will automaticallyprevail at the corners where the inlets intersectthe walls.Apply the outlet condition.12.Main Menu> Preprocessor> Loads> DefineLoads> Apply> Fluid/CFD> Pressure DOF>On Lines13.Pick the outlet line (vertical line on the farright).14.OK (in picking menu).15.Enter 0 for the Pressure value.16.Set endpoints to Yes.17.OK.18.Toolbar: SAVE_DB.At this point, the finite element model iscomplete and the FLOTRAN menus areaccessed to specify the fluid properties alongwith any other FLOTRAN controls that may berequired.5.1.4. Solution (Laminar Analysis)5.1.4.1. Step 10: Establish fluid properties.Fluid properties will be established for air in the “inches” set of units, where the unit of mass is (lb f-sec2)/in.1.Main Menu> Solution> FLOTRAN Set Up>Fluid Properties2.Choose AIR-IN for both density and viscosity.3.OK.4.OK.5.1.4.2. Step 11: Set execution controls.Choose the execution control from the FLOTRAN Set Up Menu.5.1.4.3. Step 12: Change reference conditions.The reference pressure is changed from the default value of 101 KPa to 14.7 psi to maintain a consistent set of units. Likewise, the nominal stagnation and reference temperatures are changed from 293o K to 530o R by setting them to 70o R and adding an offset temperature of 460o R.5.1.4.4. Step 13: Execute FLOTRAN solution.1.Main Menu> Solution> FLOTRAN Set Up>Execution Ctrl2.Enter 40 Global iterations (Note: 40 global iterationsis arbitrary with no guarantee of convergence.)3.OK to apply and close.1.Main Menu> Solution> FLOTRAN Set Up> FlowEnvironment> Ref Conditions2.Change the reference pressure to 14.7 psi (equivalentto 1 atmosphere).3.Change the nominal, stagnation, and referencetemperatures (in o R) to 70.4.Change the temperature offset (in o R) from absolute0 to 460.5.OK.6.Toolbar: SAVE_DB .2.Close the information window when thesolution is done.5.1.5. Postprocessing (Laminar Analysis)5.1.5.1. Step 14: Read in the results for postprocessing.Enter the general postprocessor and read in the latest set of solution results, and then create a vector plot.5.1.5.2. Step 15: Plot velocity vectors.5.1.5.3. Step 16: Plot total pressure contours.5.1.5.4. Step 17: Animate velocity of trace particles.5.1.5.5. Step 18: Make a path plot of velocity through the outlet.1.Main Menu> General Postproc> PlotResults>Defi Trace Pt2.Pick two or three points around the inletregion and one or two points in therecirculation region (along the upper wall ofthe transition region).3.OK (in picking menu).4.Utility Menu> PlotCtrls> Animate>Particle Flow5.Choose DOF Solution.6.Choose Velocity VX.7.OK. Ignore any warning messages aboutmaximum number of loops (Choose Close).ANSYS creates a particle flow path basedupon approximations that do not formclosed loops.The resulting trace plot shows the path offlow particles through the duct.8.Make choices in the Animation Controller(not shown), if necessary, then chooseClose.1.Main Menu> General Postproc> PathOperations> Define Path> By Nodes2.Pick the lowest and then the highest point of the outlet.3.OK (in picking menu).4.Enter OUTLET for the Path Name.5.OK.6.File> Close (Windows)orClose (X11/Motif)Now specify the velocity in the X direction(VX) to map onto the path.7.Main Menu> General Postproc> PathOperations> Map onto Path8.Enter VELOCITY as label.9.Choose DOF Solution.10.Choose Velocity VX.11.OK.12.Main Menu> General Postproc> PathOperations> Plot Path Item> On Graph13.Choose the label VELOCITY that youpreviously defined.14.OK to create path plot.15.Close any warning messages.The resulting path plot shows the flow has an almost fully developed laminar profile. The curvelooks relatively uniform and has a parabolic shape.5.1.6. Solution (Laminar Analysis with Change in Inlet Velocity)5.1.6.1. Step 19: Increase the inlet velocity.The inlet velocity affects the flow profile. Increasing the inlet velocity by a factor of 50 will increase the Reynolds number accordingly. Return to the apply loads function and change the inlet velocity, then execute the solution from a different jobname.5.1.6.2. Step 20: Run the analysis.You will now restart the analysis from the initial result.Now for the next study, investigate the effects ofincreasing the inlet velocity to 50 inches/second.1.Utility Menu> Plot> Lines2.Main Menu> Solution> Define Loads> Apply>Fluid/CFD> Velocity> On Lines3.Pick the inlet line (the vertical line at the far left).4.OK (in picking menu)5.Enter 50 for VX.6.Enter 0 for VY.7.OK.1.Main Menu> Solution> RunFLOTRANAn error message appears stating that thecoefficient matrix has a negative diagonal.ANSYS produced this message because ituses the Streamline Upwind/Petrov-Galerkin (SUPG) advection scheme bydefault. Although it is more accurate thanother advection schemes, the SUPGscheme can lead to spurious oscillations inthe solution, and may cause nonphysicalsolutions or convergence difficulties. Toremedy this situation without changing toanother advection scheme, you will firstadd some modified inertial relaxation, andthen will execute the solution again.2.OK to remove the error message.3.Close.4.Main Menu> Solution> FLOTRANSetup> Relax/Stab/Cap> MIRStabilizatio5.Enter 0.1 for the Momentum Equation.6.OK.7.Main Menu> Solution> RunFLOTRAN Once again, the GraphicalSolution Tracker is displayed.8.Close.You will now repeat the precedingpostprocessing steps exactly to show theeffects of the higher inlet velocity. Thesesteps are as follows:9.Main Menu> General Postproc> ReadResults> Last Set10.Main Menu> General Postproc> PlotResults> Vector Plot> Predefined11.Choose DOF Solution.12.Choose Velocity V.13.OK.5.1.7. Postprocessing (Laminar Analysis Using New Inlet Velocity) 5.1.7.1. Step 21: Plot total pressure contours.5.1.7.2. Step 22: Animate velocity of trace particles.3.Choose Total stagnationpressure.4.OK.The resulting contour plot showsthe total static and dynamicpressures that occur in the duct.1.Main Menu> General Postproc> PlotResults> Defi Trace Pt2.Pick two or three points around the inletregion and one or two points in therecirculation region (along the upper wall ofthe transition region).3.OK (in picking menu).4.Utility Menu> PlotCtrls> Animate>Particle Flow5.Choose DOF Solution.6.Choose Velocity VX.7.OK. Ignore the warning messages aboutmaximum number of loops (Choose Close).ANSYS creates a particle flow path basedupon approximations that do not formclosed loops. The resulting trace plot shows the path of5.1.7.3. Step 23: Make a path plot of velocity through the outlet.flow particles through the duct.8.Make choices in the Animation Controller(not shown), if necessary, then choose Close.1.Main Menu> General Postproc> PathOperations> Define Path> By Nodes2.Pick the lowest and then the highest point ofthe outlet.3.OK (in picking menu).4.Enter OUTLET for the Path Name.5.OK.6.File> Close (Windows)or Close (X11/Motif).Now specify the velocity in the X direction(VX) to map onto the path.7.Main Menu> General Postproc> PathOperations> Map onto Path8.Enter VELOCITY as label.9.Choose DOF Solution.10.Choose Velocity VX.11.OK. 12.Main Menu> General Postproc> PathOperations> Plot Path Item> On Graph13.Choose the label VELOCITY that youpreviously defined.页码,24/38(W)wThe resulting path plot shows the curve has a bias towards one edge of the outlet. This indicates that the flow has not yet fully developed. (Note that if your plot appears as a mirror image of this one, it is because you reversed the order of picking, that is, you picked from highest to lowest instead of from lowest to highest points at the outlet.)Now in the next study, if the length of the duct's outlet region is increased, the flow may reach a fully developed profile. Increase the duct length by 30 inches.5.1.8. Preprocessing (Laminar Analysis with Increase in Duct Length)5.1.8.1. Step 24: Delete pressure boundary condition.The results for the lower viscosity case indicate that the recirculation region has extended wellbeyond the outlet. To allow the flow to fully develop by the time it reaches the exit, it must be given more room to do so.5.1.8.2. Step 25: Construct additional outlet region.14.OK to create path plot.15.Close any warning messages.1.Main Menu> Preprocessor> Loads> Define Loads> Delete> Fluid/CFD> Pressure DOF> On Lines2.Pick All (in picking menu) to delete all pressureboundary conditions.1.Main Menu> Preprocessor>Modeling> Create> Areas>Rectangle> By Dimensions2.Enter the following:X1 =10X2 = 403.Enter the following:Y1 = 0Y2 = 2.54.OK.5.1.8.3. Step 26: Establish mesh divisions for the new rectangle and mesh.The new rectangle has uniquekeypoints and lines. These must bemerged with their counterparts onthe existing areas.5.Main Menu> Preprocessor>Numbering Ctrls> Merge Items6.Choose All for the Type of itemsto be merged.7.OK.A warning message appearsstating that an unmeshed line is tomerged into a previously meshedline. This is as it should be. Closethe message box.8.Close.9.Utility Menu> Plot> Lines1.Main Menu> Preprocessor> Meshing>MeshTool2.Choose Lines Set.3.Pick line at new outlet.4.OK (in picking menu).5.Enter 10 for No. of element divisions (asbefore).页码,26/38(W)w6.Enter -2 for Spacing ratio.7.Apply.Repeat the procedure for the upper and lowerlines of the rectangle.8.Pick lines at the top and bottom of new outlet.9.OK (in picking menu).10.Enter 20 for No. of element divisions.11.Enter 3 for Spacing ratio.12.OK.Flip the line bias on the upper line.13.Choose Lines Flip.14.Pick the upper line.15.OK (in picking menu).16.Toolbar: SAVE_DB.17.Choose Mesh.18.Pick the outlet area.19.OK (in picking menu) to begin mesh.5.1.8.4. Step 27: Apply boundary conditions on new region.You must apply boundary conditions to the new region. You will apply zero velocities in both directions along the walls, and a zero pressure at the outlet.20.Close the Mesh Tool.1.Utility Menu> Plot> Lines2.Main Menu> Preprocessor> Loads>Define Loads> Apply> Fluid/CFD>Velocity> On Lines3.Pick the new upper and lower walls thatdon't have boundary conditions.4.OK (in picking menu).5.Enter 0 for VX and VY.6.OK.Now apply the pressure boundary conditionat the outlet.7.Main Menu> Preprocessor> Loads>Define Loads> Apply> Fluid/CFD>Pressure DOF> On Lines8.Pick the new outlet.9.OK (in picking menu).10.Enter 0 for the Pressure value.11.Set endpoints to Yes.12.OK to apply the boundary condition.13.Utility Menu> Plot> Lines5.1.9. Solution (Laminar Analysis Using New Duct Length)5.1.9.1. Step 28: Change the jobname and execute solution.Because the addition of an outlet has changed the problem domain, a new analysis is required. You can start a new analysis by changing the jobname from the Utility Menu.Note that a warning message will appear stating that you must exit the Solution processor in order to change the name.file.rfl (by default). You can delete afile in one of two ways:Utility Menu> File> FileOperations> DeletePick the file name, then choose OKORExecute a /SYS command and removethe file with the appropriate operatingsystem command.ANSYS will automatically rename anincorrect results file.Now execute the new solution.5.Main Menu> Solution> RunFLOTRAN6.Close the information window whensolution is done.5.1.10. Postprocessing (Laminar Analysis Using New Duct Length) 5.1.10.1. Step 29: Read in the new results and plot velocity vectors.5.1.10.2. Step 30: Plot total pressure contours.The resulting contour plot shows the total static and dynamic pressures that occur in the duct.5.1.10.3. Step 31: Animate velocity of trace particles.Quantities.3.Choose TotalStagnationPressure.4.OK.页码,31/38(W)w 2011/7/14mk:@MSITStore:C:\Program%20Files\ANSYS%20Inc\v110\commonfiles\help\en-us\...7.OK.Ignore the warning messages aboutmaximum number of loops (chooseClose). ANSYS creates a particle flowpath based upon approximations that donot form closed loops.The resulting trace plot shows the pathof flow particles through the duct.8.Make choices in the AnimationController (not shown), if necessary,then choose Close.5.1.10.4. Step 32: Make a path plot of the velocity through the outlet.The outlet velocity profile can be examined with a path plot. First, establish a path for the path plot.The resulting path plot shows that the flow is almost fully developed. Since the velocity has been increased so much, the flow may be in the turbulent regime. The next step is to check the Reynold's number and activate turbulence if necessary. A consequence of the increased diffusion associated with turbulence is a decrease in the size of the recirculation region.5.1.10.5. Step 33: Calculate Reynolds number.Calculate Reynolds number in order to determine if the analysis is indeed in the turbulent region (Re > 3000).Recall that the Reynolds number is determined by the following formula:Our flow material is AIR, which has the following properties:p = density = 1.21e-7V = Velocity = 50path.7.Main Menu> General Postproc>Path Operations> Map onto Path8.Enter "velocity" as the User label.9.Choose DOF solution.10.Choose Velocity VX.11.OK. 12.Main Menu> General Postproc>Path Operations> Plot PathItem> On Graph13.Choose the label VELOCITY thatyou previously defined.14.OK to create path plot.15.Close any warning messages.。
- 1、下载文档前请自行甄别文档内容的完整性,平台不提供额外的编辑、内容补充、找答案等附加服务。
- 2、"仅部分预览"的文档,不可在线预览部分如存在完整性等问题,可反馈申请退款(可完整预览的文档不适用该条件!)。
- 3、如文档侵犯您的权益,请联系客服反馈,我们会尽快为您处理(人工客服工作时间:9:00-18:30)。
案例三
案例四
概况 案例一 案例二
日产591项目各风管压损CFD分析
分析目标
1. 考察各风管在额定风量下的压损。 2. 考察各风管内部流动性。
案例三
案例四
概况
一、空调进风口前端进气室压损CFD分析 进风口
案例一
1
2
案例二
案例三
3
4
出风口
6 5
7
案例四
进风口为:1、2、3、4、5、6; 出风口为:7 。
第一轮优化试验结果对比
本轮分析待试验验证。试验尚未完成。
案例三
案例四
概况
CN200S分风CFD分析报告
案例一 案例二 案例三 案例四
分析目的和条件
• 1、本次分析针对CN200、CN200S(不带风管 和带风管两种状态)空调箱做以下两个工况 的CFD分析,对比CN200和CN200S内部流场。 并考察CN200S带风管各出风口分风比。 a 冷风吹面 b 暖风吹面
各工况下蒸发器表面温度分布均匀,符 合客户要求,蒸发器表面温差3摄氏度以内。
案例三
案例四
概况
日产591项目分风比优化
分析目的
案例一 案例二
591项目由于客户对于出风口位置的输入比较特殊,
分风结构较公司以往结构变化较大,第一次设计方案经 评估,各出风口分风比不能达到设计要求。需要结合CFD 工具,修改数据的同时,反复进行CFD验证,直到达到客 户要求。
概况 案例一
3. CN200S带风管边界条件,简化进气部分,蒸发器加风阻系数0.8,转速3200r/min。 CN200S带风管
案例二
案例三
案例四
一个进气口,四个吹面出口及后吹面出口
概况
4. CN200与CN200S Y轴流动性对比云图 CN200
案例一
案例二
案例三
案例四
CN200S
概况
5. cn200与CN200S 轴侧 流动线性 对比云图 CN200
591项目第一轮方案完成以后,经评估,蒸发器前端壳 体形状不合理,会导致蒸发器表面风速分布严重不均, 直接影响蒸发器热交换能力,需优化。我们设计了两种 方案,进行对比分析。
案例二
案例三 案例四
原始设计
优化方案1
优化方案2
概况 日产591项目蒸发器前端壳体形状优化
模型准备及边界条件输入 案例一
案例二
CN200S 带风管
79.56 81.36
163.08
78.84 80.64
65.88
79.92
86.04
27.83
28.30
388.8 384.9
概况 案例一
3. CN200S冷风吹面 风管分风数据说明
冷风吹面状态, CN200S总风量略有下降。 装上后吹面风管以后,可以看出,前吹面 四个出风口风量相当,又有后吹面风管较 长且形状复杂,后吹面风量有所下降。
案例二
案例三
案例四
概况 案例一
ቤተ መጻሕፍቲ ባይዱ
四、分析CN200与CN200S暖风吹面
1.边界及分析条件:在标准大气压,恒温20℃下分析; 2.给定同条件参数:简化进气部分,蒸发器暖风芯体加风阻系数0.8,转速3200r/min;
CN200
CN200S
案例二
案例三
案例四
一个进气口,左中右三个吹面出口
一个进气口,左中右三个吹面出口及后吹面出口
压力(Pa) 40
60
80
风量(m³/h) 346 421.2 489.6
98 120 540 579.6
案例二
案例三
案例四
概况
3、进气室流动性
案例一
案例二
案例三 案例四
对进气室流动性分析:存在多个明显较大的涡流、紊流区,流速不 均匀,可能使整车噪音增大。
概况
对进气室在恒温20 ℃,标准大气压,额定风量540m³/h分析:
案例一 模式下的风量分配。本轮分析的目标是确定内部风道,
及配风结构的形状,确定各模式下风门开度。
案例二
案例三
案例四
冷风吹面模式
暖风除霜模式
概况
日产591项目分风比优化
第二轮优化结果
第二轮CFD优化做了更多工况下的分析,蓝线划掉部
案例一 分为非重点考察工况。浅蓝及粉红底色为略超差部分。
案例二
案例三
案例四
分析结论 案例一 从流动性及蒸发器表面风速对比来看,方案2更优。后
续壳体设计以方案2为基准,设计完成后加工验证。
案例二
案例三
案例四
概况 日产591项目蒸发器前端壳体形状优化
试验数据对比
案例一 案例二
蒸发器表面风速均化的目的是为了均化
蒸发器表面温度。样件加工完成后,我们通 过试验,测试蒸发器表面风速分布,校核 CFD数据可靠性。
概况
日产591项目分风比优化
第二轮优化结果
案例一 案例二
后吹足与前排吹足的风量分配,根据以前的经验,
分风处一侧风道有90度折弯,另一侧风道直行的情况, CFD结果与试验结果有差异,直行风管CFD分析风量会 比实测的小。
满足上表的分风比的各风门角度如下表。
案例三
案例四
概况 案例一 案例二
日产591项目分风比优化
CN200S
案例一
案例二
案例三
案例四
概况
6. CN200S 轴侧带风管 流动线性云图 CN200S带风管
案例一
案例二
案例三
案例四
概况
三、CN200与CN200S 冷风吹面 风量分配数据对比
1.CFD分析数据; CN200
CN200S
CN200S带风管
案例一
案例二 案例三 案例四
分别对应左中右吹面出口
• 2、分析中不做热交换的计算。
概况 案例一
一、分析CN200与CN200S冷风吹面
1.边界及分析条件:在标准大气压,恒温20℃下分析; 2.给定同条件参数:简化进气部分,蒸发器加风阻系数0.8,转速3200r/min;
CN200
CN200S
案例二
案例三
案例四
一个进气口,左中右三个吹面出口
一个进气口,左中右三个吹面出口及后吹面出口
404Pa
压力为
案例三
案例四
概况
(4)通过静压力云图,分析 结构缺陷 及说明
案例一
案例二
案例三 案例四
两红圈处因前后结构变化剧烈,产生高低压区,严重 增加风管压损, 造成空调整体分风比例不均匀,建议两红圈处修改结构,并分析。
概况
2、风管流动性
案例一
案例二
案例三
案例四 对风管流动性分析:无明显的涡流、紊流区,流线均匀,规则。
概况 案例一
1、分析压损
(1) 分析条件:在恒温20℃,标准大气压下; (2) 通过给定额定出风总风量540m³/h,分析在进气室出风口 静压力为 -98
Pa,即进风室在额定风量下的压损值为98Pa。
(3) 静压力云图如下;
-98Pa
案例二
案例三
案例四
概况 案例一
2、进气室特性曲线
分析条件:在恒温20℃,标准大气压下;
压力为
案例二
案例三
187Pa
案例四
概况
(4)通过静压力云图,分析 结构缺陷 及说明
案例一
案例二 案例三 三红圈处因前后结构变化剧烈,产生高低压区,增加风管压损,可能造成
空调整体分风比例不均匀,建议三红圈处修改结构。
案例四
概况
2、风管流动性
案例一
案例二
案例三
案例四
对风管流动性分析:无明显的涡流、紊流区,流线均匀,规则。
概况
3. CN200S带风管边界条件,简化进气部分,蒸发器加风阻系数0.8,转速3200r/min。 CN200S带风管
案例一
案例二
案例三
案例四
一个进气口,四个吹面出口及后吹面出口
概况
4. cn200与CN200S Y轴流动性对比云图 CN200
案例一
案例二
案例三
案例四
CN200S
概况
5. CN200与CN200S 轴侧 流动线性 对比云图 CN200
以“智”开创 以“和”为富
重庆三电CFD典型案例集
概况 案例一 案例二 案例三 案例四
重庆三电CFD分析能力概况
目前重庆三电有CFD工程师两人,使用软件为西门子UG NX 8.5 Advanced Simulation,求解器 NX THERMAL / FLOW。
自2019年以来,我们使用该分析软件,进行CFD分析, 支持了公司多个项目的开发工作。包括:CN100 改型, CN200 全新空调设计,CN200S 改型设计,日产591项目等。 通过不断的摸索,我们已总结出一套行之有效的分析方法和 流程,能够较为准确的进行总风量计算,内部流场优化,风 量分配计算,流阻测量等工作。
CN200S
案例一
案例二
案例三
案例四
概况
6. CN200S 轴侧带风管 流动线性云图 CN200S带风管
案例一
案例二
案例三
案例四
概况
六、CN200与CN200S 暖风吹面风量分配数据对比
1.CFD分析数据;
CN200
CN200S
CN200S带风管
案例一
案例二 案例三 案例四
分别对应左中右吹面出口 及总风量
案例三
案例四
概况
日产591项目分风比优化
第一轮优化目标及边界条件
案例一
由于第三次样件交期要求,第一轮优化针对吹面,
除霜二个基本工况的冷暖模式,进行优化,达到客户分 风比要求。吹足吹面、吹足除霜1,吹足除霜2两个工况 及混合风门中间状态不做分析。