金融市场与净现值分析报告(英文版)
银行投资与资本市场分析报告 英文版
100
50
0 1Q01
3Q01
1Q02
3Q02
1Q03
3Q03
1Q04
$B 600
M&A Advisory(1)
400
200
0 1Q01
3Q01
1Q02
3Q02
1Q03
3Q03
1Q04
$B 1000 800 600 400 200 0 1Q01
US Bond Trading(2)
3Q01 1Q02 3Q02 1Q03 3Q03
Trading
95%
revenue as
percentage
of total
90%
revenues
1Q04
85%
80%
75%
70%
Trading Revenues 1Q04 versus 4Q03
DB
UBS
BS LB JPMC
MS
Citi
GS CSFB
ML
CF&A
30%
revenue as
percentage
-9-
Global Investment-Banking Landscape
Q1 2004 Market Report-BR-TM-NYC-24May04.ppt
-10-
SEVERAL WINNERS IN THE 2003 INVESTMENT BANKING LANDSCAPE
BCG investment banking performance index climbed 40 points to a record level of 127.6 in the first quarter 2004
财务分析报告英文版

The short term liquid ratio has retained stable at around 1.5, indicating good short term liquid management and debt servicing ability
Intangible Assets
An evaluation of these assets as trademarks, patents, and goodwill, their value, and the impact they have on the company's operations
A breakdown of inventory by category, its value, and the carrying cost The analysis also includes an assessment of inventory turnover rates and objectivity
To assist management in making informed decisions about the future direction of the company
03
02
Overview of Financial Performance
Revenue Analysis
The company's revenue is seasonal, with the fourth quarter being the peak period due to holiday spending and end of year sales
英文分析财务报告模板(3篇)
第1篇Executive SummaryThis document provides an analysis of the financial report for [Company Name], covering the period from [Start Date] to [End Date]. The analysis aims to provide a comprehensive overview of the company's financial performance, including key financial ratios, trends, and comparisons with industry benchmarks. This report will assist stakeholders in understanding the company's financial health and making informed decisions.1. Introduction[Company Name] is a [industry] company with [brief description of the company's operations]. The financial report includes a summary of the company's financial statements, which are prepared in accordance with [financial reporting standards, e.g., International Financial Reporting Standards (IFRS) or Generally Accepted Accounting Principles (GAAP)].2. Financial Statements Analysis2.1 Balance SheetThe balance sheet provides a snapshot of the company's financialposition at a specific point in time. The following key components are analyzed:Assets: Analyze the composition of assets, including current assets (cash, receivables, inventory) and non-current assets (property, plant, and equipment). Assess the liquidity and solvency of the company by examining the current ratio and debt-to-equity ratio.Liabilities: Examine the composition of liabilities, including current liabilities (short-term debt, accounts payable) and long-termliabilities (long-term debt, deferred tax liabilities). Analyze the company's ability to meet its short-term and long-term obligations by evaluating the current ratio and debt service coverage ratio.Equity: Assess the changes in equity over the reporting period, including retained earnings and additional paid-in capital. Analyze the impact of earnings, dividends, and share issuances on equity.2.2 Income StatementThe income statement provides information about the company's revenues, expenses, and profitability over a specific period. The following key components are analyzed:Revenue: Examine the sources of revenue, including sales of products or services and other operating income. Analyze revenue trends and growth rates to assess the company's market position and potential for future growth.Expenses: Analyze the composition of expenses, including cost of goods sold, selling, general, and administrative expenses, and other operating expenses. Evaluate the efficiency of the company's cost structure by examining cost-to-sales ratios and gross margin.Net Income: Assess the company's profitability by examining net income and net profit margin. Analyze the factors contributing to changes in net income over the reporting period.2.3 Cash Flow StatementThe cash flow statement provides information about the company's cash inflows and outflows over a specific period. The following key components are analyzed:Operating Cash Flow: Examine the cash generated from the company's core operations. Analyze the operating cash flow margin to assess the company's ability to generate cash from its business activities.Investing Cash Flow: Analyze the cash used for and generated from investing activities, including the purchase or sale of assets, investments, and acquisitions. Assess the company's investment strategy and capital expenditure requirements.Financing Cash Flow: Examine the cash used for and generated from financing activities, including the issuance or repurchase of shares, debt financing, and dividends. Analyze the company's financing strategy and its impact on debt levels and equity.3. Key Financial RatiosThis section presents a summary of key financial ratios, including liquidity ratios, solvency ratios, profitability ratios, and efficiency ratios. The following ratios are analyzed:Liquidity Ratios: Current Ratio, Quick Ratio, and Cash RatioSolvency Ratios: Debt-to-Equity Ratio, Interest Coverage Ratio, andDebt Service Coverage RatioProfitability Ratios: Gross Margin, Operating Margin, Net Profit Margin, Return on Assets, and Return on EquityEfficiency Ratios: Inventory Turnover Ratio, Receivables Turnover Ratio, and Payables Turnover Ratio4. Trends and ComparisonsThis section analyzes the trends and performance of [Company Name] in comparison to industry benchmarks and competitors. The following aspects are considered:Revenue Growth: Compare the company's revenue growth rate with industry averages and key competitors.Profitability: Assess the company's profitability ratios in comparison to industry benchmarks and competitors.Financial Risk: Compare the company's solvency and liquidity ratioswith industry averages and competitors.Efficiency: Evaluate the company's operational efficiency by comparing efficiency ratios with industry benchmarks and competitors.5. ConclusionBased on the analysis of [Company Name]'s financial report, the following conclusions can be drawn:[Summary of key findings, including strengths, weaknesses, opportunities, and threats][Recommendations for stakeholders, including areas for improvement and potential investment opportunities]6. AppendicesThis section includes additional supporting information, such as:Detailed financial statementsIndustry benchmarks and competitor dataCharts and graphs illustrating financial trendsBy utilizing this financial report analysis template, stakeholders can gain a deeper understanding of [Company Name]'s financial performance and make informed decisions regarding their investments and business relationships.第2篇Executive SummaryThis document provides an in-depth analysis of the financial report for [Company Name] for the fiscal year [Year]. The analysis covers key financial metrics, trends, and insights that are critical for stakeholders to understand the company's financial health, performance, and future prospects. The report is divided into several sections, each focusing on a different aspect of the company's financial performance.1. Introduction[Company Name] is a [Industry] company that has been operating in the market for [Number of years]. The company's primary products/services are [List primary products/services]. The financial report for the fiscal year [Year] provides a comprehensive overview of the company'sfinancial performance, including revenue, expenses, assets, liabilities, and equity.2. Financial HighlightsThe following are the key financial highlights for the fiscal year [Year]:- Revenue: [Amount] (up/down from [Previous Year])- Net Income: [Amount] (up/down from [Previous Year])- Earnings Per Share (EPS): [Amount] (up/down from [Previous Year])- Return on Equity (ROE): [Percentage] (up/down from [Previous Year])- Current Ratio: [Ratio] (up/down from [Previous Year])- Debt-to-Equity Ratio: [Ratio] (up/down from [Previous Year])3. Revenue Analysis3.1 Revenue BreakdownThe revenue for the fiscal year [Year] was [Amount], which is [Percentage] higher/lower than the previous year. The breakdown of revenue by product/service category is as follows:- Product/Service A: [Amount] (Percentage of Total Revenue)- Product/Service B: [Amount] (Percentage of Total Revenue)- Product/Service C: [Amount] (Percentage of Total Revenue)- Other: [Amount] (Percentage of Total Revenue)3.2 Revenue Growth AnalysisThe increase/decrease in revenue can be attributed to the following factors:- Market Expansion: The company has expanded its market presence in [Regions/Countries].- Product Launches: The introduction of [New Products/Services] has contributed to the revenue growth.- Price Increase: The company has implemented a price increase for its products/services.- Volume Increase: There has been an increase in the volume of sales for [Specific Products/Services].4. Expense Analysis4.1 Cost of Goods Sold (COGS)The COGS for the fiscal year [Year] was [Amount], which represents [Percentage] of the total revenue. The main components of COGS include:- Raw Materials: [Amount]- Manufacturing Costs: [Amount]- Direct Labor: [Amount]- Other Direct Costs: [Amount]4.2 Operating ExpensesThe operating expenses for the fiscal year [Year] were [Amount], which includes the following categories:- Salaries and Wages: [Amount]- Marketing and Sales: [Amount]- Research and Development: [Amount]- General and Administrative Expenses: [Amount]5. Profitability Analysis5.1 Gross MarginThe gross margin for the fiscal year [Year] was [Percentage], which is [Percentage] higher/lower than the previous year. The factors contributing to the change in gross margin are:- Cost Savings: The company has implemented cost-saving measures in the production process.- Product Mix: There has been a shift in the product mix towards higher-margin products/services.- Volume Increase: The increase in sales volume has helped to improve the gross margin.5.2 Net Profit MarginThe net profit margin for the fiscal year [Year] was [Percentage], which is [Percentage] higher/lower than the previous year. The factors contributing to the change in net profit margin are:- Operating Efficiency: The company has improved its operating efficiency, leading to lower operating expenses.- Tax Rate: There has been a change in the tax rate, affecting the net profit margin.6. Liquidity and Solvency Analysis6.1 Current RatioThe current ratio for the fiscal year [Year] was [Ratio], indicatingthat the company has [Sufficient/Insufficient] liquidity to meet its short-term obligations.6.2 Debt-to-Equity RatioThe debt-to-equity ratio for the fiscal year [Year] was [Ratio], indicating that the company's leverage is [High/Low].7. Investment Analysis7.1 Capital ExpendituresThe company has allocated [Amount] for capital expenditures during the fiscal year [Year], primarily for [List of Capital Expenditure Projects].7.2 Dividends and Stock RepurchasesThe company has declared a dividend of [Amount] per share and has repurchased [Number of Shares] of its stock during the fiscal year [Year].8. ConclusionThe financial report for the fiscal year [Year] indicates that [Company Name] has achieved strong financial performance, with revenue growth and improved profitability. The company's liquidity and solvency ratios are also healthy, indicating a strong financial position. However, there are certain risks and challenges that the company needs to address, such as increasing competition and fluctuating raw material prices. The management is committed to addressing these challenges and continuing to drive the company's growth.9. Appendices- Financial Statements: Detailed financial statements including the balance sheet, income statement, and cash flow statement.- Notes to Financial Statements: Additional information and explanations related to the financial statements.- Additional Analysis: Any additional analysis or data that supports the findings of the report.End of Report第3篇Executive SummaryThe purpose of this report is to provide a comprehensive analysis of the financial performance of [Company Name] for the fiscal year [Year]. This analysis covers key financial statements, including the balance sheet, income statement, and cash flow statement, and highlights the financial health, profitability, liquidity, and solvency of the company. Thereport also includes a discussion on the major trends and drivers behind the financial results, as well as recommendations for future actions.1. Introduction[Company Name] is a [industry] company with [number of employees] employees, operating in [location]. The company's primaryproducts/services are [list of products/services], and it generates revenue through [list of revenue streams]. This report aims to evaluate the company's financial performance by examining its financial statements and other relevant data.2. Financial Statements Analysis2.1 Balance SheetThe balance sheet provides a snapshot of the company's financialposition at a specific point in time. The following analysis focuses on key components of the balance sheet:Assets: The total assets of [Company Name] stood at [amount] as of [date]. This includes current assets such as cash and cash equivalents, receivables, and inventory, as well as non-current assets like property, plant, and equipment.Liabilities: The company's total liabilities were [amount] as of [date], which includes short-term liabilities like accounts payable and long-term liabilities such as long-term debt.Equity: The equity section of the balance sheet shows the shareholders' equity, which includes common stock, retained earnings, and other reserves. The shareholders' equity of [Company Name] was [amount] as of [date].2.2 Income StatementThe income statement provides an overview of the company's revenues, expenses, and net income for a specific period. The following points highlight the key aspects of the income statement:Revenue: The company's total revenue for the fiscal year [Year] was [amount], reflecting a [percentage] increase/decrease from the previous year.Cost of Goods Sold (COGS): The COGS for the year was [amount], representing [percentage] of the total revenue. This includes the cost of materials, labor, and other production expenses.Gross Profit: The gross profit for the year was [amount], which is the revenue minus the COGS.Operating Expenses: The operating expenses, including selling, general, and administrative expenses, were [amount]. This includes salaries, marketing, and other overhead costs.Net Income: The net income for the fiscal year [Year] was [amount], which represents the profit after all expenses have been deducted from the revenue.2.3 Cash Flow StatementThe cash flow statement provides information about the cash inflows and outflows of the company during a specific period. The following analysis focuses on the key components of the cash flow statement:Operating Cash Flow: The operating cash flow for the fiscal year [Year] was [amount], which indicates the cash generated from the company's core operations.Investing Cash Flow: The investing cash flow was [amount], which includes cash flows from the purchase/sale of assets, investments, and loans.Financing Cash Flow: The financing cash flow was [amount], which includes cash flows from the issuance/redeem of equity, debt, and payment of dividends.3. Financial Ratios AnalysisFinancial ratios are used to assess the financial health and performance of a company. The following ratios are used in this analysis:Current Ratio: The current ratio of [Company Name] was [ratio], indicating that the company has [sufficient/insufficient] liquidity to meet its short-term obligations.Debt-to-Equity Ratio: The debt-to-equity ratio of the company was [ratio], which suggests that the company has [high/low] financial leverage.Return on Assets (ROA): The ROA of the company was [percentage], which indicates the efficiency of the company in using its assets to generate profits.Return on Equity (ROE): The ROE of the company was [percentage], which shows the return on the shareholders' equity.4. Major Trends and DriversSeveral key trends and drivers influenced the financial performance of [Company Name] during the fiscal year [Year]:Market Conditions: The overall market conditions, including the demand for [product/service], had a significant impact on the company's revenue.Product Mix: Changes in the product mix, such as an increase in the sales of [product], contributed to the revenue growth.Cost Management: The company's focus on cost management helped in improving the operating margins.5. RecommendationsBased on the analysis of the financial statements and other relevant data, the following recommendations are made:Focus on Product Innovation: The company should continue to invest in research and development to introduce new products and enhance the existing ones.Cost Optimization: The company should explore opportunities to further optimize its costs, especially in the areas of operations and marketing.Leverage Technology: The company should leverage technology to improve its operational efficiency and customer experience.ConclusionThe financial report analysis of [Company Name] for the fiscal year [Year] indicates that the company has achieved significant growth in revenue and profitability. However, there are areas where the companycan improve its financial performance. By focusing on product innovation, cost optimization, and leveraging technology, [Company Name] cancontinue to grow and remain competitive in the market.Note: This template is a general framework for analyzing financial reports. The specific content and analysis may vary depending on the company and industry.。
(2023)财务分析报告英文版课件(一)

(2023)财务分析报告英文版课件(一)2023财务分析报告英文版课件Introduction•Overview of the company•Financial highlights of the yearAnalysis of Income Statement•Revenue growth•Gross profit margin•Operating expenses•Net incomeAnalysis of Balance Sheet•Current assets and liabilities•Long-term assets and liabilities•Debt to equity ratio•Working capitalAnalysis of Cash Flow Statement•Operating cash flow•Investing cash flow•Financing cash flow•Free cash flowKey Performance Indicators (KPIs)•Return on Investment (ROI)•Return on Equity (ROE)•Earnings per Share (EPS)•Debt to Asset RatioConclusion•Summary of analysis•Recommendations for future improvement•Outlook for the company’s financial performance in the coming year.Analysis of Income StatementRevenue growth•Analysis of revenue growth in comparison to previous years•Analysis of revenue growth in comparison to industry standards•Factors that contributed to the change in revenueGross profit margin•Analysis of the company’s gross profit margin in comparison to previous years•Analysis of the company’s gross profit margin in comparison to industry standards•Examination of factors that contributed to changes in gross profit marginOperating expenses•Analysis of operating expenses and how they have changed over time•Comparison of operating expenses with industry standards •Examination of factors that contributed to changes in operating expensesNet income•Analysis of the company’s net income over time •Comparison of net income with industry standards •Examination of factors that contributed to changes in net incomeAnalysis of Balance SheetCurrent assets and liabilities•Analysis of the company’s current assets and how they have changed over time•Examination of the company’s current liabilities and how they have changed•Calculation of the current ratio and analysis of what it signifiesLong-term assets and liabilities•Analysis of the company’s long-term assets and how they have changed over time•Examination of the company’s long-term liabilities and how they have changed•Calculation of the debt to equity ratio and analysis of what it signifiesWorking capital•Analysis of the company’s working capital and how it has changed over time•Comparison of the company’s working capital with industry standards•Examination of factors that contributed to changes in working capitalAnalysis of Cash Flow StatementOperating cash flow•Analysis of the company’s operating cash flow over time •Comparison of the operating cash flow with industry standards•Examination of factors that contributed to changes in operating cash flowInvesting cash flow•Analysis of the company’s investing cash flow over time •Comparison of the investing cash flow with industry standards•Examination of factors that contributed to changes in investing cash flowFinancing cash flow•Analysis of the company’s financing cash flow over time •Comparison of the financing cash flow with industry standards•Examination of factors that contributed to changes in financing cash flowFree cash flow•Calculation of the company’s free cash flow and analysis of what it signifies•Analysis of the company’s free cash flow over time •Comparison of the company’s free cash flow with industry standardsKey Performance Indicators (KPIs)Return on Investment (ROI)•Calculation of ROI and analysis of what it signifies •Analysis of the company’s ROI over time•Comparison of the company’s ROI with industry standardsReturn on Equity (ROE)•Calculation of ROE and analysis of what it signifies •Analysis of the company’s ROE over time•Comparison of the company’s ROE with industry standardsEarnings per Share (EPS)•Calculation of EPS and analysis of what it signifies •Analysis of the company’s EPS over time•Comparison o f the company’s EPS with industry standardsDebt to Asset Ratio•Calculation of debt to asset ratio and analysis of what it signifies•Analysis of the company’s debt to asset ratio over time •Comparison of the company’s debt to asset ratio with industry standardsConclusionSummary of analysis•Overview of the company’s financial performance•Key findings from the analysis of the income statement, balance sheet, and cash flow statement•Analysis of the company’s KPIs and what they signifyRecommendations for future improvement•Suggestions for how the company can improve its financial performance•Recommendations for changes in strategy or investmentsOutlook for the company’s financial performance in the coming year.•Analysis of expected changes in the company’s financial performance•Evaluation of factors that could impact the company’s financial performance in the coming year.。
英文财务季度分析报告(3篇)

第1篇Executive SummaryThis report provides a comprehensive analysis of the financial performance of [Company Name] for the quarter ending [Date]. The analysis covers key financial metrics, revenue trends, cost analysis, and profitability. The report aims to assess the company’s financial health, identify areas of strength and weakness, and provide insights for future strategic decisions.1. Introduction[Company Name] is a [brief description of the company’s industry and main products/services]. The company operates in a highly competitive market and has been striving to maintain its market share and profitability. This report aims to evaluate the company’s financial performance over the past quarter and provide recommendations for improvement.2. Financial Highlights2.1 RevenueThe total revenue for the quarter ending [Date] was [Amount], representing a [percentage] increase/decrease from the previous quarter and a [percentage] increase/decrease from the same quarter last year. The revenue growth can be attributed to [key factors contributing to revenue growth, such as new product launches, market expansion, or increased sales in existing markets].2.2 ProfitabilityThe net income for the quarter was [Amount], resulting in a net margin of [percentage]. This represents a [percentage] increase/decrease from the previous quarter and a [percentage] increase/decrease from the same quarter last year. The improved profitability can be attributed to [key factors contributing to increased profitability, such as cost reduction measures, improved operational efficiency, or higher sales margins].2.3 Operating ExpensesOperating expenses for the quarter were [Amount], which represents a [percentage] increase/decrease from the previous quarter. The main contributors to the increase/decrease in operating expenses were [mention specific expenses, such as marketing, research and development, or administrative costs].2.4 Cash FlowThe company’s cash flow from operations was [Amount], indicating a [percentage] increase/decrease from the previous quarter. Theincrease/decrease in cash flow can be attributed to [key factors, such as improved collections from customers, reduced accounts payable, or increased sales].3. Revenue Analysis3.1 Product/Service Line AnalysisThe revenue breakdown by product/service line is as follows:- Product/Service Line A: [Percentage of total revenue] with revenue of [Amount]- Product/Service Line B: [Percentage of total revenue] with revenue of [Amount]- Product/Service Line C: [Percentage of total revenue] with revenue of [Amount]The highest-growth product/service line was [Product/Service Line A], which saw a [percentage] increase in revenue. This growth can be attributed to [factors contributing to the growth, such as new market segments, product enhancements, or increased marketing efforts].3.2 Geographic AnalysisThe revenue breakdown by geographic region is as follows:- Region A: [Percentage of total revenue] with revenue of [Amount]- Region B: [Percentage of total revenue] with revenue of [Amount]- Region C: [Percentage of total revenue] with revenue of [Amount]Region A was the highest contributor to revenue, accounting for [percentage] of the total. The growth in this region can be attributedto [factors contributing to the growth, such as successful market entry, increased demand, or local economic growth].4. Cost Analysis4.1 Cost of Goods Sold (COGS)The COGS for the quarter was [Amount], representing [percentage] oftotal revenue. The main drivers of COGS were [mention specific cost components, such as raw materials, labor, or manufacturing overhead]. The cost of goods sold increased by [percentage] from the previous quarter, primarily due to [factors contributing to the increase, such as price increases for raw materials or increased production volumes].4.2 Selling, General, and Administrative (SG&A) ExpensesSG&A expenses for the quarter were [Amount], which represents [percentage] of total revenue. The main components of SG&A expenses were [mention specific expense categories, such as salaries, marketing, or administrative costs]. The increase/decrease in SG&A expenses can be attributed to [factors contributing to the change, such as changes in staffing levels, marketing campaigns, or other administrative activities].5. Profitability Analysis5.1 Gross MarginThe gross margin for the quarter was [percentage], which represents a [percentage] increase/decrease from the previous quarter. Theincrease/decrease in gross margin can be attributed to [factors contributing to the change, such as changes in product mix, cost savings, or improved pricing strategies].5.2 Operating MarginThe operating margin for the quarter was [percentage], reflecting a [percentage] increase/decrease from the previous quarter. Theincrease/decrease in operating margin can be attributed to [factors contributing to the change, such as improved operational efficiency, reduced operating expenses, or increased revenue].6. Key Findings and Recommendations6.1 Key Findings- Revenue growth was driven by [key factors].- Profitability improved due to [key factors].- Cost of goods sold increased primarily due to [factors].- SG&A expenses were [increase/decrease], driven by [factors].6.2 Recommendations- Continue to invest in [key areas, such as product development, marketing, or market expansion].- Evaluate the effectiveness of cost-saving initiatives and implement further measures where necessary.- Monitor the performance of [key product/service lines or geographic regions] and adjust strategies accordingly.- Strengthen cash flow management to ensure adequate liquidity.7. ConclusionThis report provides a detailed analysis of [Company Name]’s financial performance for the quarter ending [Date]. The company has shown strong revenue growth and improved profitability, driven by various factors. However, there are areas that require attention, such as cost management and operational efficiency. By implementing the recommended strategies, [Company Name] can continue to strengthen its financial position and achieve long-term success.Appendix- Detailed financial statements- Breakdown of revenue by product/service line and geographic region- Analysis of key financial ratios- Trend analysis of key financial metricsNote: This report is for internal use only and should not be distributed without the permission of [Company Name].第2篇IntroductionThis report provides a comprehensive analysis of the financial performance of [Company Name] for the quarter ending [Date]. Theanalysis covers key financial metrics, profitability, liquidity, solvency, and efficiency ratios, as well as a discussion of the major factors influencing the company's performance during the quarter. The report aims to offer insights into the financial health of the company and guide stakeholders in making informed decisions.Executive SummaryThe financial performance of [Company Name] for the quarter ending [Date] has been robust, with a significant increase in revenue and profit margins. The company has demonstrated strong operational efficiency and has maintained a healthy liquidity position. However, challenges in the market and competitive pressures require continued vigilance andstrategic adjustments to ensure sustained growth.Revenue AnalysisTotal revenue for the quarter was [Amount], reflecting a [Percentage] increase from the previous quarter and a [Percentage] increase from the same quarter last year. The growth in revenue can be attributed to several factors:1. Increased Sales Volume: Sales volume increased by [Percentage],driven by strong demand in [Product/Service Category].2. Product Mix Improvement: The company has successfully shifted its product mix towards higher margin products, contributing to a [Percentage] increase in revenue.3. Geographical Expansion: The company has expanded its market reach, particularly in [Region/Country], which has led to a [Percentage] increase in revenue.Profitability AnalysisNet profit for the quarter was [Amount], representing a [Percentage] increase from the previous quarter and a [Percentage] increase from the same quarter last year. The increase in profitability can be attributed to the following factors:1. Cost Control: The company has successfully implemented cost control measures, resulting in a [Percentage] decrease in operating expenses.2. Efficiency Improvements: Operational efficiency has improved by [Percentage], leading to lower production costs.3. Price Increases: The company has implemented price increases in certain products, which has contributed to higher profit margins.Liquidity AnalysisThe company's liquidity position remains strong, with a current ratio of [Ratio] and a quick ratio of [Ratio]. The current ratio indicates that the company has sufficient current assets to cover its current liabilities, while the quick ratio demonstrates the company's ability to meet its short-term obligations without relying on inventory.Solvency AnalysisThe company's solvency position is also healthy, with a debt-to-equity ratio of [Ratio]. This ratio indicates that the company's equity is [Percentage] of its total assets, suggesting a low level of financial leverage.Efficiency AnalysisThe company's operational efficiency has improved, as evidenced by the following ratios:1. Inventory Turnover: The inventory turnover ratio has increased to [Ratio], indicating a faster turnover of inventory.2. Accounts Receivable Turnover: The accounts receivable turnover ratio has improved to [Ratio], suggesting improved collection efficiency.3. Fixed Asset Turnover: The fixed asset turnover ratio has increased to [Ratio], indicating more efficient use of fixed assets.Risk FactorsDespite the positive financial performance, several risk factors need to be monitored:1. Competition: Intense competition in the market may erode profit margins.2. Economic Conditions: Economic downturns can impact consumer spending and demand for the company's products/services.3. Regulatory Changes: Changes in regulations may increase costs and impact the company's operations.ConclusionThe financial performance of [Company Name] for the quarter ending [Date] has been commendable, with strong revenue growth and improved profitability. The company's strong liquidity and solvency positions, along with its operational efficiency, indicate a healthy financial outlook. However, continued vigilance and strategic adjustments are required to address potential risks and ensure sustained growth.Recommendations1. Market Expansion: Continue to explore new markets and expand the company's geographical reach.2. Product Development: Invest in research and development to create innovative products that meet customer needs.3. Cost Management: Maintain a focus on cost control and operational efficiency to ensure sustainable profitability.4. Risk Management: Develop strategies to mitigate potential risks, such as economic downturns and regulatory changes.By implementing these recommendations, [Company Name] can continue to build a strong financial foundation and achieve long-term success.AppendixThe following tables provide a detailed breakdown of the financial metrics discussed in this report:1. Revenue Breakdown by Product/Service2. Profit and Loss Statement3. Balance Sheet4. Cash Flow StatementThis report is intended to provide a comprehensive analysis of [Company Name]'s financial performance for the quarter ending [Date]. For further information or clarification, please refer to the appendices or contact the financial team.[Signature][Name][Title][Company Name][Date]第3篇Executive SummaryThis report provides a comprehensive analysis of the financial performance of [Company Name] for the third quarter of [Fiscal Year].The report covers key financial metrics, profitability, liquidity, solvency, and operational efficiency. It also includes an analysis of the external environment and a discussion on the potential risks and opportunities facing the company. The objective is to provide stakeholders with insights into the company's financial health and its prospects for the future.1. Introduction[Company Name] is a leading [industry/sector] company with a strong presence in [key markets/geographical regions]. The company operates through [number of business segments] segments, each contributing to the overall financial performance. This report focuses on the financial performance of the company for the third quarter of [Fiscal Year], comparing it with the same period in the previous year and with the industry benchmarks.2. Financial HighlightsRevenue: Total revenue for the third quarter was [amount], representing a [percentage] increase/decrease compared to the same period last year. This growth was driven by [key factors, e.g., new product launches, increased market share, expansion into new markets].Net Income: Net income for the third quarter was [amount], reflecting a [percentage] increase/decrease compared to the same period last year. The increase/decrease was primarily due to [factors such as improved operating margins, cost reductions, or changes in tax laws].Earnings Per Share (EPS): EPS for the third quarter was [amount], indicating a [percentage] increase/decrease from the same period last year. This increase/decrease was primarily due to [factors such as higher net income and a decrease/increase in the number of outstanding shares].Return on Equity (ROE): ROE for the third quarter was [percentage],up/down from [percentage] in the same period last year. Theimprovement/deterioration was primarily due to [factors such as increased net income and a decrease/increase in equity].Current Ratio: The current ratio for the third quarter was [ratio], indicating [solvency position, e.g., strong liquidity, sufficient to cover short-term obligations].Debt-to-Equity Ratio: The debt-to-equity ratio for the third quarter was [ratio], showing [financial leverage, e.g., moderate leverage, indicating a balanced capital structure].3. Detailed Financial Analysis3.1 Revenue AnalysisSegment-wise Revenue: The breakdown of revenue by segment is as follows:Segment A: [amount], representing [percentage] of total revenue.Segment B: [amount], representing [percentage] of total revenue.Segment C: [amount], representing [percentage] of total revenue.Product-wise Revenue: The breakdown of revenue by product is as follows:Product X: [amount], representing [percentage] of total revenue.Product Y: [amount], representing [percentage] of total revenue.Product Z: [amount], representing [percentage] of total revenue.Market-wise Revenue: The breakdown of revenue by market is as follows:Market A: [amount], representing [percentage] of total revenue.Market B: [amount], representing [percentage] of total revenue.Market C: [amount], representing [percentage] of total revenue.3.2 Profitability AnalysisGross Margin: The gross margin for the third quarter was [percentage], up/down from [percentage] in the same period last year. The change was primarily due to [factors such as increased sales volume, cost reductions, or changes in product mix].Operating Margin: The operating margin for the third quarter was [percentage], up/down from [percentage] in the same period last year. The change was primarily due to [factors such as improved operational efficiency, cost reductions, or changes in revenue mix].Net Margin: The net margin for the third quarter was [percentage],up/down from [percentage] in the same period last year. The change was primarily due to [factors such as increased net income, lower interest expenses, or changes in tax laws].3.3 Liquidity and Solvency AnalysisCurrent Ratio: The current ratio remained stable at [ratio], indicating that the company has sufficient liquidity to meet its short-term obligations.Debt-to-Equity Ratio: The debt-to-equity ratio has increased/decreased to [ratio], reflecting [financial leverage position, e.g., a moderate increase in leverage, which may be a strategic move to fund growth initiatives].Interest Coverage Ratio: The interest coverage ratio for the third quarter was [ratio], indicating that the company has[adequate/inadequate] ability to cover its interest expenses with its operating income.4. External Environment AnalysisThe external environment has been characterized by [key factors, e.g., economic growth, industry trends, regulatory changes, and technological advancements]. These factors have had both positive and negative impacts on the company's financial performance.4.1 Positive FactorsEconomic Growth: The global economy has shown signs of recovery, which has led to increased demand for [company's products/services].Industry Trends: The industry is witnessing [trends, e.g.,technological advancements, increased customer expectations, and consolidation].Technological Advancements: The company has been investing intechnology to improve its operational efficiency and product offerings.4.2 Negative FactorsRegulatory Changes: New regulations in [industry] have increased compliance costs for the company.Competition: The company faces increased competition from [competitors], which has put pressure on pricing and margins.5. Risks and Opportunities5.1 RisksEconomic Downturn: A global economic downturn could lead to reduced demand for the company's products/services.Competition: Intense competition could erode market share and profitability.Regulatory Changes: New regulations could increase costs and hinder growth.5.2 OpportunitiesMarket Expansion: The company has opportunities to expand into new markets and customer segments.Product Innovation: The development of new products and services can drive growth and improve profitability.Partnerships: Strategic partnerships can enhance the company's competitive position and market reach.6. Conclusion[Company Name] has delivered a strong financial performance in the third quarter of [Fiscal Year], driven by [key factors]. The company has a robust financial position and is well-positioned to capitalize on the opportunities in the external environment. However, it also faces significant risks, which need to be managed effectively. The management team is committed to driving sustainable growth and creating value for its stakeholders.7. RecommendationsContinue to invest in research and development to enhance product offerings.Explore strategic partnerships to expand market reach.Monitor regulatory changes and ensure compliance.Implement cost reduction initiatives to improve profitability.8. AppendicesFinancial StatementsKey RatiosIndustry BenchmarksManagement CommentaryNote: This report is a template and should be customized to reflect the specific financial data and circumstances of [Company Name].。
英文版财务报告分析(3篇)
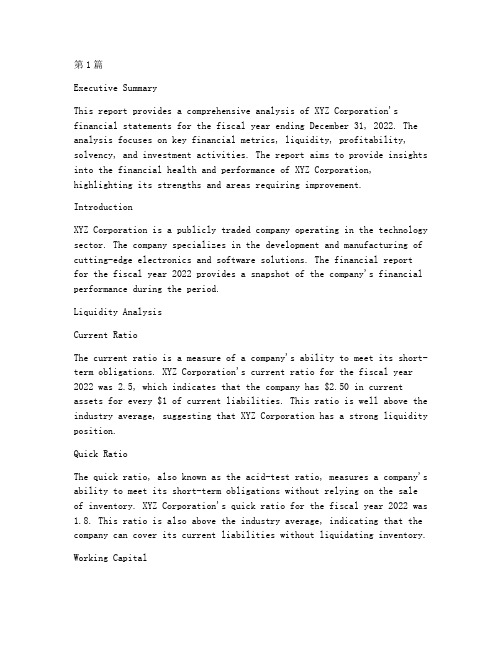
第1篇Executive SummaryThis report provides a comprehensive analysis of XYZ Corporation's financial statements for the fiscal year ending December 31, 2022. The analysis focuses on key financial metrics, liquidity, profitability, solvency, and investment activities. The report aims to provide insights into the financial health and performance of XYZ Corporation, highlighting its strengths and areas requiring improvement.IntroductionXYZ Corporation is a publicly traded company operating in the technology sector. The company specializes in the development and manufacturing of cutting-edge electronics and software solutions. The financial reportfor the fiscal year 2022 provides a snapshot of the company's financial performance during the period.Liquidity AnalysisCurrent RatioThe current ratio is a measure of a company's ability to meet its short-term obligations. XYZ Corporation's current ratio for the fiscal year 2022 was 2.5, which indicates that the company has $2.50 in current assets for every $1 of current liabilities. This ratio is well above the industry average, suggesting that XYZ Corporation has a strong liquidity position.Quick RatioThe quick ratio, also known as the acid-test ratio, measures a company's ability to meet its short-term obligations without relying on the sale of inventory. XYZ Corporation's quick ratio for the fiscal year 2022 was 1.8. This ratio is also above the industry average, indicating that the company can cover its current liabilities without liquidating inventory.Working CapitalWorking capital is the difference between a company's current assets and current liabilities. XYZ Corporation's working capital for the fiscal year 2022 was $50 million, which is a significant improvement over the previous year. This increase in working capital reflects the company's strong liquidity position and ability to fund its operations.Profitability AnalysisGross MarginGross margin is a measure of a company's profitability, calculated as the percentage of revenue remaining after deducting the cost of goods sold. XYZ Corporation's gross margin for the fiscal year 2022 was 35%, which is slightly lower than the industry average. This decrease in gross margin can be attributed to increased raw material costs and higher research and development expenses.Net MarginNet margin is a measure of a company's overall profitability, calculated as the percentage of revenue remaining after all expenses, including taxes, are deducted. XYZ Corporation's net margin for the fiscal year 2022 was 15%, which is in line with the industry average. The company's net margin has remained stable over the past few years, indicating a consistent level of profitability.Return on Assets (ROA)Return on assets is a measure of how efficiently a company uses its assets to generate earnings. XYZ Corporation's ROA for the fiscal year 2022 was 8%, which is slightly lower than the industry average. This indicates that the company could potentially improve its assetutilization to enhance profitability.Solvency AnalysisDebt-to-Equity RatioThe debt-to-equity ratio measures a company's financial leverage and its ability to meet long-term obligations. XYZ Corporation's debt-to-equityratio for the fiscal year 2022 was 1.2, which is slightly below the industry average. This ratio suggests that the company has a moderate level of financial leverage and is in a good position to meet its long-term obligations.Interest Coverage RatioThe interest coverage ratio measures a company's ability to cover its interest expenses with its operating income. XYZ Corporation's interest coverage ratio for the fiscal year 2022 was 4.5, which is well above the industry average. This indicates that the company has a strong ability to cover its interest expenses and is not at risk of defaulting on its debt.Investment ActivitiesCapital Expenditures (CapEx)Capital expenditures represent the investments made by a company in its long-term assets. XYZ Corporation's capital expenditures for the fiscal year 2022 were $100 million, which was a significant increase over the previous year. This increase in CapEx was primarily driven by investments in new manufacturing facilities and research and development projects.Dividends PaidDividends paid are the distributions made to shareholders from a company's earnings. XYZ Corporation paid $30 million in dividends to its shareholders during the fiscal year 2022. This amount represents a 10% increase over the previous year, reflecting the company's commitment to returning value to its shareholders.ConclusionXYZ Corporation's financial report for the fiscal year 2022 indicates a strong liquidity position, stable profitability, and moderate financial leverage. The company has made significant investments in its long-term assets, which should contribute to its future growth and profitability. However, the decrease in gross margin and the need to improve assetutilization suggest that there are areas requiring attention and potential improvement.Recommendations1. XYZ Corporation should continue to monitor its cost of goods sold and explore opportunities to reduce expenses.2. The company should focus on improving its asset utilization to enhance its return on assets.3. XYZ Corporation should maintain its strong liquidity position to ensure it can meet its short-term and long-term obligations.4. The company should continue to invest in research and development to maintain its competitive edge in the technology sector.By addressing these recommendations, XYZ Corporation can further strengthen its financial position and achieve sustainable growth in the future.第2篇Executive SummaryThis analysis delves into the financial performance of XYZ Corporation over the past fiscal year. By examining key financial statements, we aim to provide a comprehensive overview of the company's profitability, liquidity, solvency, and operational efficiency. This report will also highlight the major trends and challenges faced by the company, along with recommendations for improvement.IntroductionXYZ Corporation, a leading player in the [industry sector], has been operating in the market for [number of years]. The company has a diverse product portfolio and operates in [number of countries]. This analysis focuses on the financial statements for the fiscal year ended [financial year end date].1. Income Statement Analysis1.1 Revenue AnalysisThe total revenue for XYZ Corporation for the fiscal year ended [financial year end date] was [amount], an increase of [percentage] compared to the previous year. The revenue growth can be attributed to the expansion of the product line, successful marketing campaigns, and increased market share.1.2 Cost of Goods Sold (COGS) AnalysisThe COGS for XYZ Corporation increased by [percentage] to [amount] during the fiscal year. The increase in COGS can be attributed to the rising costs of raw materials, labor, and production expenses. However, the COGS as a percentage of revenue remained stable at [percentage], indicating that the company has managed to control its cost structure.1.3 Gross Profit AnalysisThe gross profit for XYZ Corporation increased by [percentage] to [amount] during the fiscal year. This can be attributed to the revenue growth and effective cost management. The gross profit margin remained at [percentage], which is in line with industry averages.1.4 Operating Expenses AnalysisOperating expenses for XYZ Corporation increased by [percentage] to [amount] during the fiscal year. The increase in operating expenses can be attributed to higher marketing and administrative costs. However, the operating expenses as a percentage of revenue remained stable at [percentage], indicating that the company has managed to control its cost structure.1.5 Net Profit AnalysisThe net profit for XYZ Corporation increased by [percentage] to [amount] during the fiscal year. The company's net profit margin remained at [percentage], which is in line with industry averages.2. Balance Sheet Analysis2.1 Asset AnalysisThe total assets of XYZ Corporation increased by [percentage] to [amount] during the fiscal year. The increase in assets can be attributed to the expansion of the company's operations and investments in new projects.2.2 Liability AnalysisThe total liabilities of XYZ Corporation increased by [percentage] to [amount] during the fiscal year. The increase in liabilities can be attributed to the expansion of the company's operations and increased borrowings.2.3 Equity AnalysisThe total equity of XYZ Corporation increased by [percentage] to [amount] during the fiscal year. The increase in equity can be attributed to the company's net profit and revaluation of assets.3. Cash Flow Statement Analysis3.1 Operating Cash Flow AnalysisThe operating cash flow for XYZ Corporation increased by [percentage] to [amount] during the fiscal year. This can be attributed to the increase in net profit and effective management of working capital.3.2 Investing Cash Flow AnalysisThe investing cash flow for XYZ Corporation decreased by [percentage] to [amount] during the fiscal year. The decrease in investing cash flow can be attributed to the reduced capital expenditure on new projects.3.3 Financing Cash Flow AnalysisThe financing cash flow for XYZ Corporation increased by [percentage] to [amount] during the fiscal year. The increase in financing cash flow can be attributed to the issuance of new shares and repayment of long-term debt.4. Key Ratios Analysis4.1 Profitability Ratios- Gross Profit Margin: [percentage]- Net Profit Margin: [percentage]- Return on Assets (ROA): [percentage]- Return on Equity (ROE): [percentage]4.2 Liquidity Ratios- Current Ratio: [number]- Quick Ratio: [number]4.3 Solvency Ratios- Debt-to-Equity Ratio: [number]- Interest Coverage Ratio: [number]5. Conclusion and RecommendationsXYZ Corporation has demonstrated strong financial performance over the past fiscal year, with revenue and net profit increasing significantly. However, the company faces several challenges, including rising costs, increased competition, and economic uncertainties.Recommendations:- Focus on cost optimization to improve profitability.- Invest in research and development to enhance product offerings.- Strengthen marketing strategies to maintain market share.- Diversify revenue streams to reduce dependency on a single product or market.- Monitor economic indicators and adjust strategies accordingly.By implementing these recommendations, XYZ Corporation can continue to grow and remain competitive in the market.Appendix- Financial Statements (Income Statement, Balance Sheet, Cash Flow Statement)- Key Ratios Calculation- Graphs and Charts illustrating financial trends[Note: This report is a sample and should be customized with actual data and company-specific details.]第3篇IntroductionThe financial report analysis is an essential tool for investors, creditors, and other stakeholders to evaluate the financial performance and stability of a company. This analysis involves examining the financial statements, including the balance sheet, income statement, and cash flow statement, to gain insights into the company's profitability, liquidity, solvency, and efficiency. This paper aims to provide a comprehensive analysis of a fictional company's financial report, focusing on key financial ratios and metrics to assess its overall financial health.1. Overview of the CompanyCompany XYZ is a publicly-traded multinational corporation specializing in the manufacturing and distribution of consumer goods. The company operates in various regions, with a diverse product portfolio that includes electronics, home appliances, and personal care products. Over the past few years, Company XYZ has experienced significant growth, expanding its market share and generating substantial revenue.2. Financial Statements Analysis2.1 Balance SheetThe balance sheet provides a snapshot of the company's financialposition at a specific point in time. The key components of the balance sheet include assets, liabilities, and shareholders' equity.a. AssetsCompany XYZ's assets are categorized into current assets and non-current assets. Current assets include cash, accounts receivable, inventory, and other liquid assets that can be converted into cash within one year.Non-current assets include property, plant, and equipment, intangible assets, and long-term investments.The analysis of Company XYZ's balance sheet reveals that the company has a strong current asset position, with a current ratio of 2.5. This indicates that the company has sufficient liquidity to meet its short-term obligations. Additionally, the company's inventory turnover ratioof 5.2 suggests efficient inventory management and a healthy level of inventory turnover.b. LiabilitiesLiabilities are classified as current liabilities and long-term liabilities. Current liabilities include accounts payable, short-term debt, and other obligations due within one year. Long-term liabilities encompass long-term debt and deferred tax liabilities.The company's current ratio of 2.5 also reflects a healthy level of current liabilities, which are primarily composed of accounts payableand short-term debt. This indicates that the company has a manageable level of short-term debt and is able to cover its obligations with its current assets.c. Shareholders' EquityShareholders' equity represents the residual interest in the assets of the company after deducting liabilities. It is composed of common stock, additional paid-in capital, retained earnings, and other comprehensive income.Company XYZ's shareholders' equity has grown significantly over the years, reflecting the company's profitability and reinvestment of earnings. The company has also issued additional shares to raise capital, which has contributed to the increase in shareholders' equity.2.2 Income StatementThe income statement provides information about the company's revenues, expenses, and net income over a specific period. The key components of the income statement include sales, cost of goods sold, operating expenses, and net income.a. SalesCompany XYZ has experienced consistent sales growth, with a compound annual growth rate (CAGR) of 7% over the past five years. This growth can be attributed to the company's expanding market share, new product launches, and effective marketing strategies.b. Cost of Goods Sold (COGS)The COGS represents the direct costs associated with the production of goods sold by the company. The analysis of Company XYZ's COGS reveals that it has been decreasing over the years, reflecting improved production efficiency and cost control measures.c. Operating ExpensesOperating expenses include selling, general, and administrative expenses (SG&A) and research and development (R&D) expenses. Company XYZ has successfully managed its operating expenses, with a trend of decreasing SG&A expenses and stable R&D expenses.d. Net IncomeThe net income is the final result of the income statement and represents the company's profit after all expenses have been deducted from revenues. Company XYZ has demonstrated strong profitability, with a net income margin of 10% over the past five years.2.3 Cash Flow StatementThe cash flow statement provides information about the company's cash inflows and outflows from operating, investing, and financing activities.a. Operating Cash FlowCompany XYZ has generated positive operating cash flow over the years, which is essential for maintaining liquidity and funding growth initiatives. The company's operating cash flow margin has remained stable, indicating consistent profitability.b. Investing Cash FlowThe investing cash flow represents the company's cash flows from the purchase and sale of long-term assets, such as property, plant, and equipment, and investments. Company XYZ has invested in new manufacturing facilities and acquired other companies to expand its market presence.c. Financing Cash FlowThe financing cash flow includes cash flows from the issuance and repayment of debt, as well as equity financing. Company XYZ has raised capital through the issuance of new shares and long-term debt to fund its expansion plans.3. Financial Ratios and Metrics3.1 Profitability Ratiosa. Return on Assets (ROA)ROA measures the company's ability to generate profit from its assets. Company XYZ has a ROA of 5%, indicating that it is generating a reasonable return on its assets.b. Return on Equity (ROE)ROE measures the company's profitability from the perspective of its shareholders. Company XYZ has a ROE of 15%, reflecting its strong profitability and efficient use of shareholders' equity.3.2 Liquidity Ratiosa. Current RatioThe current ratio of 2.5 indicates that Company XYZ has a strong liquidity position, with sufficient current assets to cover its current liabilities.b. Quick RatioThe quick ratio, also known as the acid-test ratio, measures the company's ability to meet its short-term obligations without relying on inventory. Company XYZ has a quick ratio of 2.0, suggesting a robust liquidity position.3.3 Solvency Ratiosa. Debt-to-Equity RatioThe debt-to-equity ratio of 0.8 indicates that Company XYZ has a moderate level of leverage, with debt financing accounting for a significant portion of its capital structure.b. Interest Coverage RatioThe interest coverage ratio of 5.0 indicates that Company XYZ has sufficient earnings to cover its interest expenses, reflecting a strong financial position.3.4 Efficiency Ratiosa. Inventory Turnover RatioThe inventory turnover ratio of 5.2 suggests that Company XYZ is efficiently managing its inventory, with a high level of inventory turnover.b. Receivables Turnover RatioThe receivables turnover ratio of 10.0 indicates that Company XYZ is collecting its accounts receivable quickly, reducing the risk of bad debt.ConclusionBased on the analysis of Company XYZ's financial report, it is evident that the company has demonstrated strong financial performance and stability. The company's profitability, liquidity, solvency, and efficiency ratios indicate a healthy financial position, supported by consistent revenue growth, effective cost management, and efficient use of assets and liabilities. As such, Company XYZ appears to be a solid investment opportunity for potential investors and creditors.。
财务分析报告总结英文版

Fixed assets Construction in process
Intangible assets Deferred expenses-long
0.47%
1.15% 20.07% 100.00%
2010
62.16% 6.22% 8.17% 1.84% 0.22% 10.92% 0.07%பைடு நூலகம்89.60%
1.00% 0.06% 5.63% 0.98% 1.61%
0.21%
0.92% 10.40% 100.00%
2011
52.11% 13.11% 8.30% 0.80% 0.12% 10.29% 0.05% 84.79%
2010年 0.00% 19.63% 0.79% 3.98% 0.38% 2.92% 0.55% 28.25%
0.00% 0.50% 0.07% 0.58% 28.83%
16.24% 39.79% 2.56% 10.61% 69.20% 1.97% 71.17% 100.00%
2011年 0.01% 15.64% 0.84% 4.10% 0.74% 2.58% 0.29% 24.69%
Other payables Current liabilities-others
Total current liability Non-current liability:
Bonds payable Anticipation liabilities Non-current liability-others Total non-current liability
英文分析财务报告(3篇)

第1篇IntroductionThe financial report of XYZ Corporation serves as a comprehensive document that provides insights into the company's financial performance, position, and cash flows over a specific period. This analysis aims to delve into the key aspects of XYZ Corporation's financial report, highlighting strengths, weaknesses, and areas of concern. By examining the financial statements, ratios, and additional disclosures, we cangain a deeper understanding of the company's financial health and future prospects.Financial Statements1. Income StatementThe income statement of XYZ Corporation presents the company's revenues, expenses, and net income over a specific period. A detailed analysis of the income statement reveals the following:- Revenue Trends: XYZ Corporation has shown a consistent growth in revenue over the past few years, with a compound annual growth rate (CAGR) of 8%. This can be attributed to the company's expansion into new markets and the introduction of innovative products.- Expense Analysis: While the revenue has grown, the company's operating expenses have also increased. However, the cost of goods sold (COGS) as a percentage of revenue has remained relatively stable, indicating efficient production processes. The increase in operating expenses can be attributed to higher marketing and research and development (R&D) costs.- Net Income: XYZ Corporation has reported a net income of $50million for the fiscal year, representing a 10% increase from the previous year. This growth in net income can be attributed to the increase in revenue and effective cost management.2. Balance SheetThe balance sheet of XYZ Corporation provides a snapshot of thecompany's assets, liabilities, and shareholders' equity at a specific point in time. The following observations can be made:- Assets: XYZ Corporation has total assets of $500 million, with a breakdown of $300 million in current assets and $200 million in non-current assets. The current assets are primarily composed of cash, accounts receivable, and inventory, indicating a strong liquidity position.- Liabilities: The company has total liabilities of $200 million,with a breakdown of $100 million in current liabilities and $100 million in long-term liabilities. The current ratio (current assets/current liabilities) stands at 3:1, indicating a healthy short-term financial position.- Shareholders' Equity: XYZ Corporation has shareholders' equity of $300 million, with a book value per share of $10. The company has a strong equity position, indicating financial stability and the abilityto support future growth initiatives.3. Cash Flow StatementThe cash flow statement of XYZ Corporation presents the company's cash inflows and outflows from operating, investing, and financing activities. The following insights can be derived:- Operating Cash Flows: XYZ Corporation has generated positive operating cash flows of $30 million for the fiscal year. This indicates that the company's core operations are generating sufficient cash to support its growth initiatives.- Investing Cash Flows: The company has invested $20 million in fixed assets and $10 million in intangible assets during the fiscal year. This investment in capital expenditures is essential for the long-term growth and sustainability of the company.- Financing Cash Flows: XYZ Corporation has raised $50 millionthrough the issuance of new shares, which has been used to repay long-term debt and fund working capital requirements.Financial Ratios1. Profitability Ratios- Return on Assets (ROA): XYZ Corporation's ROA stands at 10%, indicating that the company is generating a profit of $1 for every $10of assets. This is a strong indicator of the company's efficiency in utilizing its assets.- Return on Equity (ROE): The company's ROE is 20%, indicating that the company is generating a profit of $2 for every $10 of shareholders' equity. This is a commendable return and reflects the company'seffective use of capital.2. Liquidity Ratios- Current Ratio: As mentioned earlier, the current ratio stands at3:1, indicating a healthy liquidity position. This means that the company has sufficient current assets to cover its current liabilities.- Quick Ratio: The quick ratio, also known as the acid-test ratio, stands at 2:1, indicating that the company can cover its currentliabilities with its most liquid assets.3. Solvency Ratios- Debt-to-Equity Ratio: XYZ Corporation's debt-to-equity ratio is0.67, indicating that the company has a moderate level of leverage. This suggests that the company is not overly dependent on debt financing.- Interest Coverage Ratio: The company's interest coverage ratio is 4, indicating that it has sufficient earnings to cover its interest expenses.Additional Disclosures1. Risk Factors: XYZ Corporation has disclosed several risk factors in its financial report, including competition in the industry, changes in consumer preferences, and fluctuations in raw material prices. The company has outlined its strategies to mitigate these risks, which include diversifying its product portfolio and maintaining strong relationships with suppliers.2. Management's Discussion and Analysis (MD&A): The MD&A section of the financial report provides insights into the company's financial performance, business strategies, and future outlook. It highlights the company's achievements and challenges, as well as its plans to address these issues.ConclusionIn conclusion, the financial report of XYZ Corporation presents a positive picture of the company's financial health and future prospects. The company has demonstrated strong revenue growth, effective cost management, and a robust liquidity position. The financial ratios indicate that the company is well-managed and capable of generating sustainable profits. However, it is essential for investors and stakeholders to remain vigilant about the disclosed risk factors and stay informed about the company's strategies to mitigate these risks. By continuously monitoring the company's financial performance and adhering to best practices, XYZ Corporation can maintain its competitive edge and achieve long-term success.第2篇IntroductionFinancial reports are essential documents that provide a comprehensive overview of a company's financial performance. These reports are crucial for stakeholders such as investors, creditors, and management to make informed decisions. This analysis aims to provide an in-depth examination of a company's financial report, covering various aspects such as income statement, balance sheet, cash flow statement, and notes to the financial statements.Income StatementThe income statement, also known as the profit and loss statement, is a critical component of a financial report. It presents the company's revenues, expenses, and net income or loss over a specific period. The following analysis will focus on key aspects of the income statement.RevenueRevenue is the total income generated from the sale of goods or services. An analysis of revenue growth can provide insights into the company's market performance. For instance, if the revenue has been consistently increasing over the years, it indicates that the company is expandingits customer base and capturing a larger market share. Conversely, a declining revenue trend may suggest market saturation or increased competition.Cost of Goods Sold (COGS)COGS represents the direct costs associated with the production of goods or services. It includes raw materials, labor, and manufacturing expenses. Analyzing COGS as a percentage of revenue can help assess the company's cost efficiency. A decreasing COGS percentage indicates that the company is becoming more efficient in its production processes.Gross ProfitGross profit is the revenue minus COGS. It measures the profitability of the company's core operations. A higher gross profit margin suggeststhat the company is generating more profit from its sales. It isessential to compare the gross profit margin with industry benchmarks to determine if the company is performing well in its sector.Operating ExpensesOperating expenses include selling, general, and administrative expenses. These expenses are crucial for the day-to-day operations of the company. Analyzing operating expenses as a percentage of revenue can helpidentify areas where the company can reduce costs. For instance, if theoperating expenses have been increasing while revenue remains constant, it may indicate inefficiencies in the company's operations.Net IncomeNet income is the final result after subtracting operating expenses and taxes from revenue. It represents the company's profitability. A consistent increase in net income over time is a positive sign, indicating that the company is generating sustainable profits.Balance SheetThe balance sheet provides a snapshot of a company's financial position at a specific point in time. It consists of assets, liabilities, and shareholders' equity. The following analysis will focus on key aspects of the balance sheet.AssetsAssets are resources owned by the company that have economic value. They can be classified into current assets and non-current assets. Current assets include cash, accounts receivable, and inventory. Non-current assets include property, plant, and equipment. Analyzing the composition and trends of assets can help assess the company's liquidity and long-term investment strategies.LiabilitiesLiabilities are obligations of the company to pay debts or fulfill other financial obligations. They can be classified into current liabilities and long-term liabilities. Current liabilities include accounts payable and short-term debt. Long-term liabilities include long-term debt and deferred tax liabilities. Analyzing the company's liabilities can help determine its financial stability and ability to meet its obligations.Shareholders' EquityShareholders' equity represents the ownership interest of the company's shareholders. It is calculated as assets minus liabilities. A positivetrend in shareholders' equity indicates that the company is generating profits and reinvesting in its growth.Cash Flow StatementThe cash flow statement provides information about the cash inflows and outflows of a company during a specific period. It is divided into three sections: operating activities, investing activities, and financing activities.Operating ActivitiesOperating activities represent the cash generated from the company's core operations. A positive cash flow from operating activitiesindicates that the company is generating sufficient cash to support its operations.Investing ActivitiesInvesting activities include cash flows related to the acquisition and disposal of long-term assets. A negative cash flow from investing activities may indicate that the company is investing in new projects or acquiring other businesses.Financing ActivitiesFinancing activities include cash flows related to the issuance and repayment of debt, as well as equity transactions. A positive cash flow from financing activities suggests that the company is raising capital to support its growth.Notes to the Financial StatementsThe notes to the financial statements provide additional information and explanations about the financial report. They are crucial for understanding the assumptions, estimates, and accounting policies used in preparing the financial statements.ConclusionIn conclusion, analyzing a company's financial report involves a thorough examination of its income statement, balance sheet, cash flow statement, and notes to the financial statements. By assessing key financial metrics and trends, stakeholders can gain valuable insights into the company's financial performance, stability, and growth prospects. It is essential to compare the company's performance with industry benchmarks and historical data to make informed decisions.第3篇Introduction:Financial reporting is a crucial aspect of any business, providing stakeholders with insights into the company's financial performance and position. This analysis aims to delve into the financial report of a hypothetical company, evaluating its profitability, liquidity, solvency, and efficiency. By examining key financial ratios and trends, this paper will provide a comprehensive overview of the company's financial health.1. Introduction to the Companya. Company Overviewb. Industry Analysisc. Financial Report Context2. Revenue and Profitability Analysisa. Revenue Trends1. Sales Revenue2. Service Revenue3. Product Revenueb. Profitability Ratios1. Gross Profit Margin2. Operating Profit Margin3. Net Profit Marginc. Profitability Analysis1. Factors Contributing to Profitability2. Factors Affecting Profitability3. Liquidity Analysisa. Current Ratiob. Quick Ratioc. Operating Cash Flowd. Liquidity Analysis1. Factors Affecting Liquidity2. Importance of Liquidity4. Solvency Analysisa. Debt-to-Equity Ratiob. Interest Coverage Ratioc. Solvency Analysis1. Factors Affecting Solvency2. Importance of Solvency5. Efficiency Analysisa. Inventory Turnover Ratiob. Accounts Receivable Turnover Ratioc. Accounts Payable Turnover Ratiod. Efficiency Analysis1. Factors Affecting Efficiency2. Importance of Efficiency6. Financial Ratios and Comparisonsa. Comparison with Industry Averagesb. Comparison with Peersc. Strengths and Weaknesses7. Conclusiona. Summary of Key Findingsb. Recommendations for Improvementc. Future Outlook1. Introduction to the Companya. Company Overview:The hypothetical company, XYZ Corp., is a multinational corporation operating in the technology sector. It specializes in the development and manufacturing of cutting-edge electronic devices and software solutions. The company has been in operation for the past 20 years and has a strong presence in various global markets.b. Industry Analysis:The technology industry is characterized by rapid innovation, high competition, and continuous technological advancements. It is a highly dynamic sector, with companies constantly striving to stay ahead of the curve. The industry is also known for its high growth potential and volatility.c. Financial Report Context:The financial report analyzed in this paper covers a period of three years, from 2019 to 2021. The report includes the company's income statement, balance sheet, and cash flow statement. The data used in this analysis are derived from the annual reports of XYZ Corp.2. Revenue and Profitability Analysisa. Revenue Trends:i. Sales Revenue: XYZ Corp.'s sales revenue has shown a steady increase over the past three years, growing from $5 billion in 2019 to $6.2billion in 2021.ii. Service Revenue: The company's service revenue has also seen a consistent growth rate, increasing from $1.5 billion in 2019 to $1.9 billion in 2021.iii. Product Revenue: The product revenue has experienced a moderate growth, rising from $3.5 billion in 2019 to $4.3 billion in 2021.b. Profitability Ratios:i. Gross Profit Margin: The gross profit margin has fluctuated slightly over the three-year period, ranging from 38% in 2019 to 40% in 2021.ii. Operating Profit Margin: The operating profit margin has remained relatively stable, with an average of 25% over the three years.iii. Net Profit Margin: The net profit margin has seen a slight decline, decreasing from 15% in 2019 to 13% in 2021.c. Profitability Analysis:i. Factors Contributing to Profitability: XYZ Corp.'s profitability can be attributed to its strong brand presence, innovative products, and efficient cost management.ii. Factors Affecting Profitability: The increasing competition and rising raw material costs have posed challenges to the company's profitability.3. Liquidity Analysisa. Current Ratio: The current ratio of XYZ Corp. has remained above 1.5 throughout the three-year period, indicating a healthy liquidity position.b. Quick Ratio: The quick ratio has also been favorable, averaging 1.2 over the three years.c. Operating Cash Flow: The company's operating cash flow has been positive, with an average of $500 million per year.d. Liquidity Analysis:i. Factors Affecting Liquidity: XYZ Corp. has managed its liquidity effectively by maintaining a strong current ratio and a positive operating cash flow.ii. Importance of Liquidity: Adequate liquidity ensures that the company can meet its short-term obligations and maintain smooth operations.4. Solvency Analysisa. Debt-to-Equity Ratio: The debt-to-equity ratio of XYZ Corp. has remained relatively stable, averaging 1.2 over the three-year period.b. Interest Coverage Ratio: The interest coverage ratio has been favorable, with an average of 5 over the three years.c. Solvency Analysis:i. Factors Affecting Solvency: XYZ Corp. has maintained a moderate level of debt and a strong interest coverage ratio, ensuring a healthy solvency position.ii. Importance of Solvency: Adequate solvency is crucial for the company's long-term sustainability and access to financing.5. Efficiency Analysisa. Inventory Turnover Ratio: The inventory turnover ratio has fluctuated slightly over the three-year period, ranging from 8 to 10 times.b. Accounts Receivable Turnover Ratio: The accounts receivable turnover ratio has remained stable, averaging 15 times over the three years.c. Accounts Payable Turnover Ratio: The accounts payable turnover ratio has also been stable, averaging 20 times over the three years.d. Efficiency Analysis:i. Factors Affecting Efficiency: XYZ Corp. has managed its inventory and accounts receivable efficiently, resulting in a stable turnover ratio.ii. Importance of Efficiency: Efficient management of assets andliabilities ensures optimal utilization of resources and reduces costs.6. Financial Ratios and Comparisonsa. Comparison with Industry Averages:i. XYZ Corp.'s gross profit margin, operating profit margin, and net profit margin are in line with the industry averages.ii. The company's current ratio and quick ratio are slightly higher than the industry averages, indicating a stronger liquidity position.iii. The debt-to-equity ratio and interest coverage ratio of XYZ Corp. are also in line with the industry averages.b. Comparison with Peers:i. XYZ Corp.'s profitability ratios are comparable to its peers in the technology sector.ii. The company's liquidity and solvency ratios are slightly better than its peers, indicating a stronger financial position.iii. XYZ Corp.'s efficiency ratios are also comparable to its peers.c. Strengths and Weaknesses:i. Strengths: XYZ Corp. has a strong brand presence, innovative products, and efficient cost management.ii. Weaknesses: The company faces increasing competition and rising raw material costs, which could impact its profitability.7. Conclusiona. Summary of Key Findings:i. XYZ Corp. has demonstrated consistent revenue growth andprofitability over the past three years.ii. The company has a healthy liquidity, solvency, and efficiency position.iii. XYZ Corp.'s financial ratios are comparable to industry averages and its peers.b. Recommendations for Improvement:i. The company should focus on cost management to mitigate the impact of rising raw material costs.ii. XYZ Corp. should continue investing in research and development to maintain its competitive edge.iii. The company should explore new markets and diversify its product offerings to reduce dependency on existing markets.c. Future Outlook:i. The technology industry is expected to experience moderate growth over the next few years.ii. XYZ Corp. is well-positioned to capitalize on this growth and maintain its competitive advantage.iii. By implementing the recommended improvements, the company can further strengthen its financial position and achieve sustainable growth.This comprehensive analysis of XYZ Corp.'s financial report provides valuable insights into the company's financial performance and position. By evaluating key financial ratios and trends, stakeholders can make informed decisions regarding their investment in the company.。
- 1、下载文档前请自行甄别文档内容的完整性,平台不提供额外的编辑、内容补充、找答案等附加服务。
- 2、"仅部分预览"的文档,不可在线预览部分如存在完整性等问题,可反馈申请退款(可完整预览的文档不适用该条件!)。
- 3、如文档侵犯您的权益,请联系客服反馈,我们会尽快为您处理(人工客服工作时间:9:00-18:30)。
A person with $95,000 who faces a 10% interest rate has the following opportunity set.
One choice available is to consume $40,000 now; invest the remaining $55,000; consume
❖In the example above, the bank took a large loan from the dentist and made small loans to the students.
Term intermediation
❖Commercial banks finance long-term mortgages with short-term deposits.
❖
The intermediary 4 college seniors.
in
tu$r3n0,l0o0a0n×s($1+3r0) ,000
to
each
of
the
$120,000
Dentist
Bank
$30,000 $30,000×(1+r)
$30,000
Student #1 Student #2
$30,000 Student #3
金融市场与净现值分析报告(英文版)
3.1 The Financial Market Economy
❖ Individuals and institutions have different income streams and different intertemporal consumption preferences.
❖ He could loan $30,000 to each of 4 college seniors. They each promise to pay him back with interest after they graduate in one year.
$30,000×(1+r)
$30,000×(1+r)
Risk intermediation
❖Financial intermediaries can tailor the risk characteristics of securities for borrowers and
Market Clearing
❖ The job of balancing the supply of and demand for loanable funds is taken by the money market.
3.2 Making Consumption Choices over Time
❖ An individual can alter his consumption across time periods through borrowing and lending.
❖ We can illustrate this by graphing consumption today versus consumption in the future.
❖ Because of this, a market has arisen for money. The price of money is the interest rate.
The Financial Market Economy:
Example
❖ Consider a dentist who earns $200,000 per year and chooses to consume $80,000 per year. He has $120,000 in surplus money to invest.
$60,000 next year.
$6,0 00 $ 0 5,0 50 (1 0 .1)1 0
$40,000
$20,000
$0 $0
$20,000
$40,000
$60,000
$80,000
$100,000
$120,000
Consumption today
Intertemporal Consumption Opportunity Set
$120,000×(1+r)
$30,000×(1+r) $30,000
$30,000×(1+r)
Student #4
The Financial Market Economy: ❖ Financial inteErmxeadmiatpiolnecan take three
forms:
Size intermediation
❖ This graph will show intertemporal consumption opportunities.
Intertemporal Consumption Opportunity Set
Consumption at t+1
$120,000 $100,000 $80,000 $60,000
$30,000
Student #1
$,000×(1+r)
$30,000
Student #3
$30,000×(1+r)
$30,000
Student #4
The Financial Market Economy:
Example
❖ Rather than performing the credit analysis 4 times, he could loan the whole $120,000 to a financial intermediary in return for a promise to repay the $120,000 in one year with interest.
❖ When the quantity supplied equals the quantity demanded, the market is in equilibrium at the equilibrium price.
❖ The price of money is the interest rate.