2014年美赛数学建模A题翻译版论文
14建模A题论文
承诺书我们仔细阅读了《全国大学生数学建模竞赛章程》和《全国大学生数学建模竞赛参赛规则》(以下简称为“竞赛章程和参赛规则”,可从全国大学生数学建模竞赛网站下载)。
我们完全明白,在竞赛开始后参赛队员不能以任何方式(包括电话、电子邮件、网上咨询等)与队外的任何人(包括指导教师)研究、讨论与赛题有关的问题。
我们知道,抄袭别人的成果是违反竞赛章程和参赛规则的,如果引用别人的成果或其他公开的资料(包括网上查到的资料),必须按照规定的参考文献的表述方式在正文引用处和参考文献中明确列出。
我们郑重承诺,严格遵守竞赛章程和参赛规则,以保证竞赛的公正、公平性。
如有违反竞赛章程和参赛规则的行为,我们将受到严肃处理。
我们授权全国大学生数学建模竞赛组委会,可将我们的论文以任何形式进行公开展示(包括进行网上公示,在书籍、期刊和其他媒体进行正式或非正式发表等)。
我们参赛选择的题号是(从A/B/C/D中选择一项填写): A我们的报名参赛队号为(8位数字组成的编号):16048028所属学校(请填写完整的全名):(论文纸质版与电子版中的以上信息必须一致,只是电子版中无需签名。
以上内容请仔细核对,提交后将不再允许做任何修改。
如填写错误,论文可能被取消评奖资格。
)日期: 2014 年 9 月 15 日赛区评阅编号(由赛区组委会评阅前进行编号):编号专用页赛区评阅编号(由赛区组委会评阅前进行编号):全国统一编号(由赛区组委会送交全国前编号):全国评阅编号(由全国组委会评阅前进行编号):关于解决嫦娥三号软着陆轨道设计与控制策略的问题摘要本文主要解决的问题为嫦娥三号软着陆轨道设计与控制策略的优化问题,以及对基于模型的问题设计方案的误差分析和敏感性分析。
针对问题一,确定着陆准备轨道近月点和远月点的位置,以及嫦娥三号相应速度的大小与方向。
通过分析月球卫星运动的主要摄动源—月球非球形引力摄动因素,从而确立月球卫星运动的力模型。
月面经纬坐标(纬度ϕ,经度λ)可以用月心直角坐标,,X Y Z 表示,借助卫星的运动方程可以求出卫星在近日点位置为W N km,通过建立的卫星运动力模型和万有引力公式确定近日(19.0472,29.0243,14.865)点和远日点的速度为1.6925/m s,俯仰姿态角为84.2o。
2014年美国大学生数学建模竞赛MCM A题二等奖
For office use only F1 ________________ F2 ________________ F3 ________________ F4 ________________
A
Simulations of a Multi-Lane Traffic Model Using Cellular Automata Concerning the Overtaking Effect
Summary
The prosperity of modern industrialized world is largely depend on today’s sophisticated road networks. The rapid growth of vehicle number often exceeds the capacity of existing road [1,2]. Thus the effective utilization of road capacity is indispensable in traffic flow control. Cellular automaton model (CA model) is an very practical model in stimulating traffic flow behavior. This paper aims at building a CA model for multi-lane traffic using right-most overtaking law. The first CA model is the well-known NaSch model[9] Knospe studied a two-lane model focus on the density dependence of lane changes[10,11]. A numerical approach is performed by Daoudia and Moussa to stimulate the 3-lane traffic flow[12]. Basing upon the previous done by [1,9,10,12], we put forward an extended CA model using right-most overtaking rule. By a detailed investigation on overtaking process, we obtain the least safe distance under different speed limits and traffic flow densities, due to the limitation of least safe distance, we put forward incentive and safety criteria of overtaking behavior for particles on different lanes in our CA model. Simulation of our model is performed for three-lane case, and the result shows that our right-most overtaking rule behaves asymmetrically such that the right-most lane firstly reach at the “critical density” where the traffic flow reaches its peak point. And despite the special behavior of our own model, our results indicate a robust behavior of traffic flow such that when traffic density is roughly 0.1, the traffic flow arrives at its peak value, and with an increase of particle density, the phase transition occurs such that the traffic jams and “stop-and-go” phenomena happens. This result is of significance in conducting the daily traffic flow in our real world. Keywords: traffic flow, cellular automaton, right-most overtaking, simulation
2014美赛A题翻译
不太明显影响的因素。是否这个规则能够有效提高交通流量?如果不能的话,建议和分析一些替代选择
(尽可能地包括一些完全不是这种类型的因素)以提高车流量,安全或者其他你认为重要的因素。
在一些国家驾车在右边行驶是规范,讨论你的方案是否稍作修改即可被转入,或者有一些额外的要
求需要。
最后,如上述的规则要基于人类判断的依赖性。如果同一道路上的车辆交通完全被智能系统控制,那
--部分道路网络被控制或该道路上的部分车辆被控制--到什么程度会影响你早前分析的结果?
在美国驾驶汽车行驶在右边是一种规则(是指在美国,中国,和一些其他国家除了英国,澳大利亚
和一些前英国殖民地,多车道高速公路经常使用的规则是要求驾驶者驾驶在最右边的车道除非他们
正在超车,在这种情况下他们离开右边一个车道,超车,然后回到正常的驾驶车道。建立并且分析
一个数学模型关于这个规则在轻型交通和重型交通(大流量交通和小流量交通)中的性能。你也许
2014美赛ICM翻译
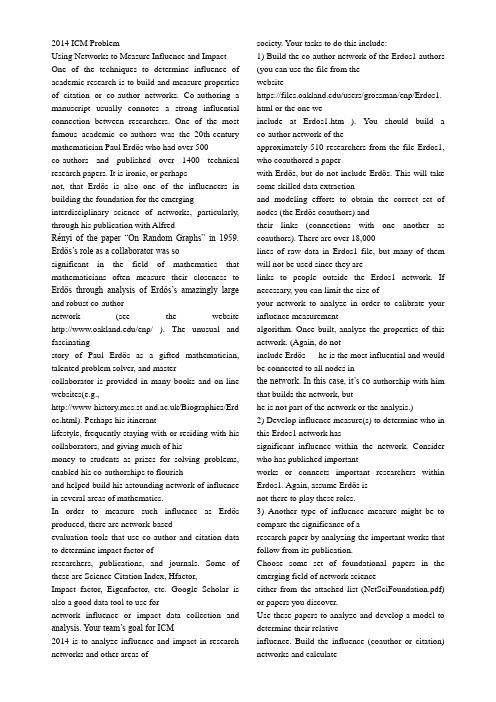
2014 ICM ProblemUsing Networks to Measure Influence and Impact One of the techniques to determine influence of academic research is to build and measure properties of citation or co-author networks. Co-authoring a manuscript usually connotes a strong influential connection between researchers. One of the most famous academic co-authors was the 20th-century mathematician Paul Erdös who had over 500co-authors and published over 1400 technical research papers. It is ironic, or perhapsnot, that Erdös is also one of the influencers in building the foundation for the emerging interdisciplinary science of networks, particularly, through his publication with AlfredRényi of the paper “On Random Graphs” in 1959. Erdös’s role as a collaborator was sosignificant in the field of mathematics that mathematicians often measure their closeness to Erdös through analysis of Erdös’s amazingly large and robust co-authornetwork (see the website /enp/ ). The unusual and fascinatingstory of Paul Erdös as a gifted mathematician, talented problem solver, and mastercollaborator is provided in many books and on-line websites(e.g.,/Biographies/Erd os.html). Perhaps his itinerantlifestyle, frequently staying with or residing with his collaborators, and giving much of hismoney to students as prizes for solving problems, enabled his co-authorships to flourishand helped build his astounding network of influence in several areas of mathematics.In order to measure such influence as Erdös produced, there are network-basedevaluation tools that use co-author and citation data to determine impact factor ofresearchers, publications, and journals. Some of these are Science Citation Index, Hfactor,Impact factor, Eigenfactor, etc. Google Scholar is also a good data tool to use fornetwork influence or impact data collection and analysis. Your team’s goal for ICM2014 is to analyze influence and impact in research networks and other areas of society. Your tasks to do this include:1) Build the co-author network of the Erdos1 authors (you can use the file from thewebsitehttps:///users/grossman/enp/Erdos1. html or the one weinclude at Erdos1.htm ). You should build a co-author network of theapproximately 510 researchers from the file Erdos1, who coauthored a paperwith Erdös, but do not include Erdös. This will take some skilled data extractionand modeling efforts to obtain the correct set of nodes (the Erdös coauthors) andtheir links (connections with one another as coauthors). There are over 18,000lines of raw data in Erdos1 file, but many of them will not be used since they arelinks to people outside the Erdos1 network. If necessary, you can limit the size ofyour network to analyze in order to calibrate your influence measurementalgorithm. Once built, analyze the properties of this network. (Again, do notinclude Erdös --- he is the most influential and would be connected to all nodes inthe network. In this case, it’s co-authorship with him that builds the network, buthe is not part of the network or the analysis.)2) Develop influence measure(s) to determine who in this Erdos1 network hassignificant influence within the network. Consider who has published importantworks or connects important researchers within Erdos1. Again, assume Erdös isnot there to play these roles.3) Another type of influence measure might be to compare the significance of aresearch paper by analyzing the important works that follow from its publication.Choose some set of foundational papers in the emerging field of network scienceeither from the attached list (NetSciFoundation.pdf) or papers you discover.Use these papers to analyze and develop a model to determine their relativeinfluence. Build the influence (coauthor or citation) networks and calculateappropriate measures for your analysis. Which of the papers in your set do youconsider is the most influential in network science and why? Is there a similarway to determine the role or influence measure of an individual networkresearcher? Consider how you would measure the role, influence, or impact of aspecific university, department, or a journal in network science? Discussmethodology to develop such measures and the data that would need to becollected.4) Implement your algorithm on a completely different set of network influence data--- for instance, influential songwriters, music bands, performers, movie actors,directors, movies, TV shows, columnists, journalists, newspapers, magazines,novelists, novels, bloggers, tweeters, or any data set you care to analyze. Youmay wish to restrict the network to a specific genre or geographic location orpredetermined size.5) Finally, discuss the science, understanding and utility of modeling influence andimpact within networks. Could individuals, organizations, nations, and society useinfluence methodology to improve relationships, conduct business, and makewise decisions? For instance, at the individual level, describe how you could useyour measures and algorithms to choose who to try to co-author with in order toboost your mathematical influence as rapidly as possible. Or how can you useyour models and results to help decide on a graduate school or thesis advisor toselect for your future academic work?6) Write a report explaining your modeling methodology, your network-basedinfluence and impact measures, and your progress and results for the previousfive tasks. The report must not exceed 20 pages (not including your summarysheet) and should present solid analysis of your network data; strengths,weaknesses, and sensitivity of your methodology; and the power of modelingthese phenomena using network science.*Your submission should consist of a 1 page Summary Sheet and your solution cannotexceed 20 pages for a maximum of 21 pages.This is a listing of possible papers that could be included in a foundational set ofinfluential publications in network science. Network science is a new, emerging, diverse, interdisciplinary field so there is no large, concentrated set of journals that are easy touse to find network papers even though several new journals were recently establishedand new academic programs in network science are beginning to be offered inuniversities throughout the world. You can use some of these papers or others of yourown choice for your team’s set to analyze and compare for influence or impact innetwork science for task #3.Erdös, P. and Rényi, A., On Random Graphs, Publicationes Mathematicae, 6: 290-297,1959.Albert, R. and Barabási, A-L. Statistical mechanics of complex networks. Reviews ofModern Physics, 74:47-97, 2002.Bonacich, P.F., Power and Centrality: A family of measures, Am J. Sociology. 92: 1170-1182, 1987.Barabási, A-L, and Albert, R. Emergence of scaling in random networks. Science, 286:509-512, 1999.Borgatti, S. Identifying sets of key players in a network. Computational andMathematical Organization Theory, 12: 21-34, 2006. Borgatti, S. and Everett, M. Models of core/periphery structures. Social Networks, 21:375-395, October 2000Graham, R. On properties of a well-known graph, or, What is your Ramseynumber? Annals of the New York Academy of Sciences, 328:166-172, June 1979.Kleinberg, J. Navigation in a small world. Nature, 406: 845, 2000.Newman, M. Scientific collaboration networks: II. Shortest paths, weightednetworks, and centrality. Physical Review E, 64:016132, 2001.Newman, M. The structure of scientific collaboration networks. Proc. Natl.Acad. Sci. USA, 98: 404-409, January 2001. Newman, M. The structure and function of complex networks. SIAM Review,45:167-256, 2003.Watts, D. and Dodds, P. Networks, influence, and public opinion formation. Journal ofConsumer Research, 34: 441-458, 2007.Watts, D., Dodds, P., and Newman, M. Identity and search in social networks. Science,296:1302-1305, May 2002.Watts, D. and Strogatz, S. Collective dynamics of `small-world' networks. Nature, 393:440-442, 1998.Snijders, T. Statistical models for social networks. Annual Review of Sociology, 37:131–153, 2011.Valente, T. Social network thresholds in the diffusion of innovations, Social Networks,18: 69-89, 1996.Erdos1, V ersion 2010, October 20, 2010This is a list of the 511 coauthors of Paul Erdos, together with their coauthors listed beneath them. The date of first joint paper with Erdos is given, followed by the number of joint publications (ifit is more than one). An asterisk following the name indicates that this Erdos coauthor is known to be deceased; additional information about the status of Erdos coauthors would be most welcomed. (This convention is not used for those with Erdos number 2, as to do so would involve too much work.) Numbers preceded by carets follow the convention used by Mathematical Reviews in MathSciNet to distinguish people with the same names.Please send corrections and comments to grossman@The Erdos Number Project Web site can be found at the following URL:/enpABBOTT, HARVEY LESLIE 1974Aull, Charles E.Brown, Ezra A.Dierker, Paul F.Exoo, GeoffreyGardner, BenHANSON, DENISHare, Donovan R. Katchalski, MeirLiu, Andy C. F.MEIR, AMRAMMOON, JOHN W.MOSER, LEO*Pareek, Chandra MohanRiddell, JamesSAUER, NORBERT W.SIMMONS, GUSTA VUS J.Smuga-Otto, M. J.SUBBARAO, MA TUKUMALLI VENKATA* Suryanarayana, D.Toft, BjarneWang, Edward Tzu HsiaWilliams, Emlyn R.Zhou, BingACZEL, JANOS D. 1965Abbas, Ali E.Aczel, S.Alsina Catala, ClaudiBaker, John A.Beckenbach, Edwin F.Beda, GyulaBelousov, Valentin DanilovichBenz, WalterBerg, LotharBoros, ZoltanChudziak, JacekDaroczy, ZoltanDhombres, Jean G.Djokovic, Dragomir Z.Egervary, Jeno2014 ICM问题使用网络来测量的影响和冲击其中一项技术来确定学术研究的影响力是建立和测量引文或合著者网络的性能。
2014美国数学建模竞赛赛题翻译

问题A:右行左超规则在美国、中国和大多数除了英国、澳大利亚和一些前英国殖民地的国家,多车道高速公路常常有这样一种规则。
司机必须尽量在最右的车道行使,只有超车时,司机才可以向左移动一个车道来达成目的。
当司机超车完毕后必须回到原车道继续行使。
建立并分析一个数学模型,使得这个模型能够分析这个规则在交通高负荷和低负荷情况下的表现。
你可以从许多角度来思考这个问题,比如车流量和车辆安全之间的权衡,或者一个过快或过慢的车辆限速带来的影响等等。
这个规则可以使我们获得更好的交通流?如果不可以,请提出并分析一个替代方案使得交通流得到优化、安全得到保障、或者其他你认为重要的因素得到实现。
在靠左行使才是规则的国家,论证你的解决方案是否可以通过简单的变换或者通过增加一些新的要求来解决相同的问题。
最后,以上的规则的实行是建立在人们遵守它的基础上的,然而不是所有人都愿意去遵守。
那么现在我们使同一条道(可以只是一段,也可以是全段公路)上的交通车辆都在一个智能系统的严格控制下,这个变化对你之前的分析结果有多大的影响?问题B:体育画刊是一个为体育爱好者们设计的杂志。
这个杂志正在寻找上世纪女性或者男性的“历来最优秀的大学教练”。
建立一个数学模型,从男性或者女性体育教练中选择最好的大学教练(退役或者在役的都可以)。
这些体育教练可以是大学曲棍球、陆上曲棍球、足球、橄榄球、棒球、排球、篮球的教练。
你选择划分的时间会对你的分析有影响吗?也就是说,1913年的教练方式和2013年的会有什么不同吗?清楚的阐述你的评估方式。
讨论你的模型如何通用于两性教练和所有可能的运动项目上。
用你的模型为三项体育项目分别找到五个最佳教练。
再为体育画刊提供一篇1-2页的不涉及技术性问题解释的通俗易懂的文章来解释你们的结果,你们必须保证体育爱好者们能够理解。
2014美赛A题论文

For office use onlyT1________________ T2________________ T3________________ T4________________Team Control Number27400Problem ChosenAFor office use onlyF1________________F2________________F3________________F4________________2014 Mathematical Contest in Modeling (MCM) Summary Sheet(Attach a copy of this page to your solution paper.)Type a summary of your results on this page. Do not includethe name of your school, advisor, or team members on this page.SummaryThe aim of this paper is to evaluate the performance of the changing lane rule named Keep-Right-Except-To-Pass and compare other rules we’ve constructed with the given one. The performance of changing lane rules mainly manifest in safety and traffic flow. Meanwhile, safety is influenced by posted speed limits and traffic density and traffic flow is influenced by average speed.First we construct Model 1 to describe the relationship between posted speed limits, traffic density and safety, noting that safety has negative correlation with collision times and can be fully expressed by it. Therefore we use Matlab to imitate the changing lane and collision process. Then we construct Model 2 to describe the relationship between traffic flow and average speed. Combining the result of Model 1and 2, we can conclude that the higher the posted speed limits and the lower the traffic density, the higher level safety an traffic flow could reach, and the Keep-To-Right-Except-To-Pass rule has the best performance.Then we construct Model 3 to compare some normal changing lane rules with the given one and with each other. Thus we imitate all the rules using algorithm given by model 1. We introduce a new concept named Standard Time to express traffic flow and still collision times to express safety. The result is that when a freeway road contains 2 lanes, the given rule shows the best performance. And when the number of lanes becomes 3, then the Choose-Speed rule, a very common traffic rule acts the best.As for the left-driving countries, we first choose the best rules and mirror symmetrically modify them. Then use the method of Model 2 to imitate performances of these rules. We have observed that these two best rules can be simply carried over.Finally, we have a short discussion about the intelligent system. Since speed can be fastest and changing lanes can be well planned, we regard this system as absolutely safe traffic which has the largest traffic flow.Team #27400 Page 1 of 161.Introduction1.1 Analysis to the problemThis problem can be divided into 4 requirements that we must meet, listed as follows:(1)Build a mathematical model to demonstrate the essence of Keep-Right-Except-To-Pass rule in light and heavy traffic;(2)Show the effects of other reasonable changing-lane rules or conditions by using themodified model built in the former requirement;(3)Determine whether the left-side-driving countries can use the same rule(s) withsimple mirror symmetric modification, or must add some requirements to guaranteethe safety or traffic flow;(4)Construct an intelligent traffic system which does not depend on humans’ compliance,and then compare the effects with earlier analysis.Therefore, this problem requires us to evaluate the performances of several changing-lane rules, especially the Keep-Right-Except-To-Pass rule while performances mainly manifest in traffic flow and safety. It is obvious that speed limit and the number of cars influent cars’ speed and then the performances of those rules.To solve requirement (2), we will use the same method as above. But all rules weconstructed should be discussed, imitated and compare with each other.To discuss the left-driving countries, we will conclude the best rules from requirement2 and apply to those countries. Then compare results with that of right-driving countries.If the results are totally the same, then those rules can be simply carried over with simple change. If not, additional requirement are needed.As for the intelligent system, we assume no collision will happen. So a simplediscussion is feasible.1.2 Crucial method for the problemTo imitate the process of changing lanes and collision, we will construct an algorithm named Changing-line and Collision. This will show the state of a number of car on the same stretch of freeway road, including going straight, changing lane to pass and traffic collision. The imitation process will be delivered on Matlab;2.Symbols and definitionSymbol Definition UnitσStandard Deviation of Speed miles/hmiles/hV85% Percentile of Normal85Distributionmiles/hV70% Percentile of Normal70DistributionDENS Traffic Density (Note: expressed by thenumber of cars) ST Standard Time \FLO Traffic Flow \CT Collision Times \3.General hypotheses for all models(1) All freeway roads contain either two or three lanes.(2) Overtaking Principle: the latter car must change lane and overtake the car right in front it if its speed is faster.(3) No violation of the rules.(4) The intelligent traffic system has no collision.(5) Road indicates one direction of the road.(6) Each cars remains constant speed no matter it goes straight or change lane.(7) Changing lane doesn’t cost time.(8) Given a traffic density, the average speed of cars is constant.(9) All discussions are confined to one stretch of road that is long enough to allow a series of cars to go across.4.Model establishment4.1 PreparationFirst, we must discuss what “changing-lane” is. For a two-lane road, if one car is going to change its lane to the left, then the right side lane “loses” one car and the left side lane “acquires” one, and vice versa. If the road contains three lanes, we can regard it as two “two-lane road”. This property also holds for an n-lane (n>2) road, which means we could regard it as (n-1) two-lane road. Therefore, changing-lane is the relation between two lanes. We just need to analyze a two-lane road to uncover the principle of changing lane and collision.Second, influence relationship figures are given below. In these figures, factors at lower level influence those at upper level. Safety will be expressed by collision times( ).Figure 1. General influence relationshipThird, we have constructed three additional changing-lane rules and shall describe these five rules in mathematical language. The original Keep-Right-Except-To-Pass rule is denoted Rule 1.Rule 1: Keep-Right-Except-To-Pass. If A B v v >, then car A goes left, overtakes car B and then gets back to the right lane.Figure 2. Rule one: Keep-Right-Except-To-PassRule 2: Free-Overtaking. If A B v v > and A C v v >, then car A changes lane to the left, passing B, and then to the right, passing C. And if there still exists a car D in front of A and A D v v >, car A will change to the left lane, pass D and then go straight. The following figure shows the case when the number of lanes is two, and it is identical for the case of 3 lanes.Figure 3. Rule 2: Free-OvertakingRule 3: Pass-Left. For a three-lane freeway road, if B A C v v v >>, then car A changes to the middle lane, and car B to the left lane, and finally they should get back to their original lane.Figure 4. Rule 3: Pass-LeftRule 4: Choose-Speed. Each lane of the road has a posted speed limit interval. We denote the left lane fast lane, right one slow lane and the middle one mid-lane. Drivers should choose lane according to their cars ’ speed.4.2 Model 1: Changing Lane and Collision Algorithm 4.2.1 Flow Diagram*To check Matlab code, please refer to Appendix 1. Note: we only use collision times to express safety.Figure 5. Flow Diagram of the Changing Lane and Collision Algorithm Comments:(1) The 1000*2 matrix stands for a stretch freeway road that contains two lanes;(2) Speed of cars is a series of random numbers which stands for the units they are to go forward each time;(3) Cars enter the road from the right lane.(4) If two cars collide, their speed will become zero but will not affect other cars. Accordingly, the position of collision will be valuated zero.To show how this algorithm works, we now give an example of a road, length 7 and five carswith different speed:Figure 6. An Example of the Algorithm4.2.2 Relationship between Average Speed, Standard Deviation of Speed and Posted Speed LimitsWe have mentioned in the last section that the speed of cars obeys normal distribution [3]. Now we deduce the relationship between ,μσ and PSL .Figure 7. Speed of cars obey normal distributionWe know from reference [4](page 15) that:857.6570.98V PSL =+⋅①The above foemula can be applied to all types of roads. Equation ② from reference [5](page 53):70-6.541+2.4V σ=⋅②Referring to the table of standard normal distribution, we have70V μσ-=0.52③ 85V μσ-=1.04④Considering formula ②③, we have=1.88-6.541μσ⑤Considering formula ①④, we have7.657+0.98=1.04PSL μσ-⑥Considering formula ⑤⑥, we have14.198+0.98=2.92PSLσ⑦0.98*=13.6012PSL μ-⑧Formula ⑦⑧ explains that the higher the posted speed limits, the greater the variance of speed and same to the average speed.0.9813.6012MU PSL =-⑨4.2.3 Process of ImitationWe now use control-variable method to describe the impact of traffic density and posted speed limits on safety. Therefore, we consider:(1) Traffic density being constant, the impact of variation of posted speed limits on safety; (2) Posted speed limits being constant, the impact of variation of traffic density on safety.When traffic density is constant:Table 1.Variation of Posted Speed LimitsPSL 50 60 70 80 90 100 μ 34.1481 40.4577 46.7673 53.0769 59.3865 65.6961 σ21.6432 24.9993 28.3555 31.7116 35.0678 38.424Figure 8. Variation of μ and σ along with Variation of PSLNote: SIGMA=σ, MU=μWhen posted speed limits is constant:Table 2.Variation of the number of carsThe number of cars 5 10 20 30 40 50Therefore we will acquire 6*6 groups of data when PSL is constant and 6*6 groups of data when traffic density is constant.4.3 Model 2: Relationship between Traffic Flow and Average SpeedIt is obvious that traffic flow is the function of average.We denote:=⋅+>FLO k MU c k(0)4.4 Model 3: Rules and Performances4.4.1 AnalysisIn section 4.1 we have listed four changing lane rules. Now we need to compare their effect and evaluate which rule has the best performance.According to the establishment of model 1, performances are fully expressed by safety and traffic flow, and safety has negative correlation with collision times. We can acquire the related data by imitation like model 1. However, since rules have changed, average speed of the road under different rules is different and is merely decided by PSL.Thus we introduce a new concept, namely, Standard Time(ST). Definition: time cost by each move of cars is called standard time. With this concept, we don’t need to calculate the real time cost by cars when going across a stretch of road, but count how many moves cars should make. Standard time has positive correlation with traffic flow, and we can denote:ST k FLO k=⋅>(0)4.4.2 Imitation ProcessConstruct a matrix. If the road contains two lanes, then the matrix size is 150*2; if it contains three lanes, then the size is 150*3. Arrange 40 random positions for each column vectors, and the numbers, as described before, obey normal distribution. Let other variables be constant, we discuss the impact of different rules on safety and traffic flow.Operations are as follows:(1) Distribute a series positions(40 for each column vector as described) for the matrix.(2) Valuate each position a number that obey normal distribution.(3) Apply one of the rules to the matrix. Those numbers will either “collide ” or “keep moving ” until all the position are valuated zero. (4) Record collision times and the spent standard time.(5) Apply another rule to the matrix, repeat steps (1) through (4).Statistically analyzing the data acquired and comparing the performances of different rules, we can decide advantages and disadvantages of each rule.4.4.3 Use the Method of 4.4.2 to Estimate Left-driving CountriesWe will conclude the best two rules and then apply the methods in section 4.4.2 to the left-driving country and estimate the performance of the two rules. Operation steps:(1) Mirror symmetrically modify the chosen rules; (2) Refer to the steps in section 4.4.2; (3) Compare with the results in 4.4.2.5. Model solution5.1 Model 1During the imitation process, we do the experiment for times for each case and then analyze all the results. We will show part of our statistical data. To view full data, please refer to Appendix 2.(1) Given DENS=30, the result is as follows:Table 3.Relationship between Changing Lane Times, Collision Times and PSL when DENS=30PSL Changing-lane times Average Collision TimesAverag-Line chart:Figure 9. Variation of Changing Lane Times and Collision Times along with Variation ofPSL(2) Given PSL=70, the result is as follows:Table 4.Relationship between Changing Lane Times, Collision Times and Number of Times whenPSL=70NumberChanging Lane Times Average Collision Time Average Line chart:Figure 10. Variation of Changing Lane Times and Collision Times along with Variation ofnumber of cars5.2 Model 2We know from formula ⑨, section 4.2.2 that0.9813.6012MU PSL =-Considering formula ⑨ and formula in 4.3, we have:0.9813.6012FLO k PSL k c =⋅-+5.3 Model 3The result of section 4.4.2 is given below:Table 5.Collision Times and Standard Time of each ruleRule →Rule 1 Rule 2(2Rule 3 Rule 2(3 Rule 4Extract the row of Average ST and Average CTTable 6.Average Collision Times and Average Standard Time of each rule The result of 4.4.3 is given below:Table 7.Collision Times and Standard Time of Rule 1 and Rule 4 Applied to Left-driving Countries6.Conclusion6.1 Conclusion of model 1 and 2We can conclude from model 1 that safety will decrease along with the growth oftraffic density. Safety will also decrease while the posted speed limits(PSL) is raised.However, comparing to PSL, traffic density has greater impact on safety while PSL can hardly influence safety.From model 2, we can conclude that traffic flow has liner growth along with the raise of PSL.The following table has summed up model 1 and 2.Table . 8Evaluation of Rule Performances in Different Road conditions6.2 Conclusion of model 3We can know from table 6 that when the number of lanes is 2, rule 1 is not very different from rule 2 in terms of traffic flow but is much safer than rule 2. When the number of lanes is 3, rule 3 is safest rule, but rule 4 will become both safe and efficient. Meanwhile, Free-Overtaking rule, actually meaning no rule, is most dangerous. Therefore, we have chosen rule 1 and rule 4 as the best rules.Result of section 4.4.3 is showed below. Note that original rules are listed on the left and modified on the right.Table .9Comparison between the Modified Rules and the OriginalFrom the table above, we can conclude that no difference between left-driving and right-driving countries. Therefore, those rules can be simply carried over with simple mirror symmetric modification.6.2 Conclusion of intelligent systemSince all the cars are controlled by a high-tech computer, we assume this system will never have an accident until the computer crashes. So every car reach their fastest speed, the order of overtaking can be calculated to avoid collision. Therefore, safety and traffic flow reach the highest level.7. References[1] Mark M. Meerschaert. Mathematical Modelling (Third Edition). Beijing: China Machine Press, 2008.12[2] Solomon. Accidents on Main Rural Highways Re la ted to Speed, Driver, and Vehicle[R]. Washing ton D. C: Federal Highway Administration, 1964[3] Lu Jian, Sun Xinglong, Daiyue. Regression analysis on speed distribution characteristics of ordinary road. Nanjing: Journal of Southeast University(Natural Science Edition), 2012.2 (in Chinese).[4] Wang Lijin. Research on Speed Limits and Operating Speed for Freeway. Beijing: Beijing University of Technology, 2011.5 (in Chinese).8. AppendixAppendix 1. Matlab Codeclear;clc;highway=zeros(1000,2);%define road%crash_times = 0;%define collition times%change_lane_times=0;%define change lane times%num_of_car=5; %definedefine number of car%MU=84.3898;SIGMA=20.4406;randspe=[];j=1;while j<=num_of_carx=round(normrnd(MU,SIGMA,1,1));if x>0randspe(j,1)=x; %define speed and gualentee %j=j+1;endx=0;endrandpla=[];for i=1:num_of_carx=ceil(rand(1)*1000);if find(randpla==x)x=ceil(rand(1)*1000); %define location and guarantee the car located in different place%endrandpla(i,1)=x;endfor i=1:num_of_carhighway(randpla(i,1),2)=randspe(i,1); %insert every car in different speed at diferent place %speed(i,1)=0;pla(i,1)=0;endinitialr_highway=highway; %record intialr-highway statement%disp(initialr_highway)disp('Aboveis the stateof initialr highway')while sum(sum(highway))~=0i=1;speed(1)=0; pla(1)=0;for j=1:length(highway) %Store the location and speed of each carif highway(j,2)~=0 ....to pla_matrix and speed_matrix separately%speed(i)=highway(j,2);pla(i)=j;i=i+1;endendcount=length(pla);while count>1 %When the differerce of two adjacent car's speed is greater than their distance,thenif speed(count)-speed(count-1)>=abs(pla(count)-pla(count-1)) ... the later car must change lane to the left% highway(pla(count),1)=highway(pla(count),2);highway(pla(count),2)=0;change_lane_times=change_lane_times+1;endcount=count-1;endlane_changed= highway; %record lane_changed highway statement%disp(lane_changed)disp('Aboveis the state of after-changed lane highway ')k=1;pas_spe(1)=0;pas_pla(1)=0;for j=1:length(highway)if highway(j,1)~=0pas_spe(k)=highway(j,1);pas_pla(k)=j;k=k+1;endendcount=length(pas_pla); %delete crashed car%while count>1if pas_spe(count)-pas_spe(count-1)>=abs(pas_pla(count)-pas_pla(count-1))highway(pas_pla(count),1)=0;highway(pas_pla(count-1),1)=0;crash_times=crash_times+1;endcount=count-1;endaft_adjust = highway;disp(aft_adjust)disp('Above is after adjusted highway')for i=1:length(highway)for j=1:2if i-highway(i,j)>0highway(i-highway(i,j),j)=highway(i,j);%move forward%endhighway(i,j)=0;endendfor i=1:length(highway)if highway(i,1)~=0&&highway(i,2)==0%back to right%highway(i,2)=highway(i,1);highway(i,1)=0;endendback_to_right = highway; %record lane_changed highway statement%disp(back_to_right);disp('Aboveis the state of back_to_right lane highway.');pla=0;speed=0;pas_pla=0;pas_spe=0;endfprintf('change_lane_time ','\n');disp(change_lane_times)fprintf('crash_time ','\n');disp(crash_times)Appendix 2. Data of ImitationPSL Change lane times Mean Crash times MeanNumberof cars=5 50 2 2 2 2.0 0 0 0 0.0 60 3 2 3 2.7 0 0 0 0.0 70 1 0 1 0.7 0 0 0 0.0 80 2 0 1 1.0 0 0 0 0.0 90 0 0 3 1.0 0 0 0 0.0 100 1 3 2 2.0 0 0 0 0.0Numberof 50 7 5 11 7.7 0 0 0 0.0 60 8 11 8 9.0 0 1 0 0.3cars=10 70 10 6 7 7.7 1 0 1 0.780 6 7 10 7.7 0 1 1 0.790 4 7 4 5.0 1 2 0 1.0100 6 3 3 4.0 1 1 1 1.0Numberof cars=20 50 47 29 38 38.0 1 2 2 1.7 60 30 34 20 28.0 2 0 1 1.0 70 15 17 22 18.0 0 2 3 1.7 80 18 22 16 18.7 0 2 1 1.0 90 20 10 22 17.3 1 1 2 1.3 100 21 15 13 16.3 2 2 1 1.7Numberof cars=30 50 61 60 48 56.3 5 4 2 3.7 60 46 42 45 44.3 4 1 2 2.3 70 42 38 48 42.7 4 5 3 4.0 80 43 32 47 40.7 2 5 5 4.0 90 32 41 33 35.3 3 4 5 4.0 100 26 27 24 25.7 2 2 4 2.7Numberof cars=40 50 65 100 74 79.7 8 4 8 6.7 60 56 77 75 69.3 5 8 3 5.3 70 53 64 62 59.7 4 5 5 4.7 80 52 60 60 57.3 3 7 3 4.3 90 44 53 48 48.3 5 4 4 4.3 100 43 50 38 43.7 1 7 0 2.7Numberof cars=50 50 82 86 106 91.3 12 12 10 11.3 60 80 68 72 73.3 10 9 13 10.7 70 82 75 81 79.3 8 7 10 8.3 80 61 72 58 63.7 9 7 11 9.0 90 57 54 54 55.0 6 7 11 8.0 100 64 50 51 55.0 7 9 8 8.0PSL=705 1 0 1 0.7 0 0 0 0.0 10 1067 7.7 1 0 1 0.7 20 15 17 22 18.0 0 2 3 1.7 30 42 38 48 42.7 4 5 3 4.0 40 53 64 62 59.7 4 5 5 4.7 50 82 75 81 79.3 8 7 10 8.3PSL Change lanetimescollisiontimesDensityChange lanetimescollisiontimes50 56.33333333 3.666666667 5.0 0.666666667 060 44.33333333 2.333333333 10.0 7.666666667 0.666666667 70 42.66666667 4 20.0 18 1.666666667 80 40.66666667 4 30.0 42.66666667 490 35.33333333 4 40.0 59.66666667 4.666666667 100 25.66666667 2.666666667 50.0 79.33333333 8.333333333。
【VIP专享】2010 -2014MCM Problems建模竞赛美赛题目中英文双语翻译版
2010 MCM ProblemsPROBLEM A: The Sweet SpotExplain the “sweet spot” on a baseball bat.Every hitter knows that there is a spot on the fat part of a baseball bat where maximum power is transferred to the ball when hit. Why isn’t this spot at the end of the bat? A simple explanation based on torque might seem to identify the end of the bat as the sweet spot, but this is known to be empirically incorrect. Develop a model that helps explain this empirical finding.Some players believe that “corking” a bat (hollowing out a cylinder in the head of the bat and filling it with cork or rubber, then replacing a wood cap) enhances the “sweet spot” effect. Augment your model to confirm or deny this effect. Does this explain why Major League Baseball prohibits “corking”?Does the material out of which the bat is constructed matter? That is, does this model predict different behavior for wood (usually ash) or metal (usually aluminum) bats? Is this why Major League Baseball prohibits metal bats?MCM 2010 A题:解释棒球棒上的“最佳击球点”每一个棒球手都知道在棒球棒比较粗的部分有一个击球点,这里可以把打击球的力量最大程度地转移到球上。
Keep_Right_Except_to_Pass_2014美赛A题参考
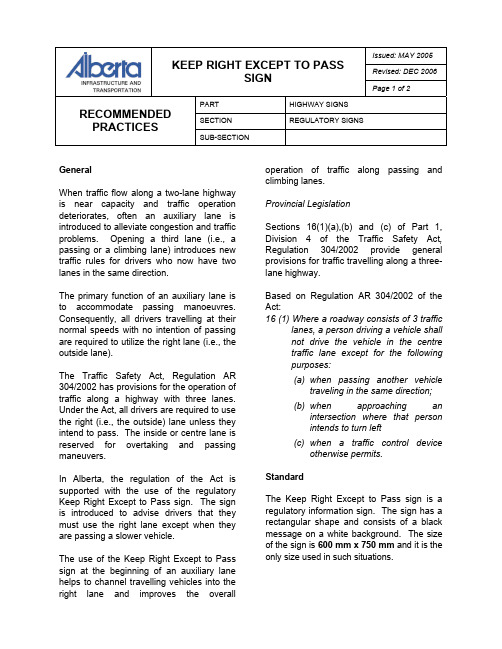
SIGNPage 1 of 2PART HIGHWAY SIGNS SECTION REGULATORY SIGNS RECOMMENDED PRACTICESSUB-SECTIONGeneralWhen traffic flow along a two-lane highway is near capacity and traffic operation deteriorates, often an auxiliary lane is introduced to alleviate congestion and traffic problems. Opening a third lane (i.e., a passing or a climbing lane) introduces new traffic rules for drivers who now have two lanes in the same direction.The primary function of an auxiliary lane is to accommodate passing manoeuvres. Consequently, all drivers travelling at their normal speeds with no intention of passing are required to utilize the right lane (i.e., the outside lane).The Traffic Safety Act, Regulation AR 304/2002 has provisions for the operation of traffic along a highway with three lanes. Under the Act, all drivers are required to use the right (i.e., the outside) lane unless they intend to pass. The inside or centre lane is reserved for overtaking and passing maneuvers.In Alberta, the regulation of the Act is supported with the use of the regulatory Keep Right Except to Pass sign. The sign is introduced to advise drivers that they must use the right lane except when they are passing a slower vehicle.The use of the Keep Right Except to Pass sign at the beginning of an auxiliary lane helps to channel travelling vehicles into the right lane and improves the overall operation of traffic along passing and climbing lanes.Provincial LegislationSections 16(1)(a),(b) and (c) of Part 1, Division 4 of the Traffic Safety Act , Regulation 304/2002 provide general provisions for traffic travelling along a three-lane highway.Based on Regulation AR 304/2002 of the Act:16 (1) Where a roadway consists of 3 trafficlanes, a person driving a vehicle shall not drive the vehicle in the centre traffic lane except for the following purposes:(a) when passing another vehicletraveling in the same direction; (b) when approaching anintersection where that person intends to turn left (c) when a traffic control deviceotherwise permits.StandardThe Keep Right Except to Pass sign is a regulatory information sign. The sign has a rectangular shape and consists of a black message on a white background. The size of the sign is 600 mm x 750 mm and it is the only size used in such situations.SIGNPage 2 of 2RB-34 600 mm x 750 mmColour Message and BorderBackgroundBlackWhiteSheeting ASTM, Type IIIGuidelines for UseIt is very common that drivers approachinga passing or climbing lane are unsure ofhow to properly use the auxiliary lane. Acommon mistake is to continue to travel inthe inside lane, which in consequence maycause delays to faster moving vehicles.It is therefore advisable to provide aregulatory Keep Right Except to Pass signfor each highway segment which has anauxiliary lane. The sign typically hasapplications at locations with steep grades(climbing lanes) or high traffic volumes(passing lanes) to minimize the effect ofslow moving vehicles on normal traffic flow.Guidelines for PlacementThe sign is placed on the right side of theroadway at the start of the taper for theclimbing lane or passing lane.A supplementary sign may be considered forpassing lanes longer than 2 km. The secondsign should be placed no closer than 1 kmfrom the end of the climbing or passing lane.References to StandardsTypical SignageDrawingsTEB 1.58Typical Signing for Passingand Climbing Lanes。
- 1、下载文档前请自行甄别文档内容的完整性,平台不提供额外的编辑、内容补充、找答案等附加服务。
- 2、"仅部分预览"的文档,不可在线预览部分如存在完整性等问题,可反馈申请退款(可完整预览的文档不适用该条件!)。
- 3、如文档侵犯您的权益,请联系客服反馈,我们会尽快为您处理(人工客服工作时间:9:00-18:30)。
数学建模竞赛(MCM / ICM)汇总表基于细胞的高速公路交通模型自动机和蒙特卡罗方法总结基于元胞自动机和蒙特卡罗方法,我们建立一个模型来讨论“靠右行”规则的影响。
首先,我们打破汽车的运动过程和建立相应的子模型car-generation的流入模型,对于匀速行驶车辆,我们建立一个跟随模型,和超车模型。
然后我们设计规则来模拟车辆的运动模型。
我们进一步讨论我们的模型规则适应靠右的情况和,不受限制的情况, 和交通情况由智能控制系统的情况。
我们也设计一个道路的危险指数评价公式。
我们模拟双车道高速公路上交通(每个方向两个车道,一共四条车道),高速公路双向三车道(总共6车道)。
通过计算机和分析数据。
我们记录的平均速度,超车取代率、道路密度和危险指数和通过与不受规则限制的比较评估靠右行的性能。
我们利用不同的速度限制分析模型的敏感性和看到不同的限速的影响。
左手交通也进行了讨论。
根据我们的分析,我们提出一个新规则结合两个现有的规则(靠右的规则和无限制的规则)的智能系统来实现更好的的性能。
1介绍1.1术语1.2假设2模型2.1设计的元胞自动机2.2流入模型2.3跟随模型2.4超车模型2.4.1超车概率2.4.2超车条件2.4.3危险指数2.5两套规则CA模型2.5.1靠右行2.5.2无限制行驶规则3补充分析模型3.1加速和减速概率分布的设计3.2设计来避免碰撞4模型实现与计算机5数据分析和模型验证5.1平均速度5.2快车的平均速度5.3密度5.4超车几率5.5危险指数6在不同速度限制下敏感性评价模型7驾驶在左边8交通智能系统8.1智能系统的新规则8.2模型的适应度8.3智能系统结果9结论10优点和缺点10.1优势10.2弱点引用附录。
1 Introduction今天,大约65%的世界人口生活在右手交通的国家和35%在左手交通的国家交通流量。
[worldstandards。
欧盟,2013] 右手交通的国家,比如美国和中国,法规要求驾驶在靠路的右边行走。
多车道高速公路在这些国家经常使用一个规则,要求司机在最右边开车除非他们超过另一辆车,在这种情况下,他们移动到左边的车道、通过,返回到原来的车道。
这种通过和超车的驾驶规则被称为“靠右行驶”规则,或是我们的论文keep right规则。
左手交通规则的国家是镜像对称的和靠右的规则相同(“,除了通过,全都靠左行走”)。
所以,应用这些规则的目的为何?靠右的规则能改善高速公路交通状况吗?交通能从靠右的限制中解放出来吗(车辆可以选择从任何一方超车)交通解除靠右行的限制被称为服从不受限制的规则,靠右的规则执行能和不受限制的规则是如何比较的?基于元胞自动机模型和蒙特卡罗算法,我们建立一个模型来模拟在不同条件下高速公路交通(靠右的规则或限制规则,根据交通或交通拥挤, 双车道或三车道)。
我们的模型分为3个子模型(进入模型,跟随行驶模型和超车模型)。
进入模型采用泊松概率分布的模拟vehicle-generation过程。
跟随模型引入了一个特别的概率分布模型,使模拟的过程一辆车跟随另一辆车更为现实。
超车模型模拟了超车行为,定义了危险指数的安全风险评估对于某些高速公路。
我们也建立一个智能系统控制的扩展交通模型我们在MATLAB中实现该模型,获得足够的数据。
我们测试了平均速度、密度、超车取代率和危险指数,分析它们的属性评估靠右的规则的性能相比较无限制的规则。
此外,我们分析我们的模型在不同的速度限制下的敏感性。
事实证明,我们的模型是可靠的。
然后我们得出我们的结论符合常识。
在交通智能的控制下,我们还提出一种新的规则。
V 当前车辆的速度Vm 车辆的最大速度Vl 高速公路的速度上限V0超车前的速度V1超车过程的速度G 车辆的间距Gs安全考虑所需的最小差距G0 停车后最小的差距Tr (人类反应时间) Po超越概率Pa加速概率Pb减速概率f制动时的摩擦力d在一个超越事件的危险指数D道路系统的危险指数 a 超车加速度Ap车道超车组件加速度Ad可行的减速1.1Terminology•双车道公路:两个车道在路的右前卫,总共四条车道。
•Three-lane路:三车道在路的右前卫,总共6车道。
•危险指数:索引设计在我们的论文评估的危险道路系统。
•最小安全差距:认为两辆车之间的距离在我们的模型足够安全。
•靠右规则:保持正确的除了通过规则。
•无限制的规则:车辆不受限制,可以超越别人任何一方。
•Free-driving风格:当没有附近的车辆,司机不会故意加速或减速,但速度仍将小幅波动。
1.2 Assumptions•路是直的,并且没有旁路。
•一个车道的宽度只够一车。
•所有车辆都有相同的体积。
•只有两种车辆在路上(一快一慢)。
•环境和气候对开车有好处。
•驾驶右边是常态。
•行人被忽略。
2The Models2.1 Design of Cellular Automata元胞自动机(CA)表明,在大量的前人交通模拟(瓦格纳P et al.2005)的基础,CA模型是可行和有效的方法来模拟交通流。
空间、时间和状态都是离散的细胞自动机。
例如,该模型将道路划分成小矩形将时间分为时间单位。
这个特性显著简化模拟过程。
此外,细胞的状态由周边控制,细胞的这一组规则,非常类似于现实生活中的交通汽车的运动很大程度上取决于周边汽车运动。
因此, 对我们来说是合理应用元胞自动机在解决我们的问题。
在我们的模拟中,我们每个车道划分为1000个细胞。
每个细胞都是4米在长度和宽度两个属性上,当前速度V和最大速度Vm。
每个细胞是空的即当V为0,因为一辆车不会停止,模拟时是绝对无故障。
我们简单的认为只有一个方向的高速公路。
因此,高速公路有n条车道转化为n * 1000矩阵。
在我们的模拟中,我们使用两种类型的汽车,快的速度的模拟汽车和缓慢的模拟卡车。
对于每一个车道,前6个细胞作为car-generation区域,车流观察至少10细胞和交通密度计算的基础上至少500个细胞。
我们的模型每秒更新一次,当周期T = 1s为一个司机的平均反应时间我们讨论了CA模型的基本过程:•流入过程:根据流入模型,我们将讨论最近的, 分配车辆vehicle-generation地区。
•加速过程:如果V < Vm ,∆V为汽车增加的速度,和新的速度V’= V +∆V。
•减速过程:如果车辆与车辆之间的距离(前保险杠和后保险杠的距离,我们称之为的差距, 用G表示差距及其单位是细胞。
当没有车辆,G= +∞。
)不超过V,车辆减速V ’=(G−1)/ T。
•移动过程:车辆前进通过V ‘*T细胞只有当G >Gs(V ‘)。
(Gs(V’)是为了安全考虑,所需的最小差距和是被定义之后。
) 具体的规则将被设置在流入模型中,下面的模型和超车模型是为了模拟靠右行车交通规则和自由行车交通规则2.2 Inflow Model流入模型,或vehicle-generation模型,模拟了随机到达高速公路的入口处的车辆。
对于每一个车道,前六个细胞在元胞自动机中设置为vehicle-generation区域。
我们假设每辆车的到达服从二项概率分布。
让ts表示采样时间间隔和N表示在ts时间内车辆的总数。
然后N可以近似服从泊松概率分布。
让Pt(N)表示N的可能性,于是我们有ts表示在一秒,我们可以分配N的期望的值的范围从0到3.6。
N作为在每一秒中到达的总车辆,N的期望能有效地反映交通状况。
λ越小,交通越轻松。
因此我们能够模拟不同流量条件下,交通的轻或重,通过分配相应的值λ。
λ的值设定后,我们得到了进入高速公路的车辆模拟每一秒的随机号码。
每个车道然后随机分配进入。
我们的车辆模型支持两种不同的速度范围, 假设所有车辆的初始速度设置为20 m / s。
这种做法带来了简化而不削弱结果。
这是因为由于交通密度控制和加速度的分布概率的引入,所有车辆的速度往往是一个值。
当交通密度低,车辆可以自由加速到最大速度,而不用担心冲突,因此收敛速度在允许的最高速度而不用担心撞车。
当交通密度高,所有的通道将充满车辆,交通流的速度是由车道上速度最慢的车决定,因此收敛速度是在较低的速度限制。
经过初步分析,收敛速度模型稍后将合理的实现。
利用泊松概率分布使流入模型接近现实和实用。
由于收敛趋势,一样的初速度在不改变的情况下就能得到简化。
2.3 Vehicle-Following Model美国联邦公路管理局的部门定义司机的反应时间PIEV时间。
PIEV时间由四部分组成:•感知过程:司机在驾驶环境中感知的变化。
•理解过程:司机分析关于变化的信息。
•评估过程:司机决定根据他的驾驶行为分析。
•意志过程:司机执行驾驶行为我们应用PIEV在匀速行驶模型和超车模型。
在每次循环中,我们首先获得每辆车的速度和位置,计算差距,然后确定驾驶行为(无论继续或改变车道超车后)。
根据驾驶行为,计算加速度和更新的速度和位置驾驶行为的决定主要是基于当前的差距。
如果差距G是足够安全,加速度是可行的;否则,车辆应缓慢下来。
在这里,我们定义的最小安全距离Gs 取代Tr*V(Tr代表PIEV时间,V是当前速度。
)我们假设驾驶行为决定遵循一定的原则:•当G > Gs,车辆会加速(后来我们将介绍一个概率模型去模拟这种倾向),直到实现高速公路速度限制或其最大可能速度;•当G < Gs,是否超车或跟随由超越概率Po和超车条件决定(Po和超越条件将在超车模型中讲到)。
当跟随时,车辆加速,减速或保持原来的速度。
我们引入两个参数(SUN yue 2005),加速概率Pa和减速概率Pb。
速度越高,Pa越小,Pb越大。
Vl代表最高的高速公路限速, Vmax是车辆的最大可以达到速度。
这个概率模型考虑到,超速是不能忽视的这一事实。
当V >Vl,Pa会变得更小和Pb会变得更大,这使得超速的可能性很小。
我们使用一个随机变量R来实现:如果R <Pb、车辆减速;•如果R > 1−P a 车辆加速;否则,车辆保持目前的速度。
基于概率模型,我们对元胞自动机创建多个规则来实现(车辆的最大可能速度Vmax,当前的差距G,最低安全差距Gs及其速度由V表示,Pa、Pb 是有关速度V的函数和Pa+Pb<=1。
•自由驾驶规则:如果G≥Gs,•安全减速规则:如果G < Gs 且继续向前行驶不会相撞Vmin 是最低速度限制•不相撞规则:如果不能前进,停止在前车辆的后边。
Pa和Pb的值在表2为快车,表3为缓慢的。
2.4 Overtaking Model2.4.1 Overtaking Probability司机将决定是否超过另一辆车的概率Po。
Po概率取决于车辆A和前方的车辆B。
让Vmax 1 是A车辆的速度,Vmax 2是B车辆的速度。
Po概率应满足:它合理的假设了速度差异越大,越有可能是加速的事实。