山东年鉴2015全国各省市区社会经济发展指标:主要农产品产量(2014年)
合集下载
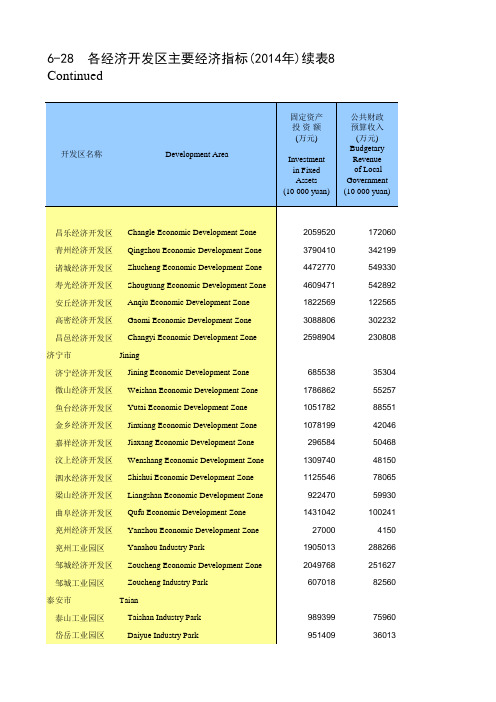
山东统计年鉴2015社会经济发展指标:各经济开发区主要经济指标2014年续表8
Taishan Industry Park
岱岳工业园区
Daiyue Industry Park
2059520 3790410 4472770 4609471 1822569 3088806 2598904
685538 1786862 1051782 1078199
296584 1309740 1125546
微山经济开发区 Weishan Economic Development Zone
鱼台经济开发区 Yutai Economic Development Zone
金乡经济开发区 Jinxiang Economic Development Zone
嘉祥经济开发区 Jiaxang Economic Development Zone
3504091 7159605
362537 730242
12869091 9131353
15482275 4887521 4170989
12257102 9063378
14713888 4645732 3839659
827995 848601 1395556 351779 435743
Business
Total Profits
Revenue of and Taxes of
Industrial
Industrial
Enterprises
Enterprises
above
above
Designated Size Designated Size
6810750 13505408 15811079 14533078
922470 1431042
27000 1905013 2049768
607018
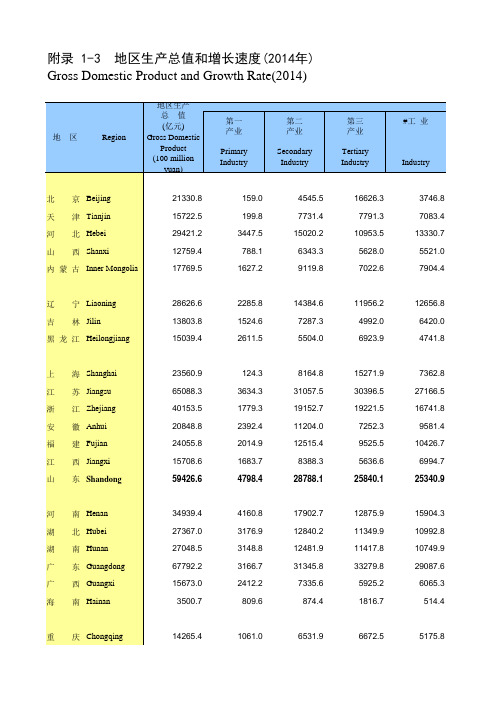
山东年鉴2015全国各省市区社会经济发展指标:地区生产总值和增长速度(2014年)
15271.9 30396.5 19221.5
7252.3 9525.5 5636.6 25840.1
7362.8 27166.5 16741.8
9581.4 10426.7
6994.7 25340.9
河 南 Henan 湖 北 Hubei 湖 南 Hunan 广 东 Guangdong 广 西 Guangxi 海 南 Hainan
858.2
483.7
541.9
10.0
34939.4 27367.0 27048.5 67792.2 15673.0
3500.7
4160.8 3176.9 3148.8 3166.7 2412.2
809.6
17902.7 12840.2 12481.9 31345.8
7335.6 874.4
12875.9 11349.9 11417.8 33279.8
1320.4
1961.2
9.9
1393.6
710.5
1124.1
9.7
3534.5
2278.6
7835.2
8.7
2079.4
1614.0
2284.0
8.9
1912.9
1181.6
2143.2
9.7
1744.9
1257.6
2211.8
9.5
2323.7
2663.1
8047.5
7.8
1274.6
714.4
Hale Waihona Puke #批发和 零售Wholesale and Retail
地区 生产总值 比上年 增长(%) Growth
Rate (%)
907.4
948.1
山东统计年鉴2015社会经济发展指标:各市公共财政预算支出2014年

166419 133797
80687 39537 96746 20052 22358 46000 42081 36551 53697 40313
014)
文化体育 与传媒 Culture、 Sports and Media
社会保障 和就业
Social Security and Employment
医疗卫生 Health
节能环保 Energysaving and Environment Protection
城乡社 区事务 Urban and Rural Community Affairs
农林水事务 Farming、 Forestry and Irrigation
Affairs
1277473 142080 147612 60516 57073 37502 93391 77043 129310 56646 46417 28702 9358 53001 33726 40521 64977 57652
1666733 147421 126356 140102 62833 63846 98923 210297 111784 61167 101248 54155 23372 102861 94439 96780 79193 70147
7779249 1041665 1971377
307081 144052 353709 707279 438104 542708 302042 289876 116810
(10 000 yuan)
住房保障 支出
Housing Security Affairs
3991400 167928 795226 92434 86830 104113 183180 201253 156730 86881 117621 67560 35555 158373 135674 108856 108784 111234
山东年鉴2015全球世界各国社会经济发展指标:主要农产品产量续表2

20.2 471.3 871.8 354.6 822.7 643.4
82210.6 17131.8 10000.0
5430.2 2953.3 2815.5 2750.2 2332.7 2325.0 2259.2 2219.4 1740.0 1193.5 1160.8 1116.5 1066.6
972.8 909.2 845.8 837.5 821.8 794.8 769.9 759.8 691.1 688.2 676.6 634.1
16129.8 7505.4 3273.5 2013.6 1541.2 527.6 298.0 270.3 0.7 6.4 119.7 34.2 101.8 15.4 42.9 90.4 35.0
10.2 23.5
9.7 2.8 14.2 31.2 14.9 0.4 12.8 11.3
24184.1 世 界 8205.5 中 国 6584.9 尼日利亚 4010.0 印 度 1280.0 俄 罗 斯 1150.0 印度尼西亚 835.0 巴 西 487.0 泰 国 300.0 乌 克 兰 241.0 加 纳 240.0 美 国 180.6 刚果(金) 85.2 安 哥 拉 65.0 越 南 58.0 莫桑比克 42.2 德 国 35.0 坦桑尼亚 28.1 波 兰 24.8 孟加拉国 23.6 乌 干 达 20.5 科特迪瓦 20.3 马 拉 维 20.0 柬 埔 寨 18.0 埃塞俄比亚 17.5 白俄罗斯 17.0 喀 麦 隆 15.3 荷 兰 12.3 法 国
西班牙
Spain
南非
South Africa
罗马尼亚
Romania
哈萨克斯坦 Kazakhstan
日本
Japan
柬埔寨
山东统计年鉴2015社会经济发展指标:按登记注册类型行业分城镇单位就业人员平均工资2014年
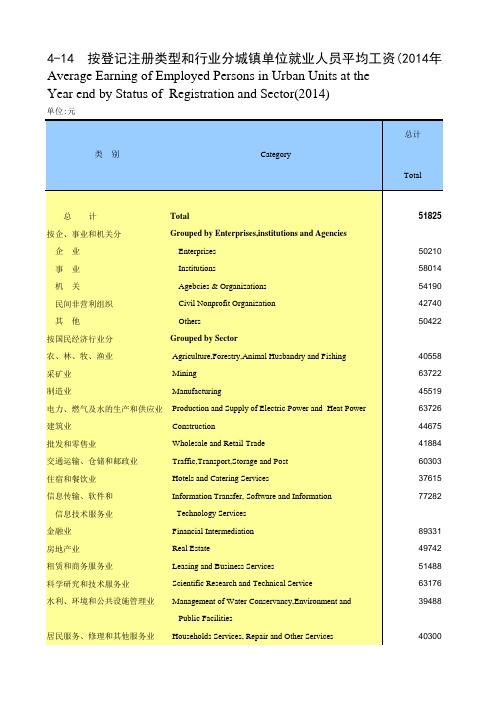
类别
Category
Total
总计
Total
按企、事业和机关分
Grouped by Enterprises,institutions and Agencies
企业
Enterutions
机关
Agebcies & Organizations
民间非营利组织
Civil Nonprofit Organization
其他
Others
按国民经济行业分
Grouped by Sector
农、林、牧、渔业
Agriculture,Forestry,Animal Husbandry and Fishing
采矿业
Mining
制造业
Manufacturing
电力、燃气及水的生产和供应业 Production and Supply of Electric Power and Heat Power
信息技术服务业
Technology Services
金融业
Financial Intermediation
房地产业
Real Estate
租赁和商务服务业
Leasing and Business Services
科学研究和技术服务业
Scientific Research and Technical Service
水利、环境和公共设施管理业 Management of Water Conservancy,Environment and
Public Facilities
居民服务、修理和其他服务业 Households Services, Repair and Other Services
山东年鉴2015全球世界各国社会经济发展指标:主要农产品产量

(10 000 tons)
稻谷
Rice, Paddy
2000
2012
59692.7 18981.4 12746.5
5189.8 3253.0 2584.4 3762.8 2132.4 1238.9 1109.0
943.4 720.4 402.6 865.8 719.7 600.1 421.7 329.8 248.1 286.0 220.2 189.2 214.1 197.2 269.4
256625.5 世 界 54116.3 中 国 35693.3 印 度 29329.0 印度尼西亚 8990.8 越 南 8844.3 泰 国 7098.2 孟加拉国 6876.7 缅 甸 5280.3 菲 律 宾 5178.1 巴 西 4846.7 日 本 4574.0 巴基斯坦 4494.1 柬 埔 寨 4337.2 美 国 4281.0 韩 国 4096.4 埃 及 3800.6 尼 泊 尔 3361.5 尼日利亚 3337.2 马达加斯加 3017.5 斯里兰卡 2826.9 老 挝 2633.3 秘 鲁 2544.0 马来西亚 2375.6 伊 朗 2201.0 哥伦比亚
附录2-15 主要农产品产量 Production of Major Farm Crops
资料来源:联 合国FAO数据 Source:FAO Database. 单位:万吨
国家或地区 Country or Area
谷物
Cereals,Total
2000
2012
国家或地区 Country or Area
418.3 1003.6
941.3 711.6 456.5 362.7 391.4 438.7 231.0 646.8 194.0 750.1
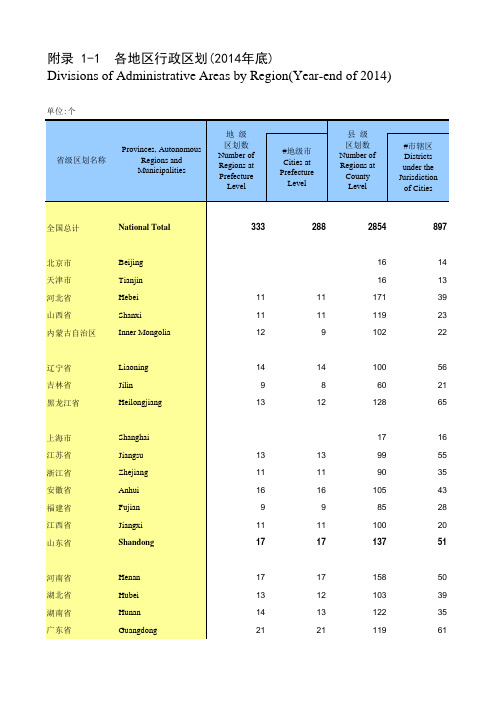
山东年鉴2015全国各省市区社会经济发展指标:各地区行政区划(2014年底)
4
4648
1937
2382
11
1396
762
500
29
1389
665
561
694
140
544
1420
1142
74
7
1351
526
702
7
399
140
225
237
102
91
6
1038
305
562
59
120
21
14
206
98
329
208
134
140
163
9
10
204
34
123
28
34
44
42
170
1153
902
3
1587
1128
11
(unit)
#民族乡 Minority Autonomous Township
街道 办事处 Street Communities
1020
5 1 50
18
56 28 53
1 14
9 19
8
12 10 97
7
7696
147 113 288 202 240
668 282 338
#地级市 Cities at Prefecture
Level
县级 区划数 Number of Regions at County Level
#市辖区 Districts under the Jurisdiction of Cities
全国总计
National Total
北京市 天津市 河北省 山西省 内蒙古自治区
山东统计年鉴2015社会经济发展指标:各市畜牧业生产情况2014年

ቤተ መጻሕፍቲ ባይዱ
511.04 76.75 22.69 15.31 11.69 22.92 17.51 37.89 33.00 39.95 7.33 8.08 1.52 30.64
162.05 41.86 57.21 49.75
495.36 76.16 22.66 15.30 11.09 22.64 17.41 37.72 32.89 39.73 7.32 8.04 1.52 30.54
156.27 37.42 55.92 47.85
2910.70 207.72 212.04 67.12 118.56 72.91 250.33 469.21 337.26 218.21 101.09 149.61 50.61 379.52 401.55 160.64 130.94 399.42
2174.56 153.16 20.32 50.13 120.25 91.23 40.18 105.32 245.80 181.82 12.36 66.04 37.56 244.21 192.40 150.30 82.30 774.85
13-13 各市畜牧业生产情况(2014年) Production of Animal Husbandry by Region(2014)
地区
Region
大牲畜 年末存栏
(万头) Stocked Large Livestock at
Year-end (10000 heads)
#牛 Cattle
猪 年末存栏
(万头)
Stocked Pigs at Year-end (10000 heads)
羊 年末存栏
(万只) Stocked Sheep and Goats at
Year-end (10000 heads)