蜂巢结构的应用与研究
蜜蜂的蜂巢的结构与材料选择
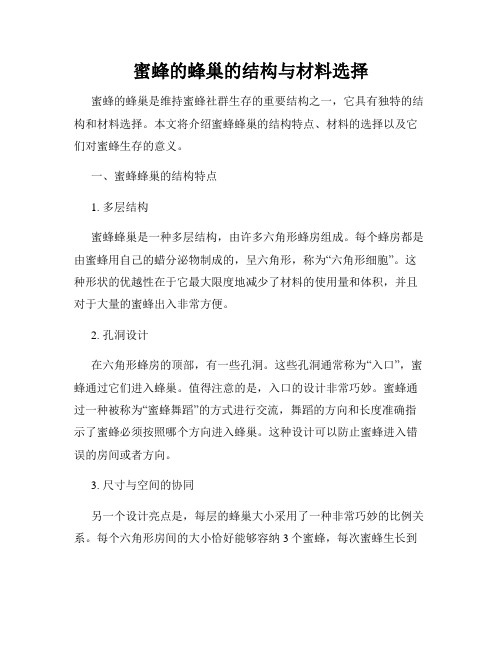
蜜蜂的蜂巢的结构与材料选择蜜蜂的蜂巢是维持蜜蜂社群生存的重要结构之一,它具有独特的结构和材料选择。
本文将介绍蜜蜂蜂巢的结构特点、材料的选择以及它们对蜜蜂生存的意义。
一、蜜蜂蜂巢的结构特点1. 多层结构蜜蜂蜂巢是一种多层结构,由许多六角形蜂房组成。
每个蜂房都是由蜜蜂用自己的蜡分泌物制成的,呈六角形,称为“六角形细胞”。
这种形状的优越性在于它最大限度地减少了材料的使用量和体积,并且对于大量的蜜蜂出入非常方便。
2. 孔洞设计在六角形蜂房的顶部,有一些孔洞。
这些孔洞通常称为“入口”,蜜蜂通过它们进入蜂巢。
值得注意的是,入口的设计非常巧妙。
蜜蜂通过一种被称为“蜜蜂舞蹈”的方式进行交流,舞蹈的方向和长度准确指示了蜜蜂必须按照哪个方向进入蜂巢。
这种设计可以防止蜜蜂进入错误的房间或者方向。
3. 尺寸与空间的协同另一个设计亮点是,每层的蜂巢大小采用了一种非常巧妙的比例关系。
每个六角形房间的大小恰好能够容纳3个蜜蜂,每次蜜蜂生长到成年大小时,它们就会自然地离开自己的房间。
这种设计可以保持蜂巢整齐协调,有利于繁殖、生活和利用储存资源。
二、材料选择1. 蜂蜡蜂蜡是一种蜜蜂用于制作蜂巢的材料,它是一种保持柔软性和黏附性的天然高分子化合物。
蜂蜡含有碳水化合物、有机酸类、蛋白质和脂肪等各种生物化学成分。
蜂蜡的优点在于它可塑性好,硬度适中,然而它也有缺点:晶体化温度低、抗拉强度低以及常温下易变形等。
但总的来说,蜂蜡是一种理想的材料,可以为蜜蜂社区提供一个具有完美结构的栖息地。
2. 蜜蜂胶蜜蜂胶是另一种蜜蜂的重要材料,是一种由蜜蜂在采蜜之旅中搜集的树脂和唾液混合物。
蜜蜂胶通常用于封住蜂房中的小裂缝,以防止空气和外界的灰尘进入蜂巢。
蜜蜂胶具有黏性,粘性和抗菌等性质,使得它可以保证蜂巢的安全度,保证蜜蜂的生存。
三、对蜜蜂生存的意义蜜蜂的蜂巢具有多种功能,包括居住、储存蜜和果汁、产卵和养育蜴蜂等。
此外,蜂巢还可以帮助蜜蜂调节温度、保护蜜蜂免受天敌和天气的影响。
五年级研究蜂巢结构的优势实验报告

五年级研究蜂巢结构的优势实验报告蜜蜂的蜂窝构造非常精巧、适用而且节省材料。
蜂房由无数个大小相同的房孔组成,房孔都是正六角形,每个房孔都被其它房孔包围,两个房孔之间只隔着一堵蜡制的墙。
令人惊讶的是,房孔的底既不是平的,也不是圆的,而是尖的。
这个底是由三个完全相同的菱形组成。
有人测量过菱形的角度,两个钝角都是109°而两个锐角都是70°。
令人叫绝的是,世界上所有蜜蜂的蜂窝都是按照这个统一的角度和模式建造的。
蜂窝结构的优点主要有:(一)、材质消耗少,比强度和比刚度高,重量轻。
蜜蜂用最少的材质消耗,构筑成容积最大,也最坚固的蜂巢。
经科学研究论证,蜂窝的几何结构,形成整体恰似拱桥的结构,从而使面上的抗压强度提高了100倍。
蜂窝纸板采用蜂窝结构,因而也同样以最少的材质消耗,获得最大的容积和最大的强度、刚度。
在纸材消耗相同的情况下,比瓦楞纸板要高出……,接近EPS(可发性聚苯乙烯泡沫塑料),仅为水的几十分之一。
(二)、优异的缓冲隔振功能。
蜂窝纸板为芯状结构,具有优异的缓冲隔振功能,接近EPS。
(三)、良好的隔热、隔音性能蜂窝芯的蜂窝孔为密闭结构,其中充满空气而互不流通。
因此具有良好的隔热、隔音性能。
(四)、强度、刚度易于调节。
改变芯纸的厚度、克重或改变蜂窝芯的孔径、芯柱高度,蜂窝纸板即可获得不同的强度和刚度。
(四)、可进行特殊的工艺处理而获得独特的功能。
蜂窝纸板是全纸质材料,易于进行特殊工艺处理而获得防水、阻燃、防霉、固化增强等特殊性能。
这也是蜂窝纸板能够推广应用的原因之一。
(六)、出口无需熏蒸,免检疫蜂窝纸板由于在生产过程中经过红外线烘干或微波烘干,相当于进行了消毒灭菌处理,所以出口无需熏蒸,免检疫。
这就可以在一定程度上代替木材而用于出口产品的包装。
(七)、环保型产品蜂窝纸板在生产过程中无污染,又能回收再生,也易于废弃处理。
因此可以代替EPS作为缓冲材料。
大自然的工程师:蜂巢结构与建筑设计的奥秘
大自然的工程师:蜂巢结构与建筑设计的奥秘1. 引言1.1 概述在自然界中,有许多令人叹为观止的工程设计。
而其中,蜂巢结构是一个引人入胜且深具启发性的例子。
蜂巢搭建起来的美妙工艺和优越性能一直以来都令人着迷,并成为建筑界的灵感之源。
本篇文章将探索蜂巢结构以及它在建筑设计中所展现出的奥秘。
1.2 文章结构首先,我们将深入了解蜂巢结构的生物学奥秘。
通过分析蜂巢结构的生物学特征、结构和功能性,我们可以更好地理解其在自然界中独特的存在意义。
接下来,我们将关注蜂巢结构在建筑设计领域中的应用。
通过研究受到蜂巢结构启发的案例和探索相关的建筑材料与技术创新,我们可以探讨如何将这种工程设计应用于实际建筑项目中,并提供可持续性和环境友好性方面的思考。
随后,我们将介绍工程师如何模仿蜂巢结构进行设计。
通过综合科技发展和实践案例,我们将探讨在设计过程中的材料选择、建造考量以及评价设计成果和展望未来发展的相关因素。
最后,本文将提供结论和对未来研究与应用的展望。
总结文章中的主要观点和发现,并探讨蜂巢结构在建筑设计领域中的潜力以及可能的未来发展方向。
1.3 目的本篇文章的目的是揭示蜂巢结构与建筑设计之间的奥秘关系,进一步探索如何将自然界中优秀而高效的工程设计灵感应用于现实世界中。
通过深入了解蜂巢结构的生物学特征和功能性,并研究其在建筑设计领域中的应用与实践,我们可以挖掘更多创新思路和可持续发展的可能性。
最终,希望能够为工程师提供有关模仿蜂巢结构进行建筑设计以及可持续性发展方面的启示与指导。
2. 蜂巢结构的生物学奥秘2.1 生物学特征蜂巢是由蜜蜂通过分泌和凝固的蜂蜡建造的。
蜂蜡是由腹部的四对腺体分泌出来的一种固态黄色物质。
在创建一个完整的巢室过程中,工蜂们会用舌头把刚分泌出来保持温暖柔软的新鲜蜂蜡咬碎,然后在自己的体表上进行搓揉和压实。
最终,这些小球被用来建造六角形房间。
2.2 结构解析蜂巢通常采用六角形房间(也称为“六方胞室”)组成。
蜂巢轻质墙体结构与自承重结构体系研究与应用
蜂巢轻质墙体结构与自承重结构体系研究与应用蜂巢轻质墙体结构是由多个相连的蜂窝状空腔组成,形成一种板材状的结构。
这些蜂窝状空腔可以以不同的密度排列,以形成不同的结构材料特性。
蜂巢轻质墙体结构材料的主要组成成份是聚丙烯蜂巢板材。
这种材料具有重量轻、强度高、隔热保温效果好、耐腐蚀、耐火等特点。
蜂巢轻质墙体结构在建筑中可以用来代替传统的砖混结构和钢结构,具有更轻质、更强度高、更具隔热保温效果好的特点。
自承重结构体系是一种以材料的本身强度为结构的建筑体系。
其具有负载自然、布局灵活、施工方便等特点。
在自承重结构体系中,蜂巢轻质墙体结构可以作为承载结构,承受建筑本身的荷载,并且还可以充当隔热保温层,起到节能隔热的作用。
同时,蜂巢轻质墙体结构还可以用来承受侧向荷载和抗震功效优异,具有较好的抗震性能。
蜂巢轻质墙体结构与自承重结构体系的应用主要集中在住宅建筑、公共建筑以及工业建筑等领域。
在住宅建筑中,蜂巢轻质墙体结构可以应用于墙体结构、屋面结构以及地板结构等,提高建筑的整体性能。
在公共建筑中,蜂巢轻质墙体结构可以应用于墙体隔断、楼梯扶手、室内装饰等部位,提高建筑的空间利用率和美观性。
在工业建筑中,蜂巢轻质墙体结构可以应用于仓库、车间等建筑中,提高建筑的抗震性能和耐久性。
总的来说,蜂巢轻质墙体结构与自承重结构体系是一种新型的建筑结构系统,具有重量轻、强度高、隔热保温效果好、耐腐蚀、耐火等特点。
通过蜂巢轻质墙体结构与自承重结构体系的研究和应用,可以为建筑行业提供更加环保、节能、安全、稳定的建筑结构,推动建筑工艺的创新与发展。
蜂巢结构知识点总结
蜂巢结构知识点总结蜂巢是蜂类昆虫的居住地,它们通过蛹类昆虫的分泌物建造起来,通常是一种由六角形蜂房组成的结构。
蜂巢有着复杂的结构和生态功能,对于蜜蜂和其他昆虫来说,它不仅仅是一个居住地,更是一个生存、繁衍和保护自己的场所。
蜂巢的建筑和结构是由蜂类昆虫蜂王、工蜂和雄蜂联合完成的,他们通过分工合作来建造一个完整的、有机的蜂巢系统,下面将从构造原理、功能作用和生态影响等方面来详细介绍蜂巢结构的知识点。
一、蜂巢结构的构造原理1. 分泌物的作用蜂巢主要由蛹类昆虫的分泌物构造而成,这些分泌物包括了蜂蜡、蜂蜜、花粉等物质。
蜂蜡是由工蜂腹部的蜜腺分泌出的一种蜡质物质,它有着良好的延展性和粘性,能够很好的粘结在一起,形成六角形的蜂房结构。
蜂巢的构造过程是通过工蜂将蜜腺分泌的蜂蜡和吸食过的花蜜等物质,通过咀嚼和温度调节等方式形成一个个六角形的蜂房,并利用蜂蜡将它们粘结在一起。
2. 分工合作的作用蜂巢的构造是由蜂群的成员共同完成的,它们通过分工合作,各司其职,共同建造一个完整的蜂巢结构。
蜂王负责产卵和繁衍后代,工蜂则负责采集食物和分泌蜂蜡,雄蜂则负责与蜂王交配。
这三种蜂类昆虫分工合作,协调一致地完成了蜂巢的建造。
3. 温度调节的作用蜂巢的结构具有较好的保温和保湿功能,它能够形成一个相对稳定的微气候环境。
工蜂通过咀嚼蜂蜡使其软化,并利用自己的体温将其加热,然后再构造成六边形蜂房,从而形成了蜂巢独特的结构。
这种结构不仅能够保护蜜蜂不受外部环境的影响,还能够提供一个适宜的生存、繁衍条件。
二、蜂巢结构的功能作用1. 生存和繁衍的场所蜂巢是蜂群的家园,它不仅是蜜蜂的居住地,也是它们繁衍后代的场所。
蜂巢内部有着大量的蜂房,每个蜂房内都孵化着成千上万只幼蜜蜂。
在这个温暖、湿润的环境中,幼蜜蜂可以安全地成长,直到成为一只真正的蜜蜂。
2. 储存和保护食物蜜蜂通过采集花蜜和花粉等食物,然后将其储存在蜂巢内。
蜂巢内部有大量的蜜罐和花粉罐,它们可以有效地储存食物,并且保护它们不受外部环境的影响。
蜂巢的结构及生活中的应用

蜂巢的结构及生活中的应用蜂巢的结构真是个神奇的东西,听说它是大自然的艺术品。
光是看那一个个六边形的单元,就让人觉得大自然的设计师真是个天才。
你想啊,这种形状不光好看,还能最大化利用空间,简直是效率满满!蜜蜂们在里头忙忙碌碌,仿佛一个个小小的工程师,工作得可认真了,真是让人佩服得五体投地。
那些蜜蜂在巢里像是家庭聚会一样,打打闹闹、忙忙碌碌的,真是热闹得很。
看着它们来来往往,心里不禁想,哎,生活就该这么有趣,和谐又充实。
说到蜂巢,大家一定会想到蜂蜜。
可别小看这小小的瓶子,里面藏着的是蜜蜂们的辛勤劳动。
每一滴蜂蜜背后都是蜜蜂们在花丛中嗡嗡作响的身影,那场面可热闹了。
它们在花朵间飞来飞去,像是在参加一场盛大的舞会,欢快得不行。
你瞧,蜜蜂们用自己的辛劳换来了我们舌尖上的美味,这种自然的恩赐真是让人感动。
吃上一勺蜂蜜,甜蜜的味道瞬间溢满口腔,简直比糖还要美味,像是甜蜜的幸福感直达心底。
除了美味,蜂巢的结构在生活中还有很多妙用。
比如说,蜂巢的六边形设计被许多建筑师和工程师拿来作为灵感。
他们发现这种结构不仅坚固,而且在材料的使用上也非常节约。
这就好比我们家里要装修,能省钱又耐用的方案肯定是最受欢迎的。
人家蜜蜂可真是给我们上了一堂生动的建筑课,难怪大家都在模仿它们的设计,嘿嘿。
蜂巢的蜡质材料也是个宝贝。
这个蜡不仅能用来制作蜡烛,还能用于护肤品。
想想看,涂上蜂蜡的护肤品,感觉像是给肌肤穿上了一层保护衣。
冬天干燥的时候,特别能感受到它的神奇。
这种从自然中提取的材料,既环保又健康,真是让人爱不释手。
蜡烛燃烧时散发出的香味,总让人觉得心里暖暖的,心情瞬间愉悦,仿佛回到了家里,温馨又舒适。
再说说蜂巢对生态的贡献,真是无可替代。
蜜蜂在采蜜的过程中,不仅自己快乐,还帮忙授粉。
你想,缺了蜜蜂,咱们的水果和蔬菜可就得减少大半了。
那些色彩斑斓的花儿也是因为蜜蜂的辛勤付出,才能在阳光下灿烂绽放。
就好比我们的生活,互相帮助才能过得更美好,没了蜜蜂,真是如鱼无水,寸步难行。
蜂巢结构在建筑中的应用
蜂巢结构在建筑中的应用
蜂巢结构是一种常见的建筑结构,它的形状和名字来自于蜂巢的
形状。
在建筑中,蜂巢结构通常用于建造大型建筑物,例如桥梁、地
铁站、体育馆等公共设施。
蜂巢结构的优点在于它具有很高的强度和稳定性。
它由许多小型
单元组成,这些单元相互连接,形成一个整体。
这种连接方式使得蜂
巢结构能够承受很高的压力和荷载,而且具有很好的抗震性。
此外,蜂巢结构还具有很高的灵活性和适应性。
因为它的单元可
以根据需要灵活调整大小和形状,因此可以适应各种建筑需求。
另外,蜂巢结构还可以减少材料的使用量,从而减少了建筑的成本。
总的来说,蜂巢结构在建筑中是一种非常常用的结构形式。
它具
有很多优点,可以提高建筑的强度、稳定性和适应性,同时也可以降
低建筑的成本。
建筑设计与城市规划中的蜂巢结构研究
建筑设计与城市规划中的蜂巢结构研究摘要:近年来,蜂巢结构在建筑设计和城市规划领域中的应用越来越广泛。
在建筑设计方面,由于蜂巢结构的高度稳定性和可扩展性,它被广泛应用于高层建筑和大型建筑中。
在城市规划方面,蜂巢结构被用于设计城市中的公共空间。
本文通过对蜂巢结构的研究,可以为建筑设计和城市规划提供参考和启示。
关键词:建筑设计;城市规划;蜂巢结构前言蜂巢结构具有良好的力学性能和空间美学效果,在建筑设计和城市规划中有广泛的应用前景。
随着科技的不断进步和数字化技术的广泛应用,蜂巢结构的设计和制造水平将会不断提高,其应用范围和实现方式也将会更加丰富多样。
未来,蜂巢结构将会成为建筑设计和城市规划中不可或缺的一种元素,为人们提供更加美观、高效、可持续的建筑和城市空间。
一、蜂巢结构的概念与特点(一)蜂巢结构的定义蜂巢结构,又称为六面体结构,是一种类似于蜂窝的结构体系。
它由许多六边形或正方形的小单元构成,这些小单元之间相互连接形成了整个结构。
其是一种被广泛应用于建筑设计和城市规划领域的空间结构形式,能够形成一种高度稳定的结构形式。
(二)蜂巢结构在建筑设计与城市规划中的应用蜂巢结构在建筑设计与城市规划中有着广泛的应用。
在建筑设计中,蜂巢结构可以用于构建大跨度空间或高层建筑的框架结构,其优异的力学性能可以保证建筑的稳定和安全。
同时,蜂巢结构也可以应用于地下空间的建设,如地下车库等。
在城市规划中,蜂巢结构可以用于城市空间的规划布局。
将城市空间划分为许多小区块,每个小区块都采用蜂巢结构作为建筑结构,可以提高城市空间利用率,并降低建筑物间的遮挡冲突,同时也能增加城市景观的多样性和美观度。
(三)蜂巢结构的特点与优势蜂巢结构具有强度高、刚度大、重量轻以及能源消耗低的特点与优势。
蜂巢结构是由许多小单元构成的,这些小单元之间的连接是相互的,能够分散荷载和应力,使得整个结构具有较高的强度和稳定性。
蜂巢结构具有极高的刚度,能够抵御大风或地震等自然灾害的影响。
- 1、下载文档前请自行甄别文档内容的完整性,平台不提供额外的编辑、内容补充、找答案等附加服务。
- 2、"仅部分预览"的文档,不可在线预览部分如存在完整性等问题,可反馈申请退款(可完整预览的文档不适用该条件!)。
- 3、如文档侵犯您的权益,请联系客服反馈,我们会尽快为您处理(人工客服工作时间:9:00-18:30)。
J I A N G S U U N I V E R S I T Y蜂巢结构仿生研究与应用学院名称:京江学院专业班级:J高分子1101学生姓名:胡文文学号:41211260 16指导老师:吴平2005年12月Estimation of human-hemoglobin using honeycomb structure:An application of photonic crystalabstractThis paper proposes a method to estimate the hemoglobin concentration in human blood using 2D honeycomb photonic crystal structure. Though a few works deal with similar kind of investigation, presentresearch delivers an accurate estimation of hemoglobin as compared to previous works. The principleof investigation is based on linear variation of both photonic band gap and absorbance’s with respectto different concentration of hemoglobin in human blood. Aside these variations, energy transmittedthrough honeycomb photonic crystal structure is also varied linearly with respect to same concentration.In this work, photonic band gap of honeycomb structure is found using plane wave expansion method,whereas absorbance of same structure is computed by employing Maxwell Curl equation. Finally, simulation result revealed that transmitted energy through two dimensional honeycomb photonic crystalstructure containing blood is nicely fitted with linear trend line (R2 = 1) which lead to an accurate investigation of hemoglobin in human blood. At last, this paper proposes an experimental set up to measurethe said concentrations with the help of an Arduino developmentboard(Uno)containingAtmega320microcontroller.Keywords:Honeycomb photonic crystal structurePhotonic band gapTransmitted energ1.IntroductionPhotonics crystals are made, artificially created materials inwhich refractive index is periodically modulated in a scale comparable to the scale of the wavelength. Though the concept ofphotonic crystal has originated in the year 1857 by Lord Rayleigh,the research work in the field of photonic crystals is realized afteralmost 100 years, when Yablonovitch and John published twomilestone papers on photonic crystals in 1987 [1–3], since then,photonics have been progressing hastily and showing a remarkableresearch in the field of science andtechnology. As far as, application of photonic-devices are concerned, photonic crystal play animportant role to envisage various application in modern technology [4–6]. Though photonic crystal is used for different application,sensing application is one of the major relevance in photonics. As faras literature surveys on sensing application using photonic crystalstructure is concerned, recently few papers deal with similar typeof research [7–13]. Considering a brief remark on above references,it is seen that reference [7] presents a novel method to find out theconcentration of sugar, salt, and alcohol in their aqueous solution.In this case, the author used 2D photonic crystal structure with11 ×11 air holes.Also using same technique, concentration of PAMhydrogel and strength of Cygel is investigated in Refs. [8,9], respectively. Also in Refs. [10,11], the concentration of potassium chloridein their aqueous and intrallipid in human blood is estimated usingphotonic crystal fiber. Apart from these, measurement of glycerolin B–H–G solution and concentration of hemoglobin in humanblood is investigated using 3D photonic crystal structure in Refs.[12,13], respectively. Though Ref. [13] measures the concentrationof hemoglobin in human blood using 3D photonic crystal structure,it is hard to fabricate 3D owing to photonic crystal structure. We inthis paper investigate the concentration of hemoglobin in humanblood using 2D honeycomb photonic crystal structure. The reasonfor choosing such structure is that it can be easily fabricated; secondly, these structures predict accurate result as compared to 3Dphotonic crystal structure, which is carried out in Ref. [13]. Hemoglobin is a main component of the blood, which isimportant for transportation of oxygen in blood, which leadsto circulation of blood in vein. This circulation of human bloodsystem has default functions, such as supply of oxygen to tissues, supply of nutrients such as glucose, amino acids, and fattyacids, removal of waste such as carbon dioxide, urea, lactic acid,immunological functions, including circulation of white cells, anddetection of foreign materials by antibodies, coagulation, messenger functions, regulation of body PH, regulation oh core bodytemperature hydraulic function etc. for normal human body. Adeficiency of hemoglobin in human blood creates serious problemsuch as downstream tissuedysfunction, Leukemia, iron deficiency,anemia, multiple myeloma, etc. [14–17].Keeping the importanceof hemoglobin in human blood, this paper estimates the concentration of hemoglobin in both oxygenated and deoxygenatedblood.This paper is organized as follows: Section 2 presents the structure of the honeycomb photonic crystal structure including theprinciple of measurement. Simulation and interpretation ismade in Section 3. Section 4 proposes an experimental set up andfinally conclusions are drawn in Section 5.2.Honeycomb structure and principle of measurementAs far as measurement of hemoglobin in human blood is concerned, we use 2D honeycomb photonic crystal structure for thesame, which is shown in Fig. 1.Fig. 1 represents honeycomb photonic crystal structure having gallium Arsenide as background material containing air holes,where bloods with different percentage (g/L) of hemoglobin areinfiltrated. The proposed structure consists of 9 numbers of air holessuch that diameter of air holes is 420 nm and lattice spacing of thestructure is 1 1m. The principle of measurement is based on linear variation of reflected energy and absorbance with respect toconcentration of hemoglobin in human blood. When light havingwavelength of 589 nm incident on honeycomb structure containingblood with different percentage of hemoglobin then, some amountof light will get reflect and some amount of light will be absorbed bythe structure. The rest amount of light willbe transmitted throughthe structure. Since the principle is based on linear variation of both reflected and absorbance, intensity transmitted through honeycomb structure also varies linearly with respect to hemoglobinconcentration in the blood which is a key factor (linear variation)to realize accurate investigation of hemoglobin in human blood.We use simple mathematical equation to find out the reflectedenergy, absorbance and transmitted energy for investigation ofhemoglobin. As far as, energy reflected from honeycomb structure is concerned, it is obtained from dispersion diagram, whichis carried out by employing plane wave expansion method [18] In this case, we computed normalized frequency (a/1) fromdispersion diagram, then the values of reflected energy (ER) is calculated using following simple equation: ER=hc/1R,where 1R is reflected wavelength, which is found from dispersiondiagram.Since, wavelength 589 nm is used to investigate hemoglobinconcentration; the energy of incident light (EI) corresponding tothis wavelength is found using following expression.EI (2)where is the incident wavelength (589 nm)Using (1) and (2), the energy transmitted through the structureis written asET = E0 −ER (3)Eq. (3) represents as transmitted energy without considerationof absorption loss. However, from literature it is found that GaAsstructure and blood with different concentration of hemoglobinabsorb some light of wavelength, 589 nm. So, absorption loss shouldbe cogitated during this investigation. Using Ref. [19] and employing Maxwell curl equation, Eq. (3) is modified asET (4)From the above equation, it is seen that absorption loss takesplace due to two factors, such as absorption loss due to backgroundmaterialand absorption loss due to blood .Where is called the absorption coefficient of gallium arsenidematerial and ‘t’ is the thickness of background or substrate.ˇ is called the absorption coefficient of blood at wavelength589 nm, which is expressed where is called the extinction coefficient of blood at wavelength589 nm and ‘C’ is the concentration of hemoglobin in human bloodand ‘d’ is the diameter of air holes, where blood samples are ing the above equation, output energy through 2D honeycomb photonic crystal structure is obtained corresponding to eachconcentration of hemoglobin in human blood sample.3.Result and interpretationFrom previous section, it is seen that output energy through thephotonic crystal structure corresponding to each concentration isa function of both reflected energy from the structure and energyabsorbed by the structure. As both reflection energy and absorption loss are important to obtain transmitted energy, we divide thissection into three sub-sections such that first sub-section discussesreflected energy, second sub-section analyses absorption loss andthen transmitted energy is given in third subsection.3.1. Reflected energyWe use dispersion diagram to compute the energy reflectedfrom honeycomb photonic crystal structure. Dispersion diagram isa graph between normalized frequency (a/1) with wave vector (k),which gives an idea about the photonic band gap or reflected energyfrom same structure. So before going to compute reflected energy,we focus on dispersion diagram of 2D photonic honeycomb structure containing human blood sample with different percentageof hemoglobin. The dispersion relation (relation between normalized frequency and wave vector) depends on structure parameterssuch diameter of holes, lattice spacing, refractive indices of bothbackground and blood sample including the configuration of thestructureIn this case, we consider honeycomb structure whose latticespacing is 1 1m and diameter of air holes is 420 nm. Using theabove parameters and employing plane wave expansion method,simulation is made to obtain the dispersion graph of 2D honeycomb photonic crystal structure. Though, we have made simulationfor all concentration of hemoglobin from 0 g/L to 120/g/L of oxygenated and deoxygenated, simulation result for 0 g/L and 120 g/Lof oxygenated blood is shown in Fig. 2(a) and (b), respectively.Fig. 2(a) and (b) represent the dispersion diagram of 2D honeycomb photonic crystal structure containing human blood withhemoglobin concentration of 0 g/L and 120 g/L respectively. In thesefigures, normalized frequency (a/1) is taken along vertical axisand wave vector (k) in m−−1 is taken along horizontal axis. Fromthese graphs, it is realized that electromagnetic wave at certainwavelength range cannot be propagated through the said photonic crystal structure, which refers as forbidden gap. It is alsoseen that red color band is represented as complete forbidden gap.From this graph, norm alized frequency corresponding to ‘0’ and‘120’ concentration of human blood is found, and then photonicbandgap corresponding to each normalizedfrequency is computed.Though simulation result for 0 g/L and 120 g/L concentrations areshown here, simulation for other concentration of oxygenated anddeoxygenated blood are done but are not shown here. The photonic band gap corresponding to each normalized frequency ofoxygenated and de-oxygenated blood is investigated. The photonic band gap of said photonic crystal structure is nothing but thereflected energy (ER) from 2D honeycomb photonic crystal structure containing both oxygenated and de-oxygenated solution withdifferent concentration of hemoglobin. After computing reflectedenergy corresponding to each concentration of hemoglobin, wemoved to calculate absorption loss by said structure which is discussed in the next subsection.3.2. Absorption lossFrom Section 2, it is clear that absorption depends on bothstructure (background) of photonic crystal structure and humanblood with different concentration of hemoglobin. Since, the background material is fixed for measurement of all concentrationof hemoglobin, absorption due to background material (e−˛t) issame for all concentration. However, absorbance due to blood isdiffered for different concentration of hemoglobin because theabsorbance coefficient (ˇ = εc) depends on the concentration (c),so that absorbance due to hemoglobin concentration will be eThen the resultant absorbance is eThe value ofand ˇis obtained from the literature [20]. By putting the value of and d in Eq. (5), we compute the resultant absorbance with respectto concentration of hemoglobin of oxygenated and de-oxygenatedhuman blood. After computing both reflectance and absorbance,we compute the transmitted energy through the photonic crystalstructure, which is discussed in the next session.3.3. Transmitted energyBefore going to discuss transmitted energy emerging from thephotonic crystal structure, we propose an experimental setup bywhich one can measure the energy emerging from honeycombphotonic crystal structure. The setup is shown in Fig. 3. Fig. 3 represents a proposed experimental setup to estimatethe concentration of hemoglobin in both oxygenated and deoxygenated blood. From this figure, it is seen that light havingwavelength of 589 nm incidents on 2D honeycomb photonic crystal structure, then some amount of light will be reflected and somegets absorbed by it and rest mount of light reaches at photo detectorand finally potential corresponding to such output light is collected at an Arduino development board (UNO) with an LCD display.Here, Arduino UNO is a development board containing Atmega 320with an LCD interfaced which is used to display both potentialcoming from photo detector corresponding to the concentrationof hemoglobin in human blood. Since, reflected energy as well asabsorbance is different for different concentration of hemoglobin,transmitted energy as well as potential corresponding to transmitted energy is differed from different concentration. Since, thispaper emphasizes on simulation work, the transmitted energy iscomputed using Eq. (4). After calculating the transmitted energy,a graph is plotted between transmitted energy with respect to different percentages of hemoglobin which is shown in Fig. 4.ent percentages of hemoglobin which is shown in Fig. 4.Fig. 4 provides the information regarding the variation of transmitting energy emerging from 2D honeycomb photonic crystalstructure with respect to concentration of hemoglobin in oxygenated and de-oxygenated blood. From Fig. 4, it is seen thatthe concentration of hemoglobin(g/L) is taken along primaryx-axis, where transmitting energy in eV for oxygenated and deoxygenated blood sample is taken along primary and secondary y-axisrespectively. From above graph, it is observed that the transmittedenergy decreases linearly with respect to hemoglobin concentration, which varies from 0 g/L to 120 g/L for both oxygenated andde-oxygenated blood. For example, transmitted energy decreasesfrom 0.460 eV to 0.4596 eV for oxygenated and 0.460eV to0.4434 eV for de-oxygenated blood with respect to hemoglobinestimation of hemoglobin. The simulation for reflected energy ismade by employing the plane wave expansion method, whereabsorption loss is computed using Maxwell equation. An experimental setup is also proposed to obtain hemoglobin in human bloodsample. Simulation result revealed that transmitted energy varieslinearly and also these variationsare an excellently fitted withlinear shift, which gives an accurate investigation of hemoglobin inboth oxygenated and de-oxygenated human blood sample. Finally,Ardunio UNO divulged the concentration of human hemoglobinwith potential emerging from photonic crystal structure.4.ConclusionEstimation of hemoglobin in oxygenated and de-oxygenatedhuman blood sample is thoroughly investigated in this paper.Both absorption and reflection losses arecogitated during theestimation of hemoglobin. The simulation for reflected energy is made by employing the plane wave expansion method, whereabsorption loss is computed using Maxwell equation. An experimental setup is also proposed to obtain hemoglobin in human bloodsample. Simulation result revealed that transmitted energy varieslinearly and also these variationsare an excellently fitted withlinear shift, which gives an accurate investigation of hemoglobin inboth oxygenated and de-oxygenated human blood sample. Finally,Ardunio UNO divulged the concentration of human hemoglobinwith potential emerging from photonic crystal structure.References[1] J.W.S. Rayleigh, On the remarkable phenomenon of crystalline reflexion described by Prof. Stokes, Philos. Mag. 26 (1988) 256–265.[2] E. Yablonovitch, Inhibited spontaneous emission in solid-state physics and electronics, Phys. Rev. Lett. 58 (1987) 2059–2062.[3] S. John, Strong localization of photons in certain disordered dielectric superlattices, Phys. Rev. Lett. 58 (1987) 2486–2489.[4] M.D. Turner, M. Saba, Q. Zhang, B.P. Cumming, G.E. Schröder-Turk, M. Gu, Miniature chiral beamsplitter based on gyroid photonic crystals, Nat. Photonics 7 (2013) 801.[5] J.D. Joannopoulos, S.G. Johnson, J.N. Winn, R.D. Meade, Photonic Crystals: Molding the Flow of Light, second ed., Princeton University Press, Princeton, NJ, 2008.[6] K.V. Pravdin, I.Yu. Popov, Photonic crystal with negative index material layers,Nanosyst.: Phys. Chem. Math. 5 (2014) 626–643.[7] G. Palai, S.K. Tripathy, A novel method for measurement of concentrationusing two dimensional photonic crystal structures, Opt. Commun. 285 (2012)2765–2768.[8] G. Palai, S.K. Tripathy, T. Sahu, A novel technique to measure the sucrose concentration in hydrogel sucrose solution using two dimensional photonic crystalstructures, Optik 125 (2014) 349–352.[9] G. Palai, S.K. Tripathy, N. Muduli, S.K. Patnaik, D. Patnaik, A novel method tomeasure the strength of CygelTM by using two dimensional photonic crystal structures, AIP Conf. Proc. (2012) 383–386.[10] G. Palai, N. Muduli, S.K. Sahoo, S.K. Tripathy, S.K. Patnaik, Realization of potassium chloride sensor using photonic crystal fiber, Soft Nanosci. Lett. 3 (2013)16–19.[11] G. Palai, P.K. Dalai, A. Kumar, A. Satpathy, J.K. Kushwaha, A. Jha, A. Panda, Optimization of microstructure optical fiber using PWE method forinvestigation ofglucose in intralipid, J. Laser Opt. Photonics 2 (2015) 117–120, Engineering. [12] G. Palai, S.K. Tripathy, Measurement of glycerol concentration inB–H–G solution using 3D photonic crystal structure, Optik 125 (2014)2875–2879.[13] G. Palai, T.K. Dhir, Theoretical model to measure the concentration ofhemoglobin in human blood using 3D photonic crystal structure, Optik 126(2015) 478–482.[14] C.M. Hoff, Importance of hemoglobin concentration and its modification forthe outcome of head and neck cancer patients treated with radiotherapy, ActaOncol.51 (2012) 419–432.[15] School of Chemistry—Bristol University, Hemoglobin, School of Q5Chemistry—Bristol University, UK, 2009, Web. 12 Oct.[16] School of Chemistry—Bristol University, Hemoglobin, School of Chemistry—Bristol University, UK, 2009, Web. 12 Oct.[17] D. V oet, Fundamentals of Biochemistry, Fig. 07 06, third ed., John Wiley & Sons, Q62008.[18] I.A. Sukhoivanov, I.V. Guryev, Physics and Practical Modeling: Photonic Crystals,Springer, Heidelberg, 2009.[19] M. Vijaya, G. Rangarajan, Materials Science, Tata McGraw-Hill Education, NewDelhi, 2003.[20] W.B. Gratzer, Med. Res. Council Labs, Holly Hill, London, N. Kollias, Wellman Laboratories, Harvard Medical School.。