Particle Detector R&D
XRF分析指导课件

Introduction to XRFX 射 线 荧 光 分 析导论Introduction to XRF电子波谱1014Hz - 1015Hz 1Hz - 1kHz 超低频率 电磁波 无线电波 1kHz - 1014Hz 微波 1015Hz - 1021Hz红外线可见光紫外线 X射线伽马射线Low energyHigh energyIntroduction to XRFTheory入射X射线轰击原子的内层电子,如 果能量大于它的吸收边,该内层电子 被驱逐出整个原子(整个原子处于高 能态,即激发态)。
较高能级的电子跃迁、补充空穴,整 个原子处于低能态,即基态。
由高能态转化为低能态,释放能量。
ΔE=Eh-El .能量将以X射线的释放,产生X射线荧 光。
Introduction to XRFThe Hardware• • • • Sources Optics Filters & Targets DetectorsIntroduction to XRFSources•End Window X-Ray Tubes •Side Window X-Ray Tubes •Radioisotopes •Other Sources–Scanning Electron Microscopes –Synchrotrons –Positron and other particle beamsIntroduction to XRFEnd Window X-Ray Tube• X-ray Tubes– Voltage determines which elements can be excited. – More power = lower detection limits – Anode selection determines optimal source excitation (application specific).Introduction to XRFSide Window X-Ray TubeBe Window Glass EnvelopeTarget (Ti, Ag, Rh, etc.)HV LeadElectron beamCopper Anode FilamentSilicone InsulationIntroduction to XRFRadioisotopesIsotope Energy (keV) Elements (Klines) Elements (Llines) Fe-55 5.9 Al – V Br-I Cm-244 14.3, 18.3 Ti-Br I- Pb Cd-109 22, 88 Fe-Mo Yb-Pu Am-241 59.5 Ru-Er None Co-57 122 Ba - U noneWhile isotopes have fallen out of favor they are still useful for many gauging applications.Introduction to XRFOther SourcesSeveral other radiation sources are capable of exciting material to produce x-ray fluorescence suitable for material analysis.Scanning Electron Microscopes (SEM) – Electron beams excite the sample and produce x-rays. Many SEM’s are equipped with an EDX detector for performing elemental analysis Synchotrons - These bright light sources are suitable for research and very sophisticated XRF analysis. Positrons and other Particle Beams – All high energy particles beams ionize materials such that they give off x-rays. PIXE is the most common particle beam technique after SEM.Introduction to XRFSource ModifiersSeveral Devices are used to modify the shape or intensity of the source spectrum or the beam shape Source Filters Secondary Targets Polarizing Targets Collimators Focusing OpticsIntroduction to XRFSource FiltersFilters perform one of two functions–Background Reduction –Improved FluorescenceSource Filter Detector X-Ray SourceIntroduction to XRFFilter Transmission CurveTitanium Filter transmission curve% T R A N S M I T T E DAbsorption EdgeLow energy x-rays are absorbed Very high energy x-rays are transmittedX-rays above the absorption edge energy are absorbed ENERGYTiCrThe transmission curve shows the parts of the source spectrum are transmitted and those that are absorbedIntroduction to XRFFilter Fluorescence MethodWith Zn Source filter Target peakContinuum RadiationENERGY (keV)Fe RegionThe filter fluorescence method decreases the background and improves the fluorescence yield without requiring huge amounts of extra power.Introduction to XRFFilter Absorption MethodTarget peak With Ti Source filter Continuum RadiationENERGY (keV)Fe RegionThe filter absorption Method decreases the background while maintaining similar excitation efficiency.Introduction to XRFSecondary TargetsImproved Fluorescence and lower background The characteristic fluorescence of the custom line source is used to excite the sample, with the lowest possible background intensity. It requires almost 100x the flux of filter methods but gives superior results.Introduction to XRFSecondary TargetsSample Detector X-Ray Tube Secondary Target A. The x-ray tube excites the secondary target B. The Secondary target fluoresces and excites the sample C. The detector detects x-rays from the sampleIntroduction to XRFSecondary Target MethodWith Zn Secondary Target Tube Target peakContinuum RadiationENERGY (keV)Fe RegionSecondary Targets produce a more monochromatic source peak with lower background than with filtersIntroduction to XRFSecondary Target Vs FilterComparison of optimized direct-filtered excitation with secondary target excitation for minor elements in Ni-200Introduction to XRFPolarizing Target Theorya) X-ray are partially polarized whenever they scatter off a surface b) If the sample and polarizer are oriented perpendicular to each other and the x-ray tube is not perpendicular to the target, x-rays from the tube will not reach the detector. c) There are three type of Polarization Targets:– – Barkla Scattering Targets - They scatter all source energies to reduce background at the detector. Secondary Targets - They fluoresce while scattering the source x-rays and perform similarly to other secondary targets. Diffractive Targets - They are designed to scatter specific energies more efficiently in order to produce a stronger peak at that energy.–Introduction to XRFCollimatorsCollimators are usually circular or a slit and restrict the size or shape of the source beam for exciting small areas in either EDXRF or uXRF instruments. They may rely on internal Bragg reflection for improved efficiency.SampleTubeCollimator sizes range from 12 microns to several mmIntroduction to XRFFocusing OpticsBecause simple collimation blocks unwanted x-rays it is a highly inefficient method. Focusing optics like polycapillary devices and other Kumakhov lens devices were developed so that the beam could be redirected and focused on a small spot. Less than 75 um spot sizes are regularly achieved.Bragg reflection inside a CapillarySourceDetectorIntroduction to XRFDetectors• Si(Li) • PIN Diode • Silicon Drift Detectors • Proportional Counters • Scintillation DetectorsIntroduction to XRFDetector PrinciplesA detector is composed of a non-conducting or semi-conducting material between two charged electrodes. X-ray radiation ionizes the detector material causing it to become conductive, momentarily. The newly freed electrons are accelerated toward the detector anode to produce an output pulse. In ionized semiconductor produces electron-hole pairs, the number of pairs produced is proportional to the X-ray photon energyn = E ew h e re :n E e= n u m b e r o f e le c tro n -h o le p a irs p ro d u c e d = X -ra y p h o to n e n e rg y = 3 .8 e v fo r S i a t L N 2 te m p e r a tu re sIntroduction to XRFSi(Li) DetectorWindow FETSuper-Cooled CryostatSi(Li) crystalPre-AmplifierDewar filled with LN2Cooling: LN2 or Peltier Window: Beryllium or Polymer Counts Rates: 3,000 – 50,000 cps Resolution: 120-170 eV at Mn K-alphaIntroduction to XRFSi(Li) Cross SectionIntroduction to XRFPIN Diode DetectorCooling: Thermoelectrically cooled (Peltier) Window: Beryllium Count Rates: 3,000 – 20,000 cps Resolution: 170-240 eV at Mn k-alphaIntroduction to XRFSilicon Drift Detector- SDDPackaging: Similar to PIN Detector Cooling: Peltier Count Rates; 10,000 – 300,000 cps Resolution: 140-180 eV at Mn K-alphaIntroduction to XRFProportional CounterWindowAnode FilamentFill Gases: Neon, Argon, Xenon, Krypton Pressure: 0.5- 2 ATM Windows: Be or Polymer Sealed or Gas Flow Versions Count Rates EDX: 10,000-40,000 cps WDX: 1,000,000+ Resolution: 500-1000+ eVIntroduction to XRFScintillation DetectorPMT (Photo-multiplier tube) Sodium Iodide Disk ElectronicsWindow: Be or Al Count Rates: 10,000 to 1,000,000+ cps Resolution: >1000 eVConnectorIntroduction to XRFSpectral Comparison - AuSi(Li) Detector 10 vs. 14 KaratSi PIN Diode Detector 10 vs. 14 KaratIntroduction to XRFPolymer Detector Windows♦ Optional thin polymer windows compared to a standard beryllium windows ♦ Affords 10x improvement in the MDL for sodium (Na)Introduction to XRFDetector FiltersFilters are positioned between the sample and detector in some EDXRF and NDXRF systems to filter out unwanted x-ray peaks. Sample Detector Filter Detector X-Ray SourceIntroduction to XRFDetector Filter TransmissionNiobium Filter Transmission and Absorption% T R A N S M I T T E DEOI is transmittedLow energy x-rays are absorbedAbsorption EdgeVery high energy x-rays are transmittedX-rays above the absorption edge energy are absorbed ENERGYSClA niobium filter absorbs Cl and other higher energy source x-rays while letting S x-rays pass. A detector filter can significantly improve detection limits.Introduction to XRFFilter Vs. No FilterDetector filters can dramatically improve the element of interest intensity, while decreasing the background, but requires 4-10 times more source flux. They are best used with large area detectors that normally do not require much power.Unfiltered Tube target, Cl, and Ar Interference PeakIntroduction to XRFRoss Vs. Hull FiltersThe previous slide was an example of the Hull or simple filter method. The Ross method illustrated here for Cl analysis uses intensities through two filters, one transmitting, one absorbing, and the difference is correlated to concentration. This is an NDXRF method since detector resolution is not important.Introduction to XRFWavelength Dispersive XRFWavelength Dispersive XRF relies on a diffractive device such as crystal or multilayer to isolate a peak, since the diffracted wavelength is much more intense than other wavelengths that scatter of the device.Sample DetectorCollimatorsX-Ray SourceDiffraction DeviceIntroduction to XRFDiffractionThe two most common diffraction devices used in WDX instruments are the crystal and multilayer. Both work according to the following formula.nλ = 2d × sinθn = integer d = crystal lattice or multilayer spacing θ = The incident angle λ = wavelengthAtomsIntroduction to XRFMultilayersWhile the crystal spacing is based on the natural atomic spacing at a given orientation the multilayer uses a series of thin film layers of dissimilar elements to do the same thing. Modern multilayers are more efficient than crystals and can be optimized for specific elements. Often used for low Z elements.Introduction to XRFSoller CollimatorsSoller and similar types of collimators are used to prevent beam divergence. The are used in WDXRF to restrict the angles that are allowed to strike the diffraction device, thus improving the effective resolution.SampleCrystalIntroduction to XRFCooling and Temperature ControlMany WDXRF Instruments use:•X-Ray Tube Coolers, and •Thermostatically controlled instrument coolersThe diffraction technique is relatively inefficient and WDX detectors can operate at much higher count rates, so WDX Instruments are typically operated at much higher power than direct excitation EDXRF systems. Diffraction devices are also temperature sensitive.Introduction to XRFChamber AtmosphereSample and hardware chambers of any XRF instrument may be filled with air, but because air absorbs low energy x-rays from elements particularly below Ca, Z=20, and Argon sometimes interferes with measurements purges are often used. The two most common purge methods are:Vacuum - For use with solids or pressed pellets Helium - For use with liquids or powdered materialsIntroduction to XRFChangers and SpinnersOther commonly available sample handling features are sample changers or spinners.Automatic sample changers are usually of the circular or XYZ stage variety and may have hold 6 to 100+ samples Sample Spinners are used to average out surface features and particle size affects possibly over a larger total surface area.Introduction to XRFTypical PIN Detector InstrumentThis configuration is most commonly used in higher end benchtop EDXRF Instruments.Introduction to XRFTypical Si(Li) Detector InstrumentThis has been historically the most common laboratory grade EDXRF configuration.Introduction to XRFEnergy Dispersive ElectronicsFluorescence generates a current in the detector. In a detector intended for energy dispersive XRF, the height of the pulse produced is proportional to the energy of the respective incoming X-ray.Element A Element B Element C Element DSignal to ElectronicsDETECTORIntroduction to XRFMulti-Channel Analyser• • Detector current pulses are translated into counts (counts per second, “CPS”). Pulses are segregated into channels according to energy via the MCA (Multi-Channel Analyser).Intensity (# of CPS per Channel)Signal from DetectorChannels, EnergyIntroduction to XRFWDXRF Pulse ProcessingThe WDX method uses the diffraction device and collimators to obtain good resolution, so The detector does not need to be capable of energy discrimination. This simplifies the pulse processing. It also means that spectral processing is simplified since intensity subtraction is fundamentally an exercise in background subtraction.Note: Some energy discrimination is useful since it allows for rejection of lowenergy noise and pulses from unwanted higher energy x-rays.Introduction to XRFEvaluating SpectraIn addition to elemental peaks, other peaks appear in the spectra:• • • • • •K & L Spectral Peaks Rayleigh Scatter Peaks Compton Scatter Peaks Escape Peaks Sum Peaks BremstrahlungIntroduction to XRFK & L Spectral LinesL beta L alphaK - alpha lines: L shell etransition to fill vacancy in K shell. Most frequent transition, hence most intense peak.K betaK alphaK - beta lines: M shell etransitions to fill vacancy in K shell.K Shell L Shell M Shell N ShellL - alpha lines: M shell etransition to fill vacancy in L shell.L - beta lines: N shell etransition to fill vacancy in L shell.Introduction to XRFK & L Spectral PeaksK-Lines L-linesRh X-ray Tube。
生物小角散射 BioSAXS

sminRg < 1.0 smaxRg < 1.3
Fit quality
Check Find allbest reasonable linear intervals
s2
Radius of gyration (Rg)
Guinier plot
Ln I(s)
s2
Radius of Gyration (Rg)
“Can I use this data for further analysis?”
Log I(s) Log I(s)
Data quality
lysozyme
AGGREGATED!
s, nm-1
s, nm-1
Data range
2.00
1.00
0.67
0.50
0.33
Resolution, nm
Guinier plot
Ln I(s) Ln I(0)
y = ax + b Rg = sqrt(-3a)
s2
Radius of Gyration (Rg)
Guinier plot
Ln I(s)
Rg ±stdev
Ln I(0)
Forward scattering I(0)
Data quality
Data range
BSA
Rg = 3.1 nm I(0) = 11.7 MMBSA = 66 kDa
Rg = 1.46 nm I(0) = 3.66 MM = 20.6 kDa
Rg = 6.81 nm I(0) = 79.45 MM = 448.2 kDa
Porod law
I(s) ~
-4 s
核能英语专业词汇大全
核能核电英语翻译专业词汇放射性气溶胶:Radioactive aerosol放射性气溶胶监测仪:Radioactive aerosol monitor校准系统:Calibration system滤膜:Filter membrane过滤效率:Filtration efficiency内照射剂量:Internal dose气载放射性:Airborne radioactiveα气溶胶:α aerosol人工α放射性核素:artificial alpha-emitter粒径(粒度):Particle size放射性活度浓度:Activity concentration分散法:Dispersion method凝集法(凝集技术):Agglutination test单分散气溶胶:Monodisperse aerosol单分散性:Monodispersity凝结核:Condensation nucleus饱和器:Saturator冷凝管:Condenser光学法:Optical method沉降法:Sedimentation method光散射法:Light scattering method米氏理论:Mie theory光学等效直径:Optical equivalent diameter电离:ionization激发:excitation核辐射探测器:Nuclear radiation detector离子对:Ion pair金硅面垒型探测器:Au-Si surface barrier detector离子注入硅探测器:Ion-implanted semiconductor detector 天然放射性气溶胶:Natural radioactive aerosol符合法:Coincidence method半衰期:half-life延迟符合时间:Delayed coincidence time符合计数:Coincidence counting符合因子:Coincidence factor喷雾器:Sprayer干燥器:Dryer分样器:Sampling spliter混合室:Mixing chamber紊流流态:Turbulent flow标准仪器:Standard instrumentPIPS探测器:Passivated Implanted Planar Silicon detector假符合因子:Pseudocoincidence factorα串道补偿因子:α compensation factor气载放射性:Airborne radioactiveα气溶胶:α aerosol人工α放射性核素:artificial alpha-emitter 粒径(粒度):Particle size放射性活度浓度:Activity concentration 分散法:Dispersion method凝聚法(凝聚技术):Agglutination test单分散气溶胶:Monodisperse aerosol单分散性:Monodispersity凝结核:Condensation nucleus饱和器:Saturator冷凝管:Condenser光学法:Optical method沉降法:Sedimentation method光散射法:Light scattering method电离:ionization激发:excitationβ衰变:β decay半衰期:half-life喷雾器:Sprayer干燥器:Dryer再热器:Reheater癸二酸二异辛酯:Di-2-ethyl hexyl sebacate邻苯二甲酸二辛酯:Di-n-octyl-o-phthalate聚癸烯:1-decene, tetramer mixed with 1-decene, commonly known as Emery 3004空气净化系统:Air purification system凝聚式单分散气溶胶发生实验装置:Condensation type mono-dispersion aerosol generator同相凝结:homogeneous condensation异相凝结:heterogeneous condensaton分散度:dispersion高效粒子空气过滤器:High efficiency particle air filter航空γ谱仪:airborne gamma-ray spectrometry (AGS)航空γ能谱分析:analysis of airborne gamma-ray spectrum介质互换:medium exchange地层模块化:idea of modular stratum特征γ射线能量分区:energy partitioning for characteristic gamma-ray 逆矩阵法:inverse matrix method逐道最小二乘法:one by one channel least square能量色散X荧光分析仪:energy dispersion X-ray fluorescence analyzer 响应谱:response spectrum基体效应校正:matrix effect correction平衡235U&238U系:equilibrium 235U&238U series平衡钍系:equilibrium 232Th series天然放射性:natural radioactivity无限大地层:infinite formation航空γ谱仪响应谱:response spectrum of AGS蒙特卡罗数值模拟方法:Monte Carlo simulation method粒子输运问题:particle transport problem辐射监测:radiation monitoring核反应堆设计:design of nuclear reactor核技术应用:nuclear technology application球壳模型:spherical shell model航空γ探测点:detection point of airborne gamma-ray天然辐射环境:natural radiation environment源抽样粒子数:sampling particle number球壳型探测器:spherical shell detector特征射线能量:characteristic gamma-ray energy模拟谱:simulation spectrum航空γ探测:detection of airborne gamma-ray放射性核素的比活度:activity concentration of radionuclide能量刻度:energy calibration半高宽刻度:full width at half maximum calibration (FWHM calibration)特征射线峰:peak of characteristic gamma-ray半宽度:full width at half maximum (FWHM)峰位:peak position吸收系数:absorption coefficient特征γ射线:characteristic gamma-ray全能峰计数:full energy peak countγ场理论:theory of gamma field宇宙射线:cosmic ray大气氡:atmospheric radon粒子群:particle swarm模拟退火优化:simulated annealing optimization天然放射性核素:natural radionuclide半衰期:half life测线:survey line压水堆:pressurized water reactor(PWR)压水堆燃料棒破损性状分析程序:analysis code for fuel-rod failure character of PWR压水堆燃料棒破损实时探测系统:real-time detection system for fuel-rod failure of PWR安全运行:safety operation燃料棒包壳:fuel cladding放射性物质:radioactive material当量碘:Equivalent iodine核燃料循环:nuclear fuel cycle核脉冲:nuclear pulse能谱数据:spectrum data惰性气体:inert gas燃料芯块:fuel pellet燃料晶粒:fuel grain释放速率:release rate衰变常数:decay constant裂变率:fission rate理想气体常数:perfect gas constant扩散常数:universal gas constant国际原子能机构:international atomic energy agency (IAEA) 燃料棒行为分析程序:analysis code for fuel-rod behavior稳态运行:steady-state operation破口:break周期换料:fuel cycle富集度:enrichment ratio一回路系统:primary system燃料棒破损:fuel rod failure实时探测:real-time detection化学取样方法:chemical sampling method闪烁体探测器:scintillator detector核素:nuclides放射性活度(活度):activity核反应堆:nuclear reactor放射性活度浓度:activity concentration放射性:radioactivity辐射(放射性)剂量:radiation dose裂变产物:fission products一回路冷却剂:primary coolant堆芯:reactor core裂变气体或其子体:fission gases or their decay product γ能谱法:γ spectrum同位素:isotope燃耗:burnup裂变产额(产率):fission yields特征峰:characteristic peak半衰期:half life取样管路:sampling line衰变:decay光电倍增管:photomultiplier tube(PMT)能量分辨率:energy resolution报警阈值:alarm threshold标准源:Standard source压水堆:Pressurized water reactor堆芯:Core燃料元件:Fuel-rod全能峰探测效率:Full-energy peak efficiency校准:Calibration液体标准源:Liquid source自吸收修正:Self-absorption correction放射性核素:Radionuclide燃料元件破损在线探测装置:On-line detection Device for fuel-rod failureLaBr探测器:LaBr detectorγ射线峰:Peak of γ photon符合相加修正:Coincidence correction校准曲线:Calibration curve能量—效率曲线:Energy-efficiency curve不确定度:Uncertainty元件包壳:Fuel cladding核反应堆:Nuclear reactor裂变产物:Fission products一回路冷却剂:Primary coolant放射性活度:Radioactivity量值溯源:Traceability of value活度浓度:Activity concentrationγ谱仪:γ Spectrometerγ光子全能峰面积:Full-energy peak area of the γ photon分支比(发射率):Emission rate符合相加效应:Coincidence summing分辨时间:Resolution time级联γ光子:Cascade γ photon级联效应:Cascade effect取样管路:Sampling line60Co的1332 keVγ峰:1332 keV peak of 60Co有级联辐射的核素:nuclide with cascade radiations符合相加修正系数:Coincidence summing correction coefficient三通阀门:Triple valve反康普顿低本底 谱仪:Low-background Compton-suppressed spectrometer衰减修正:Attenuation correction蒙特卡罗方法(蒙特卡罗模拟):Monte Carlo simulationγ级联衰变:γ cascade decay净计数率:Net count rate死时间:Dead time半衰期:Half life能量分辨率:Energy resolution体源:V olume source单能γ放射性核素:monoenergetic γ-ray emitting radionuclide 多能γ放射性核素:Multi-energy γ-ray emitting radionuclide 级联发射γ光子:γ rays are emitted in cascade发射几率:Emission rate一致性好:Be in good agreement数字符合:Digital coincidence数字符合技术(方法):Digital coincidence counting符合测量装置:Coincidence measurement device高速数据采集卡:High speed acquisition card探测器:Detector死时间修正:Dead time correction符合分辨时间修正:Coincidence resolving time correction效率外推:Efficiency extrapolation标准源:Standard source脉冲堆积:Pulse pile-up假峰:Ghost peak漏计数:Counting lossβ-γ符合测量:β-γ coincidence measurement流气式4π正比计数器:Gas-flow proportional counterβ道:β channel核脉冲信号:Nuclear pulse signal井形NaI(Tl)探测器:Well-type NaI(Tl) detectorP型同轴HPGe探测器:P-type HPGe coaxial detector 延迟时间谱:Delay time spectraγ能量窗:γ energy window阈值:Threshold固定死时间:Fixed dead time扩展死时间:Extended dead time真符合计数率:True coincidence counting rate甄别阈:Discriminating threshold表观效率:Apparent efficiency计数统计:Counting statistics半衰期修正:Half-life correction本底修正:Background correction。
Geant4基础知识

Geant4基础知识 1 Geant4基础知识
G4模拟粒子过程: 成立一次模拟,在 G4 中称为一次Run;Run 成立后,需要对几何构造、物理过程进行初始化;初始化完成后就开始模拟过程了,第一发射一个粒子。在G4 中,发射一个(或一系列)粒子到所有次级粒子死亡的过程成为一次 Event。而每次发射的初始粒子则有粒子发射器进行控制。而在每一个event过程中,粒子与资料反应后会可能生成多个次级粒子,每个粒子都会有一条径 迹,称之为 track;而每一个粒子(初始的或次级的)的径迹又是由很多步组成的,称之为step。
G4模拟的基本算法: A Run Start -> 初始化物理模型/几何模型-> An Event Start -> 调用粒子发射器发射粒子
-> A Track Start -> A Step Start -> A Step End -> Next Step Start -> …… -> All Step End -> A Track End -> Next Track Start -> …… -> All Track End -> An Event End -> Next Event Start -> …… -> All Event End(All Primaries Shot) -> A Run End -> Next Run Start Geant4基础知识 2 -> …… 1) main()中应该包括的内容 Geant4是一个探测器模拟工具, 但它对于某个特定的模拟程序没有固定的main()函数, 用户在成立模拟程序的过程中需要供应自己的main()函数. 一个最基本的main()函数需要包括以下几个方面:
G4RunManager(模拟整个过程) G4VUserDetectorConstruction(定义探测器材料, 几何形状, 矫捷区和读出方案)
史上作者最多的论文

Physics Letters B 688(2010)21–42Contents lists available at ScienceDirectPhysics Letters B/locate/physletbCharged-particle multiplicities in pp interactions at √s =900GeV measuredwith the ATLAS detector at the LHC ✩,✩✩ATLAS Collaborationa r t i c l e i n f o ab s t r ac t Article history:Received 16March 2010Received in revised form 22March 2010Accepted 22March 2010Available online 28March 2010Editor:W.-D.SchlatterKeywords:Charged-particleMultiplicities900GeVATLASLHCMinimum bias The first measurements from proton–proton collisions recorded with the ATLAS detector at the LHC are presented.Data were collected in December 2009using a minimum-bias trigger during collisions at a centre-of-mass energy of 900GeV.The charged-particle multiplicity,its dependence on transverse momentum and pseudorapidity,and the relationship between mean transverse momentum and charged-particle multiplicity are measured for events with at least one charged particle in the kinematic range |η|<2.5and p T >500MeV.The measurements are compared to Monte Carlo models of proton–proton collisions and to results from other experiments at the same centre-of-mass energy.The charged-particle multiplicity per event and unit of pseudorapidity at η=0is measured to be 1.333±0.003(stat.)±0.040(syst.),which is 5–15%higher than the Monte Carlo models predict.2010Published by Elsevier B.V.1.IntroductionInclusive charged-particle distributions have been measured in pp and p ¯pcollisions at a range of different centre-of-mass energies [1–13].Many of these measurements have been used to constrain phenomenological models of soft-hadronic interactions and to predict properties at higher centre-of-mass energies.Most of the previous charged-particle multiplicity measurements were obtained by selecting data with a double-arm coincidence trigger,thus removing large fractions of diffractive events.The data were then further corrected to remove the remaining single-diffractive component.This selection is referred to as non-single-diffractive (NSD).In some cases,designated as inelastic non-diffractive,the residual double-diffractive component was also subtracted.The selection of NSD or inelastic non-diffractive charged-particle spectra involves model-dependent corrections for the diffractive components and for effects of the trigger selection on events with no charged particles within the acceptance of the detector.The measurement presented in this Letter implements a different strategy,which uses a single-arm trigger overlapping with the acceptance of the tracking volume.Results are presented as inclusive-inelastic distributions,with minimal model-dependence,by requiring one charged particle within the acceptance of the measurement.This Letter reports on a measurement of primary charged particles with a momentum component transverse to the beam direction 1p T >500MeV and in the pseudorapidity range |η|<2.5.Primary charged particles are defined as charged particles with a mean lifetime τ>0.3×10⁻¹⁰s directly produced in pp interactions or from subsequent decays of particles with a shorter lifetime.The distributions of tracks reconstructed in the ATLAS inner detector were corrected to obtain the particle-level distributions:1N ev ·d N ch d η,1N ev ·12πp T ·d 2N ch d ηd p T ,1N ev ·d N ev d n ch and p T vs.n ch ,where N ev is the number of events with at least one charged particle inside the selected kinematic range,N ch is the total number of charged particles,n ch is the number of charged particles in an event and p T is the average p T for a given number of charged particles.✩©CERN,for the benefit of the ATLAS Collaboration.✩✩Date submitted:2010-03-16T16:00:52Z.E-mail address:atlas.secretariat@cern.ch.1The ATLAS reference system is a Cartesian right-handed co-ordinate system,with the nominal collision point at the origin.The anti-clockwise beam direction defines the positive z -axis,while the positive x -axis is defined as pointing from the collision point to the centre of the LHC ring and the positive y -axis points upwards.The azimuthal angle φis measured around the beam axis,and the polar angle θis measured with respect to the z -axis.The pseudorapidity is defined as η=−ln tan (θ/2).0370-2693/$–see front matter 2010Published by Elsevier B.V.doi:10.1016/j.physletb.2010.03.06422ATLAS Collaboration/Physics Letters B688(2010)21–42Comparisons are made to previous measurements of charged-particle multiplicities in pp and p¯p collisions at √s=900GeV centre-of-mass energies[1,5]and to Monte Carlo(MC)models.2.The ATLAS detectorThe ATLAS detector[14]at the Large Hadron Collider(LHC)[15]covers almost the whole solid angle around the collision point with layers of tracking detectors,calorimeters and muon chambers.It has been designed to study a wide range of physics topics at LHC energies. For the measurements presented in this Letter,the tracking devices and the trigger system were of particular importance.The ATLAS inner detector has full coverage inφand covers the pseudorapidity range|η|<2.5.It consists of a silicon pixel detector (Pixel),a silicon microstrip detector(SCT)and a transition radiation tracker(TRT).These detectors cover a sensitive radial distance from the interaction point of50.5–150mm,299–560mm and563–1066mm,respectively,and are immersed in a2T axial magneticfield. The inner-detector barrel(end-cap)parts consist of3(2×3)Pixel layers,4(2×9)double-layers of single-sided silicon microstrips with a40mrad stereo angle,and73(2×160)layers of TRT straws.These detectors have position resolutions of typically10,17and130μm for the R–φco-ordinate and,in case of the Pixel and SCT,115and580μm for the second measured co-ordinate.A track from a particle traversing the barrel detector would typically have11silicon hits(3pixel clusters and8strip clusters),and more than30straw hits.The ATLAS detector has a three-level trigger system:Level1(L1),Level2(L2)and Event Filter(EF).For this measurement,the trigger relies on the L1signals from the Beam Pickup Timing devices(BPTX)and the Minimum Bias Trigger Scintillators(MBTS).The BPTX are composed of beam pick-ups attached to the beam pipe±175m from the centre of the ATLAS detector.The MBTS are mounted at each end of the detector in front of the liquid-argon end-cap calorimeter cryostats at z=±3.56m and are segmented into eight sectors in azimuth and two rings in pseudorapidity(2.09<|η|<2.82and2.82<|η|<3.84).Data were collected for this analysis using the MBTS trigger,formed from BPTX and MBTS trigger signals.The MBTS trigger was configured to require one hit above threshold from either side of the detector.The efficiency of this trigger was studied with a separate prescaled L1BPTX trigger,filtered to obtain inelastic interactions by inner detector requirements at L2and EF.3.Monte Carlo simulationLow-p T scattering processes may be described by lowest-order perturbative Quantum Chromodynamics(QCD)two-to-two parton scat-ters,where the divergence of the cross section at p T=0is regulated by phenomenological models.These models include multiple-parton scattering,partonic-matter distributions,scattering between the unresolved protons and colour reconnection[16].The PYTHIA[17]MC event generator implements several of these models.The parameters of these models have been tuned to describe charged-hadron pro-duction and the underlying event in pp and p¯p data at centre-of-mass energies between200GeV and1.96TeV.Samples of ten million MC events were produced for single-diffractive,double-diffractive and non-diffractive processes using the PYTHIA6.4.21generator.A specific set of optimised parameters,the ATLAS MC09PYTHIA tune[18],which employs the MRST LO*parton density functions[19]and the p T-ordered parton shower,is the reference tune throughout this Letter.These parameters were derived by tuning to underlying event and minimum-bias data from Tevatron at630GeV and1.8TeV.The MC samples generated with this tune were used to determine detector acceptances and efficiencies and to correct the data.For the purpose of comparing the present measurement to different phenomenological models describing minimum-bias events,the following additional MC samples were generated:the ATLAS MC09c[18]PYTHIA tune,which is an extension of the ATLAS MC09tune optimising the strength of the colour reconnection to describe the p T distributions as a function of n ch,as measured by CDF in p¯p collisions[3];the Perugia0[20]PYTHIA tune,in which the soft-QCD part is tuned using only minimum-bias data from the Tevatron and CERN p¯p colliders;the DW[21]PYTHIA tune,which uses the virtuality-ordered showers and was derived to describe the CDF Run II underlying event and Drell–Yan data.Finally,the PHOJET generator[22]was used as an alternative model.It describes low-p T physics using the two-component Dual Parton Model[23,24],which includes soft hadronic processes described by Pomeron exchange and semi-hard processes described by perturbative parton scattering.PHOJET relies on PYTHIA for the fragmentation of partons.The versions2used for this study were shown to agree with previous measurements[3,5,6,9].The non-diffractive,single-diffractive and double-diffractive contributions in the generated samples were mixed according to the gen-erator cross sections to fully describe the inelastic scattering.All the events were processed through the ATLAS detector simulation program[25],which is based on Geant4[26].They were then reconstructed and analysed by the same program chain used for the data.Particular attention was devoted to the description in the simulation of the size and position of the collision beam spot and of the detailed detector conditions during data taking.4.Event selectionAll data recorded during the stable LHC running periods between December6and15,2009,in which the inner detector was fully operational and the solenoid magnet was on,were used for this analysis.During this period the beams were colliding head-on in ATLAS.A total of455,593events were collected from colliding proton bunches in which the MBTS trigger recorded one or more counters above threshold on either side.In order to perform an inclusive-inelastic measurement,no further requirements beyond the MBTS trigger and inner detector information were applied in this event selection.The integrated luminosity for thefinal event sample,which is given here for reference only,was estimated using a sample of events with energy deposits in both sides of the forward and end-cap calorimeters. The MC-based efficiency and the PYTHIA default cross section of52.5mb were then used to determine the luminosity of the data sample to be approximately9μb−1,while the maximum instantaneous luminosity was approximately5×1026cm−2s−1.The probability of additional interactions in the same bunch crossing was estimated to be less than0.1%.2PHOJET1.12with PYTHIA6.4.21.ATLAS Collaboration/Physics Letters B688(2010)21–4223parison between data(dots)and minimum-bias ATLAS MC09simulation(histograms)for the average number of Pixel hits(a)and SCT hits(b)per track as a function ofη,and the transverse(c)and longitudinal(d)impact parameter distributions of the reconstructed tracks.The MC distributions in(c)and(d)are normalised to the number of tracks in the data.The inserts in the lower panels show the distributions in logarithmic scale.During this data-taking period,more than96%of the Pixel detector,99%of the SCT and98%of the TRT were operational.Tracks were reconstructed offline within the full acceptance range|η|<2.5of the inner detector[27,28].Track candidates were reconstructed by requiring seven or more silicon hits in total in the Pixel and SCT,and then extrapolated to include measurements in the TRT.Typically, 88%of tracks inside the TRT acceptance(|η|<2)include a TRT extension,which significantly improves the momentum resolution.This Letter reports results for charged particles with p T>500MeV,which are less prone than lower-p T particles to large inefficiencies and their associated systematic uncertainties resulting from interactions with material inside the tracking volume.To reduce the contri-bution from background events and non-primary tracks,as well as to minimise the systematic uncertainties,the following criteria were required:•the presence of a primary vertex[29]reconstructed using at least three tracks,each with:—p T>150MeV,—a transverse distance of closest approach with respect to the beam-spot position|d BS0|<4mm;•at least one track with:—p T>500MeV,—a minimum of one Pixel and six SCT hits,—transverse and longitudinal impact parameters calculated with respect to the event primary vertex|d0|<1.5mm and|z0|·sinθ<1.5mm,respectively.These latter tracks were used to produce the corrected distributions and will be referred to as selected tracks.The multiplicity of selected tracks within an event is denoted by n Sel.In total326,201events were kept after this offline selection,which contained1,863,622 selected tracks.The inner detector performance is illustrated in Fig.1using selected tracks and their MC simulation.The shapes from overlapping Pixel and SCT modules in the forward region and the inefficiency from a small number of disabled Pixel modules in the central region are well modelled by the simulation.The simulated impact-parameter distributions describe the data to better than10%, including their tails as shown in the inserts of Fig.1(c)and(d).The difference between data and MC observed in the central region of the d0distribution is due to small residual misalignments not simulated in the MC,which are found to be unimportant for this analysis.Trigger and vertex-reconstruction efficiencies were parameterized as a function of the number of tracks passing all of the track selection requirements except for the constraints with respect to the primary vertex.Instead,the transverse impact parameter with respect to the beam spot was required to be less than4mm,which is the same requirement as that used in the primary vertex reconstruction preselection.The multiplicity of these tracks in an event is denoted by n BS.Sel24ATLAS Collaboration /Physics Letters B 688(2010)21–425.Background contributionThere are two possible sources of background events that can contaminate the selected sample:cosmic rays and beam-induced back-ground.A limit on the fraction of cosmic-ray events recorded by the L1MBTS trigger during data taking was determined from cosmic-ray studies,the maximum number of proton bunches,and the central trigger processor clock width of 25ns,and was found to be smaller than 10−6.Beam-induced background events can be produced by proton collisions with upstream collimators or with residual particles inside the beam pipe.The L1MBTS trigger was used to select beam-induced background events from un-paired proton bunch-crossings.By ap-plying the analysis selection criteria to these events,an upper limit of 10−4was determined for the fraction of beam-induced background events within the selected sample.The requirement of a reconstructed primary vertex is particularly useful to suppress the beam-induced background.Primary charged-particle multiplicities are measured from selected-track distributions after correcting for the fraction of secondary particles in the sample.The potential background from fake tracks is found to be less than 0.1%from simulation studies.Non-primary tracks are mostly due to hadronic interactions,photon conversions and decays of long-lived particles.Their contribution was estimated using the MC prediction of the shape of the d 0distribution,after normalising to data for tracks within 2mm <|d 0|<10mm,i.e.outside the range used for selecting tracks.The simulation was found to reproduce the tails of the d 0distribution of the data,as shown in Fig.1(c),and the normalisation factor between data and MC was measured to be 1.00±0.02(stat.)±0.05(syst.).The MC was then used to estimate the fraction of secondaries in the selected-track sample to be (2.20±0.05(stat.)±0.11(syst.))%.This fraction is independent of n Sel ,but shows a dependence on p T and a small dependence on η.While the correction for secondaries was applied in bins of p T ,the dependence on ηwas incorporated into the systematic uncertainty.6.Selection efficiencyThe data were corrected to obtain inclusive spectra for charged primary particles satisfying the event-level requirement of at least one primary charged particle within p T >500MeV and |η|<2.5.These corrections include inefficiencies due to trigger selection,vertex and track reconstruction.They also account for effects due to the momentum scale and resolution,and for the residual background from secondary tracks.Trigger efficiency The trigger efficiency was measured from an independent data sample selected using the control trigger introduced in Section 2.This control trigger required more than 6Pixel clusters and 6SCT hits at L2,and one or more reconstructed tracks with p T >200MeV at the EF.The vertex requirement for selected tracks was removed for this study,to avoid correlations between the trigger and vertex-reconstruction efficiencies for L1MBTS triggered events.The trigger efficiency was determined by taking the ratio of events from the control trigger in which the L1MBTS also accepted the event,over the total number of events in the control sample.The result is shown in Fig.2(a)as a function of n BS Sel .The trigger efficiency is nearly 100%everywhere and the requirement of this trigger does not affect the p T and ηtrack distributions of the selected events.Vertex-reconstruction efficiency The vertex-reconstruction efficiency was determined from the data,by taking the ratio of triggered eventswith a reconstructed vertex to the total number of triggered events.It is shown in Fig.2(b)as a function of n BSSel .The efficiency amounts to approximately 67%for the lowest bin and rapidly rises to 100%with higher multiplicities.The dependence of the vertex-reconstructionefficiency on the ηand p T of the selected tracks was studied.The ηdependence was found to be approximately flat for n BS Sel>1and to decrease at larger ηfor events with n BS Sel=1.This dependence was corrected for.No dependence on p T was observed.Track-reconstruction efficiency The track-reconstruction efficiency in each bin of the p T –ηacceptance was determined from MC.The com-parison of the MC and data distributions shown in Fig.1highlights their agreement.The track-reconstruction efficiency was defined as:bin (p T ,η)=N matched rec (p T ,η)N gen (p T ,η),where p T and ηare generated quantities,and N matched rec (p T ,η)and N gen (p T ,η)are the number of reconstructed tracks in a given binmatched to a generated charged particle and the number of generated charged particles in that bin,respectively.The matching between a generated particle and a reconstructed track was done using a cone-matching algorithm in the η–φplane,associating the particle to the track with the smallest R = ( φ)2+( η)2within a cone of radius 0.05.The resulting reconstruction efficiency as a function of p T integrated over ηis shown in Fig.2(c).The drop to ≈70%for p T <600MeV is an artefact of the p T cut at the pattern-recognition level and is discussed in Section 8.The reduced track-reconstruction efficiency in the region |η|>1(Fig.2(d))is mainly due to the presence of more material in this region.These inefficiencies include a 5%loss due to the track selection used in this analysis,approximately half of which is due to the silicon-hit requirements and half to the impact-parameter requirements.7.Correction procedureThe effect of events lost due to the trigger and vertex requirements can be corrected for using an event-by-event weight:w ev n BSSel =1 trig (n BS Sel )·1 vtx (n BS Sel ),where trig (n BS Sel )and vtx (n BS Sel )are the trigger and vertex reconstruction efficiencies discussed in Section 6.The vertex-reconstruction efficiency for events with n BSSel=1includes an η-dependent correction which was derived from the data.ATLAS Collaboration/Physics Letters B688(2010)21–4225Fig.2.Trigger(a)and vertex-reconstruction(b)efficiencies as a function of the variable n BSSel defined in Section4;track-reconstruction efficiency as a function of p T(c)andofη(d).The vertical bars represent the statistical uncertainty,while the shaded areas represent the statistical and systematic uncertainties added in quadrature.The two bottom panels were derived from the PYTHIA ATLAS MC09sample.The p T andηdistributions of selected tracks were corrected on a track-by-track basis using the weight:w trk(p T,η)=1bin(p T,η)·1−f sec(p T)·1−f okr(p T,η),where bin is the track-reconstruction efficiency described in Section6and f sec(p T)is the fraction of secondaries determined as described in Section5.The fraction of selected tracks for which the corresponding primary particles are outside the kinematic range,f okr(p T,η), originates from resolution effects and has been estimated from MC.Bin migrations were found to be due solely to reconstructed track momentum resolution and were corrected by using the resolution function taken from MC.In the case of the distributions versus n ch,a track-level correction was applied by using Bayesian unfolding[30]to correct back to the number of charged particles.A matrix M ch,Sel,which expresses the probability that a multiplicity of selected tracks n Sel is due to n ch particles,was populated using MC and applied to obtain the n ch distribution from the data.The resulting distribution was then used to re-populate the matrix and the correction was re-applied.This procedure was repeated without a regularisation term and converged after four iterations,when the change in the distribution between iterations was found to be less than1%.It should be noted that the matrix cannot correct for events which are lost due to track-reconstruction inefficiency.To correct for these missing events,a correction factor 1/(1−(1− (n ch))n ch)was applied,where (n ch)is the average track-reconstruction efficiency.In the case of the p T versus n ch distribution,each event was weighted by w ev(n BS Sel).For each n Sel a MC-based correction was applied to convert the reconstructed average p T to the average p T of primary charged particles.Then the matrix M ch,Sel was applied as described above.8.Systematic uncertaintiesNumerous detailed studies have been performed to understand possible sources of systematic uncertainties.The main contributions are discussed below.26ATLAS Collaboration/Physics Letters B688(2010)21–42Trigger The trigger selection dependence on the p T andηdistributions of reconstructed tracks was found to beflat within the statistical uncertainties of the data recorded with the control trigger.The statistical uncertainty on this result was taken as a systematic uncertainty of0.1%on the overall trigger efficiency.Since there is no vertex requirement in the data sample used to measure the trigger efficiency,it is not possible to make the same impact-parameter cuts as are made on thefinal selected tracks.Therefore the trigger efficiency was measured using impact-parameter constraints with respect to the primary vertex or the beam spot and compared to that obtained without such a requirement.The differencewas taken as a systematic uncertainty of0.1%for n BSSel 3.The correlation of the MBTS trigger with the control trigger used to select the data sample for the trigger-efficiency determination was studied using the simulation.The resulting systematic uncertainty was found to affect only the case n BSSel=1and amounts to0.2%.Vertex reconstruction The run-to-run variation of the vertex-reconstruction efficiency was found to be within the statistical uncertainty. The contribution of beam-related backgrounds to the sample selected without a vertex requirement was estimated by using non-collidingbunches.It was found to be0.3%for n BSSel =1and smaller than0.1%for higher multiplicities,and was assigned as a systematic uncertainty.This background contribution is larger than that given in Section5,since a reconstructed primary vertex was not required for these events.Track reconstruction and selection Since the track-reconstruction efficiency is determined from MC,the main systematic uncertainty results from the level of disagreement between data and MC.Three different techniques to associate generated particles to reconstructed tracks were studied:a cone-matching algorithm,an eval-uation of the fraction of simulated hits associated to a reconstructed track and an inclusive technique using a correction for secondary particles.A systematic uncertainty of0.5%was assigned from the difference between the cone-matching and the hit-association methods.A detailed comparison of track properties in data and simulation was performed by varying the track-selection criteria.The largest deviations between data and MC were observed by varying the z0·sinθselection requirement,and by varying the constraint on the number of SCT hits.These deviations are generally smaller than1%and rise to3%at the edges of theηrange.The systematic effects of misalignment were studied by smearing simulation samples by the expected residual misalignment and by comparing the performance of two alignment algorithms on tracks reconstructed from the data.Under these conditions the number of reconstructed tracks was measured and the systematic uncertainty on the track reconstruction efficiency due to the residual misalignment was estimated to be less than1%.To test the influence of an imperfect description of the detector material in the simulation,two additional MC samples with approx-imately10%and20%increase in radiation lengths of the material in the Pixel and SCT active volume were used.The impact of excess material in the tracking detectors was studied using the tails of the impact-parameter distribution,the length of tracks,and the change inthe reconstructed K0S mass as a function of the decay radius,the direction and the momentum of the K0S.The MC with nominal materialwas found to describe the data best.The data were found to be consistent with a10%material increase in some regions,whereas the 20%increase was excluded in all cases.The efficiency of matching full tracks to track segments reconstructed in the Pixel detector was also studied.The comparison between data and simulation was found to have good agreement across most of the kinematic range.Some discrepancies found for|η|>1.6were included in the systematic uncertainties.From all these studies a systematic uncertainty on the track reconstruction efficiency of3.7%,5.5%and8%was assigned to the pseudorapidity regions|η|<1.6,1.6<|η|<2.3and|η|>2.3, respectively.The track-reconstruction efficiency shown in Fig.2(c)rises sharply in the region500<p T<600MeV.The observed turn-on curve is produced by the initial pattern recognition step of track reconstruction and its associated p T resolution,which is considerably worse than thefinal p T resolution.The consequence is that some particles which are simulated with p T>500MeV are reconstructed with momenta below the selection requirement.This effect reduces the number of selected tracks.The shape of the threshold was studied in data and simulation and a systematic uncertainty of5%was assigned to thefirst p T bin.In conclusion,an overall relative systematic uncertainty of4.0%was assigned to the track reconstruction efficiency for most of the kinematic range of this measurement,while8.5%and6.9%were assigned to the highest|η|and to the lowest p T bins,respectively.Momentum scale and resolution To obtain corrected distributions of charged particles,the scale and resolution uncertainties in the recon-structed p T andηof the selected tracks have to be taken into account.Whereas the uncertainties for theηmeasurement were found to be negligible,those for the p T measurement are in general more important.The inner detector momentum resolution was taken from MC as a function of p T andη.It was found to vary between1.5%and5%in the range relevant to this analysis.The uncertainty was estimated by comparing with MC samples with a uniform scaling of10%additional material at low p T and with large misalignments at higher p T. Studies of the width of the mass peak for reconstructed K0Scandidates in the data show that these assumptions are conservative.Thereconstructed momentum scale was checked by comparing the measured value of the K0S mass to the MC.The systematic uncertaintiesfrom both the momentum resolution and scale were found to have no significant effect on thefinal results.Fraction of secondaries The fraction of secondaries was determined as discussed in Section5.The associated systematic uncertainty was estimated by varying the range of the impact parameter distribution that was used to normalise the MC,and byfitting separate distribu-tions for weak decays and material interactions.The systematic uncertainty includes a small contribution due to theηdependence of this correction.The total uncertainty is0.1%.Correction procedure Several independent tests were made to assess the model dependence of the correction matrix M ch,Sel and the resulting systematic uncertainty.In order to determine the sensitivity to the p T andηdistributions,the matrix was re-populated using the other MC parameterizations described in Section3and by varying the track-reconstruction efficiency by±5%.The correction factor for events lost due to the track-reconstruction inefficiency was varied by the same amount and treated as fully correlated.For the overall normalisation,this leads to an uncertainty of0.4%due to the model dependence and of1.1%due to the track-reconstruction efficiency. The size of the systematic uncertainties on n ch increases with the multiplicity.。
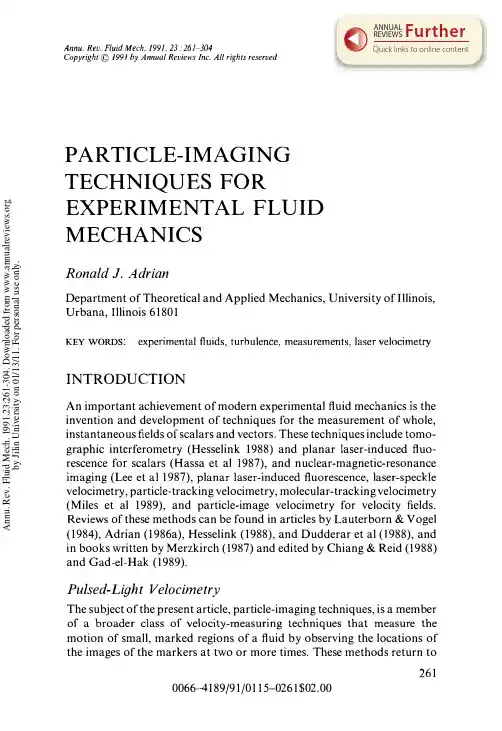
Particle-Imaging Techniques For Experimental Fluid Mechanics
I
Speckle Patterns
Particulate Markers
(N.»l)
I I
LSV
Particle Images
I
I I
I
I II
I
Fluorescent
Molecular Markers
Photochromic
I
I
I
I
(N.«l)
Particle-Image Velocimetry
A technique that uses particles and their images falls into the category commonly known as particle-image ve/ocimetry, or PI V, which is the principal subject of this article. Before comparing the characteristics of PIV with the other methods displayed in Figure I, it is helpful to examine
PIV
I
NI» l
High Image Density PIV
Low Image Density PlY PlY
NI«l
Figure 1
Particle-image velocimetry and other forms of pulsed-light velocimetry.
PARTICLE-IMAGING TECHNIQUES
where ilx is the displacement of a marker, located at x at time t, over a short time interval Llt separating observations of the marker images. The particles are usually solids in gases or liquids but can also be gaseous bubbles in liquids or liquid droplets in gases or immiscible liquids. Other types of markers include (a) patches of molecules that are activated by laser beams, causing them either to fluoresce (Gharib et al 1985), or to change their optical density by photochromic chemical reactions (Popovich & Hummel 1967, Ricka 1987), and (b) speckle patterns caused by illumi nating groups of particles with coherent light. Regardless of the marker type, locations at various instants are recorded optically by pulses of light that freeze the marker images on an optical recording medium such as a photographic film, a video array detector, or a holographic film. Since these methods share many similarities, it is useful to group them under the single topic of pulsed-light velocimetry, or PLV. The various P LV techniques are organized in Figure I.
- 1、下载文档前请自行甄别文档内容的完整性,平台不提供额外的编辑、内容补充、找答案等附加服务。
- 2、"仅部分预览"的文档,不可在线预览部分如存在完整性等问题,可反馈申请退款(可完整预览的文档不适用该条件!)。
- 3、如文档侵犯您的权益,请联系客服反馈,我们会尽快为您处理(人工客服工作时间:9:00-18:30)。
a r X i v :p h y s i c s /0512004v 1 [p h y s i c s .i n s -d e t ] 1 D e c 2005PARTICLE DETECTOR R&DM.V.DANILOVInstitute for Theoretical and Experimental Physics,B.Cheremushkinskaya 25,117218Moscow,RUSSIA E-mail:danilov@itep.ruRecent results on the particle detector R&D for new accelerators are reviewed.Different approaches for the muon systems,hadronic and electromagnetic calorimeters,particle identification devices,and central trackers are discussed.Main emphasis is made on the detectors for the International Linear Collider and Super B-factory.A detailed description of a novel photodetector,a so called Silicon Photomultiplier,and its applications in scintillator detectors is presented.1IntroductionParticle detector R&D is a very active field.Impressive results of the long term R&D for the Large Hadron Collider (LHC)are being summarized now by the four LHC detector collaborations.A worldwide effort is shifted to the detector development for the future In-ternational Linear Collider (ILC)and for the Super B-factory.The detector development for the FAIR facility has already started.Several groups perform R&D studies on de-tectors for the next generation of the hadron colliders.This review is devoted mainly to the de-tector development for the ILC and Super B-factory.The vertex detectors are not dis-cussed here in order to provide more details in other fields.R&D on the vertex detectors is very active and deserves a separate review.This review is organized following the radius of a typical collider detector from outside to inside.2Muon DetectorsMuon detectors cover very large areas.Therefore they should be robust and inexpen-sive.Resistive Plate Chambers (RPC)are of-ten used in the present detectors,for exam-ple at the B-factories.In the streamer mode RPCs provide large signals.Hence it is pos-sible to use very simple electronics.Another advantage is a possibility to have differentshapes of read out electrodes that match best the physics requirements.For example the BELLE RPCs have ring and sector shaped readout electrodes in the end cap regions.The European CaPiRe Collaboration de-veloped a reliable industrial technique for the glass RPC production 1.The production rate of more than 1000square meters per day is possible.The RPC efficiency is larger than 95%up to the counting rates of 1Hz/cm 2.This is reasonably adequate for the ILC de-tector but at the Super-B factory one expects by far larger rates.The RPCs in the propor-tional mode can stand about hundred times higher counting rates.Scintillator strip detectors can work at even higher rates.A very attractive possi-bility is to use scintillator strips with Wave Length Shifting (WLS)fibers read out by so called Silicon Photo Multipliers (SiPM).SiPM is a novel photo detector devel-oped in Russia 2,3,4.It will be mentioned many times in this review.Therefore we shall discuss its properties in detail a .SiPM is a matrix of 1024=32×32independent silicon photodiodes b covering the area of1×1mm2.Each diode has its own quench-ing polysilicon resistor of the order of a fewhundred kΩ.All diode-resistor pairs,calledpixels later on,are connected in parallel.A common reverse bias voltage V bias is ap-plied across them.Its magnitude of the or-der of40−60V is high enough to start theGeiger discharge if any free charge carrier ap-pears in the p−n junction depletion region.The diode discharge current causes a volt-age drop across the resistor.This reducesthe voltage across the diode below the break-down voltage V breakdown and the avalanchedies out.One diode signal is Q pixel=C pixel(V bias−V breakdown)where C pixel is the pixel capacitance.Typically C pixel∼50fF and∆V=V bias−V breakdown∼3V yielding Q pixel∼106electrons.Such an amplifica-tion is similar to the one of a typical photo-multiplier and3–4orders of magnitude largerthan the amplification of an Avalanche PhotoDiode(APD)working in the proportionalmode.Q pixel does not depend on the numberof primary carriers which start the Geiger dis-charge.Thus each diode detects the carrierscreated e.g.by a photon,a charged parti-cle or by a thermal noise with the same re-sponse signal of∼106electrons.Moreoverthe characteristics of different diodes insidethe SiPM are also very similar.Whenfired,they produce approximately the same signals.This is illustrated in Fig.1a.It shows theSiPM response spectrum when it is illumi-nated by weakflashes of a Light EmittingDiode(LED).First peak in thisfigure is thepedestal.The second one is the SiPM re-sponse when it detects exactly one photon.It is not known which diode inside the SiPMproduces the signal since all of them are con-nected to the same output.However since theresponses of all pixels are similar,the peakwidth is small.If several pixels in the SiPMarefired,the net charge signal is the sum ofall charges.The third,forth and so on peaksThe detector consists of a200×2.5×1cm3 plastic scintillator strip and a wavelength shiftingfiber read out by two SiPMs installed at the strip ends.The strip is extruded from the granulated polystyrene with two dyes at the“Uniplast”enterprise in Vladimir,Rus-sia.The Kuraray multicladding WLSfiber Y11(200)with1mm diameter is put in the 2.5mm deep groove in the middle of the strip. No gluing is used to attach the WLSfiber to the SiPM or to the strip.There is about 200µm air gap between thefiber end and the SiPM.To improve the light collection ef-ficiency,the strip is wrapped in the Superra-diant VN2000foil produced by the3M com-pany.In the worst case when the particle passes through the strip center there are13.7de-tected photons.The Minimum Ionizing Par-ticle(MIP)signal in Fig.1b is well separated from the pedestal.The detector efficiency averaged over the strip length is as high as99.3±0.3%at the8pixel threshold.Sucha threshold is sufficient to reduce the SiPM noise rate to5kHz.The ITEP group has also studied100×4×1cm3strips7with a SiPM3at one end of the WLSfiber and a3M Superradiant foil mirror at the other end.The strips were pro-duced by the extrusion technique in Kharkov. The strip surface was covered by a Ti oxide reflector co-extruded together with the strip. The Kuraray Y11,1mm diameterfiber was glued into the3mm deep groove with an op-tical glue.SiPM was also glued to thefiber. More than13photoelectrons per MIP were detected at the strip end far from the SiPM. With such a large number of photoelectrons the efficiency of more than99%for MIP was obtained with the threshold of7photoelec-trons.The detector can work at counting rates above1kHz/cm2.This is sufficient for the Super B-factory.Therefore the Belle Col-laboration plans to use this technique for the K L and muon system upgrade in the end cap region8.A scintillator tile structure can be used for even higher rates.Sixteen10×10×1cm3 tiles read out by two SiPM3each were tested at the KEK B-factory8.They demonstrated a stable performance adequate for the Su-per B-factory.An eight square meter cos-mic test system for ALICE TOF RPC cham-bers is constructed at ITEP9.It consists of15×15×1cm3tiles read out by two SiPMs3each.The counters have an intrinsic noise rate below0.01Hz,the time resolution of1.2nsec,and the rate capabilities up to 10kHz/cm2.3Hadronic CalorimetersThe precision physics program at the fu-ture International Linear Collider(ILC)re-quires to reconstruct heavy bosons(W,Z,H) in hadronicfinal states in multijet events.In order to do this a jet energy resolution of bet-ter than30%/√tion is recorded for each cell.Extremely high granularity of about1cm2/cell is required in this case.In the analog approach the pulse height information is recorded for each cell. However a very high granularity of about 5×5cm2/cell is still required12.Such a granularity practically can not be achieved with a conventional readout approach with WLSfiber and a multianode photomultiplier (MAPM).The use of tiny SiPMs makes sucha granularity achievable.3.1Analog Hadronic CalorimetersA small108channel hadronic calorimeter prototype has been built in order to gain ex-perience with this novel technique5.The calorimeter active modules have been made at ITEP and MEPhI.Scintillator tiles are made of a cheap Russian scintillator using a molding technique.A Kuraray Y111mm di-ameter double clad WLSfiber is inserted into a2mm deep circular groove without gluing. The SiPM is placed directly on the tile and occupies less than0.5%of a sensitive area. There is an air gap of about100µm between thefiber and SiPM.Signals from SiPMs are sent directly to LeCroy2249A ADCs via25 meter long50Ωcables.A lot of R&D has been performed in or-der to increase the light yield and the unifor-mity of the response.For better light collec-tion the surface of the tiles is covered with3M Superradiant foil.The tile edges are chemi-cally treated in order to provide diffuse light reflection and separation between tiles.A light yield of more than20photoelectrons per MIP has been achieved for5×5×0.5cm3 tiles.Fig.2shows LED andβ-source(90Sr) signals from such a tile.Peaks with differ-ent number of photoelectrons are clearly seen. Signals from theβ-source are very similar to MIP signals.The HCAL prototype was successfully operated at the DESY electron test beam. Fig.3shows the linearity of the calorimeterADC channelN5001000150002004006008001000Figure 2.Pulse height spectrum from a tile with SiPM for low intensity LED light(hatched his-togram)and for MIP signals from aβ-source.response measured with SiPM(circles)and MAPM(squares).The agreement between two measurements is better than2%.The linear behavior of the SiPM result(better than2%)demonstrates that the applied sat-uration correction due to limited number of pixels in the SiPM is reliable.The obtained energy resolution agrees well with MC expec-tations and with a resolution obtained using conventional MAPMs as well as APDs13. The obtained resolution of about21%/√the SiPM readout is being constructed by a subgroup of the CALICE Collaboration14. The3×3cm2tiles are used in the central part of the calorimeter in order to test a semidigital approach.MC studies predict that the calorimeter with3×3cm2cells and the3threshold measurement of the energy deposited in the tile should provide as good performance as a digital(yes/no)calorimeter with the1×1cm2granularity15.3.2Digital Hadronic CalorimetersThe RPC based digital HCAL is developed by a subgroup of the CALICE collabora-tion16.They studied several RPC geometries and gases in order to optimize the efficiency and to reduce the cross-talk between pads. Fig.4shows the efficiency and pad multiplic-ity due to cross-talk obtained with the devel-oped RPC prototype.The prototype consists of two sheets offloating glass with the resis-tive paint layer(1Mohm/square)and the gas gap of1.2mm.In works in the proportional mode and has the efficiency above90%up to the rates of50Hz/cm2.The pad multiplicity is about1.5.Much smaller pad multiplicity is observed in the RPC in which the readout electrode defines the gas sensitive volume in-stead of the glass sheet(see Fig.4).It will be interesting to study further the properties of this promising RPC.The GEM based digital HCAL is studied by another subgroup of the CALICE Collabo-ration17.They developed a procedure for the large area double GEM chamber production.A small prototype demonstrates the95%ef-ficiency at40mV threshold and the pad mul-tiplicity of1.27.The3M company plans to produce already in2005very long GEM foils of about30cm width.The number of channels in the digital HCAL is enormous.Therefore cheap and re-liable electronics is the key issue for this ap-proach.The RPC and GEM digital HCAL teams develop jointly the electronicssuitable Figure4.Pad multiplicity dependence on the effi-ciency for two types of RPC:full circles-standard RPC with two glass sheets;triangles and squares-the RPC with one glass sheet.for both techniques.3.3The DREAM CalorimeterUsually calorimeters have different response to electromagnetic and hadronic showers of the same energy.Therefore thefluctuations of the electromagnetic energy fraction in the hadron shower is one of the main reasons for the deterioration of the energy resolution.In the Dual Readout Module(DREAM) calorimeter18the electromagnetic energy in the hadronic shower is measured indepen-dently using quartzfibers sensitive only to the Cherenkov light produced dominantly by electrons.The visible energy is measured by scintillationfibers.The electromagnetic energy fraction in the shower can be deter-mined by the comparison of the two mea-surements.This allows to correct for the different calorimeter response to the electro-magnetic showers and to improve the en-ergy resolution.A very similar response to electrons,hadrons,and jets was obtained in the DREAM calorimeter prototype after this correction.The ultimate energy resolution of the DREAM calorimeter is expected to be better than30%/√shower leakage and insufficient amount of the Cherenkov light limited the measured proto-type calorimeter resolution to64%/√E is expected18.There are many nice ideas how to separate different mechanisms in the hadronic shower and to improve the en-ergy resolution18.However they should be first demonstrated experimentally.4Electromagnetic Calorimeters4.1Electromagnetic Calorimeters forILCThe requirement of a high granularity for the ILC detectors leads to the choice of very dense electromagnetic calorimeters with a small Mollier radius(R M).Sili-con/tungsten,scintillator/tungsten and scin-tillator/lead sandwich options are developed. The price for the high granularity is a modest energy resolution of the proposed calorime-ters.The CALICE collaboration constructs the Si/W prototype with about10thousand channels19.The pad size is as small as 1×1cm2.The Si thickness is500µm.The tungsten plate thickness is1.4mm,2.8mm, and4.2mm in the front,middle,and rare parts of the calorimeter.One third of the prototype has already been tested at the DESY electron beam and demonstrated a stable behavior.The signal to noise ratio of8.5was obtained for MIP.The tests of the whole calorimeter will start this Winter. The combined tests with the analog hadronic calorimeter are planned in2006as well.The detector and readout plane thickness is3.4mm in the present prototype.It will be reduced to1.75mm including the readout chip in thefinal design resulting in R M= 1.4cm.The US groups(SLAC,UO,BNL)de-velop even more aggressive design of the Si/W calorimeter20for the small radius Si based ILC detector(ILC SiD).The detec-tor and readout plane thickness is1mm only which results in the R M=1.4cm.Together with HPK they developed the Si detector consisting of1024hexagonal pads with5mm inner diameter.The detector is read out by a specially developed electronic chip21.The measured MIP signal in this detector is26k electrons while the pedestal width is780elec-trons.The Si/W calorimeter for ILC is also developed in Korea22.A hybrid scintillator/lead calorimeter prototype with three Si layers has been built and tested by the INFN groups23.The 5×5×0.3cm3scintillator tiles are com-bined into4longitudinal sections.Three lay-ers of9×9mm2Si pads are placed between the sections at2,6,and12X0.The proto-type demonstrated a good energy resolution of11.1%/√olution and a fast response.They should be radiation hard up to about 10kRad in the endcap region.The present CsI(Tl)calorime-ters at the KEKB and SLAC B-factories can not stand the planned increase of the lumi-nosity above 20ab −1.The CsI(Tl)light yield decreases to about 60%already at 10ab −1.There is also a large increase of PIN diode dark current.Finally the long decay time of about 1µsec leads to the pile up noise and fake clusters.The BELLE Collaboration proposes to use pure CsI crystals with a phototetrode readout and a waveform analysis in the end cap region 25.The shaping time is reduced from 1µsec to 30nsec .The time resolution of better than 1nsec is achieved for energies above 25MeV .The electronic noise is simi-lar to the present CsI(Tl)calorimeters.The pure CsI crystals keep more than 90%of the light output after the irradiation of 7kRad .The BaBar Collaboration considers more radiation hard options of LSO or LYSO crys-tals and a liquid Xe calorimeter with the light readout 26.The LSO and LYSO crystals are radiation hard,fast,and dense (see Ta-ble 1).They meet perfectly the requirements of the Super B-factory but their cost is pro-hibitively high at the moment.Liquid Xe is also an attractive option as it is seen in Ta-ble 1.The challenge here is the UV light col-lection.BaBar proposes to use WLS fibers and WLS cell coating for an immediate shift of the light wave length into a region with smaller absorption.There is a good experience with very large liquid noble gas calorimeters.For ex-ample the 11m 3LiKr calorimeter at VEPP-4has an excellent spatial (∼1mm )and energy (∼3%/√CsI(Tl)LiXe 4.53 2.951.85 2.873.8 5.75501756804.2,Photons/MeV 27kRadiation0.01-3.22.5on the lead tungstate (P bW O 4)calorime-ter 28.The choice of P bW O 4(Y/Nb)is driven by its small X 0=0.89cm ,small R M =2.19cm ,fast decay time of τ∼10nsec ,and a very high radiation hardness above 200kGy .More than 37.000crystal have already been produced at the Bogoroditsk (Russia).In spite of a small light yield of ∼8p.e./MeV the excellent energy resolution of 0.51%has been achieved at 120GeV .Intensive R&D together with Hamamatsu resulted in excel-lent APD operated at a gain of 50.All 120.000APDs passed a very strict accep-tance test which included a 500krad irradi-ation and accelerated aging.Vacuum pho-totriodes (RIA,St.Petersburg)will be used in the endcaps because they are more radia-tion hard.The main challenge for CMS is to finish the production of crystals and to main-tain the advantages of this approach in the big calorimeter.5Particle Identification 5.1Cherenkov CountersA novel type of proximity focusing RICH counter with a multiple refractive index (n )aerogel radiator has been developed for the BELLE detector upgrade 29.The multiple radiator allows to increase the radiator thick-ness and hence the Cherenkov photon yield without degradation in single photon angular resolution.With the refractive index of the consecutive layers suitably increasing in the downstream direction (focusing combination)one can achieve overlapping of Cherenkov rings from all layers (see Fig.5).With the de-creasing n (defocusing combination)one can obtain well separated rings from different lay-ers (see Fig.6).Figure 5.Principle of the dual radiator Ring Imaging Cherenkov counter .500 1000 1500 2000 2500 3000 3500 4000 45000.1 0.2 0.3 0.4 0.5 E n t r i e s Cherenkov Angle [rad]σ=14.3mrad Npe=5.4σ=14.8mrad Npe=2.2Figure 6.Distribution of the Cherenkov photon an-gles from 4GeV pions for a defocusing dual radiator with n 1=1.057and n 2=1.027Fig.7shows the performance of the de-tector with the single and multiple layer ra-diators.The number of detected photons is similar in two approaches but the single pho-ton resolution is much better in the multi-ple layer configuration.The Cherenkov angle resolution of 4.5mrad per track was achieved with the triple layer radiator.This corre-sponds to the 5.1σK/πseparation at 4GeV .The radiators with different refraction in-dex layers attached directly at the molecular level have been produced at Novosibirsk 30and in Japan 29.R e s o l u t i o n [m r a d ]N p e Thickness [mm]σ(t r a c k ) [m r a d ]Figure 7.Single photon resolution (a),number of de-tected photons (b),and single track Cherenkov angle resolution for single and multiple focusing radiators for 4GeV pions.The BaBar DIRC detector demonstrated an excellent performance.It is natural to consider the improved version of this tech-nique for the Super B-factory.The SLAC and Cincinnati groups develop the Fast Fo-cusing DIRC (FDIRC)detector 26.The idea of this detector is illustrated in Fig.8.With the accurate time measurement one gets a 3D image of the Cherenkov cone.In FDIRC the photon detection part is by far smaller than in DIRC.The development of the pixelated photodetectors with better than 100nsec time resolution is a challeng-ing task.The detail studies of Hamamatsu MAPM and Burley MCP PM at SLAC give very promising results.The FDIRC proto-type is ready for tests atSLAC.Figure 8.The principle of FDIRC operation.In the Time of Propagation (TOP)counter the Cherenkov cone image is recon-structed from the coordinate at the quartz bar end and the TOP 31.The MCP PM SL10is developed for TOP together with HPK.SL10has 5mm pitch and a single photon sensitivity in the 1.5T magnetic field.The time resolution of 30psec has been achieved however the cross-talk is still a problem.The Ga/As photocathodes developed by HPK and Novosibirsk provide enough light for the 4σπ/K separation at 4GeV .However the cathode life time is not sufficient yet.It looses 40%of quantum efficiency after col-lecting 350mC/cm 2which corresponds to 6month operation at the Super B-factory.5.2TOF systemsA multilayer RPC (MRPC)with the excel-lent time resolution of better than 50psec (see Fig.9)has been developed for the AL-ICE TOF system 32.It has the efficiency of about 99%at the counting rates as high as few hundred Hz/cm 2.The MRPC has ten 220µm gaps.It would be interesting to in-vestigate a possibility to use MRPC for K L momentum measurements in the muon sys-tem at the SuperB-factory.U(kV)Figure 9.Efficiency (triangles,%),time resolution (squares,nsec ),and streamer probability (circles,%)of MRPC versus applied voltage across 5gaps (kV).A time resolution of 48psec was obtained with a 3×3×40mm 3Bicron-418scintillator read out directly by a 3×3mm 2SiPM with-out preamplifier 33.The MIPs were crossing 40mm in the scintillator.Therefore the sig-nal was as big as 2700pixels in the SiPM with 5625pixels.The threshold was at 100pixels.This approach is very promising for a super high granularity TOF capable to work in a very high intensity beams for example at FAIR.6TrackingThe Time Projection Chamber (TPC)is a natural choice for the ILC detector central tracker.This approach is developed by a large world wide collaboration 34.TPC pro-vides continues tracking through a large vol-ume with a very small amount of material in front of the ECAL (X 0∼3%in the barrel re-gion).The dE/dx resolution of better than 5%helps in particle identification.The thrust of the R&D is in the de-velopment of novel micro-pattern gas detec-tors which promise to have a better point and two track resolution than the traditional wire chambers.These detectors have smaller ion feedback into the TPC volume.Mi-cromegas meshes and GEM foils are consid-ered as main candidates.The spatial resolu-tion of ∼100µm was already achieved with GEM after the 65cm drift in the 4T field (see Fig.10).Tests at smaller fields demonstrate that a similar resolution can be achieved with Micromegas as well.The double track reso-lution of ∼2mm has been already demon-strated in small prototypes.By pitting a re-sistive foil above the readout pads it is pos-sible to spread the signal over several pads.As a result the resolution improves up to the diffusionlimit.Figure 10.The transverse resolution dependence on the drift distance for three values of the magnetic field obtained in the TPC with a GEM readout.A very exciting approach is a direct TPC readout with the MediPix2chip 34.This CMOS chip contains a square matrix of 256×256pixels of 55×55µm 2.Each pixel isequipped with a low noise preamplifier,dis-criminator,threshold DAC and communica-tion logic.The extremely high granularity allows to distinguish individual clusters in a track.Thus the ultimate spatial and dE/dx resolution can be achieved.Unfortunately the diffusion will severely limit both mea-surements.Nice tracks have been recorded by a prototype chamber equipped with Mi-cromegas and MediPix2(see Fig.11).The number of observed clusters (0.52/mm in a He/Isobutane 80/20mixture)agrees within 15%with the expectations.The next step is to integrate the chip and Micromegas at the postprocessing step and to add the (drift)time measurement.Tracks were observed also with a GEM/MediPix2prototype 36.AFigure 11.The transverse resolution dependence on the drift distance for three values of the magnetic field obtained in the TPC with a GEM readout.compact all Si tracker is vigorously developed by the US groups 35for the small radius Si Detector for ILC.With small detector mod-ules it is possible to reach a very good S/N ratio of about 20,to have a simple low risk assembly and relatively small amount of ma-terial of ∼0.8%X 0per layer including a sup-port structure.The pattern recognition is a serious issue for the Si tracker especially for tracks not coming from the main vertex.The choice of the central tracker for theSuper B-factory depends crucially on the ex-pected background which depends on the in-teraction region design.In the BELLE study25the background is expected to increase by a factor20from the present values.In this case the drift chamber with13.3×16mm2cells is still ad-equate for the radius above12.8cm.Small 5.4×5.0mm2cells are foreseen for the radius between10.2cm and11.6cm.In the BaBar study37the luminosity term in the background extrapolation dom-inates.Therefore the background estimates are much higher than in the BELLE case.A drift chamber can not work in such environ-ment.Therefore it is proposed to use the all Si tracker up to R=60cm.A relatively large amount of material in the Si sensors and support structures leads to multiple scatter-ing and considerable deterioration of the mo-mentum and mass resolution.For example the mass resolution in the B→π+π−decay mode deteriorates from23MeV in case of the drift chamber to35MeV in case of a conser-vative Si tracker design.Serious R&D efforts are required to make the Si tracker thinner.It should be also demonstrated that the pattern recognition in the Si tracker is good enough.May be it is possible to develop an al-ternative solution to the Si -ing the controlled etching the BINP-CERN group reduced the Cu thickness in GEM foils from5to1µm38.This allows to build the light triple GEM chamber with less than 0.15%X0including the readout electrode. The light double GEM chamber has even smaller thickness.The double and triple light GEM chambers were constructed and demon-strated identical performance with the stan-dard GEM chambers.The light GEM cham-bers have a potential to provide the granu-larity and spatial resolution comparable to the Si tracker but with considerably smaller amount of material.However it is not clear so far how thick a support structure is needed.A lot of R&D studies are required to demon-strate a feasibility of this approach.7ConclusionsThe ongoing R&D should be sufficient to demonstrate the feasibility of detectors for the ILC and the Super B-factory.However there are many promising new ideas which have a potential to improve considerably the performance of the detectors and to exploit fully the physics potential of these colliders. The technologies for practically all detector subsystems are still to be selected on the ba-sis of the R&D results.It is very important to strengthen and to focus the detector R&D especially for the ILC as it was done for the LHC collider.8AknowledgmentsThis review would be impossible without many fruitful discussions with physicists working on the detector R&D for the LHC, ILC,and Super B-factory.In particular we are grateful to A.Bondar,J.Brau,B.Dol-goshein,J.Haba, E.Popova, F.Sefkow, R.Settles, A.Smirnitsky.This work was supported in part by the Russian grants SS551722.2003.2and RFBR0402/17307a. References1.M.Piccolo,Proc.LCWS2005,SLAC(2004).2.G.Bondarenko et al.,Nucl.Phys.Proc.Suppl.61B(1998)347.G.Bondarenko et al.,Nucl.Instr.Meth.A442(2000)187.P.Buzhan et al.,ICFA Intstr.Bull.23(2001)28.P.Buzhan et al.,Nucl.Instr.Meth.A504(2003)48.3.A.Akindinov et al.,Nucl.Instr.Meth.A387(1997)231.4.Z.Sadygov et al.,arXiv:hep-ex/9909017and references therein.。