静态化引擎应用指南
红帽JBoss企业应用平台7.1性能优化指南说明书

Red Hat JBoss Enterprise ApplicationPlatform 7.1Performance Tuning GuideFor Use with Red Hat JBoss Enterprise Application Platform 7.1Last Updated: 2018-10-11Red Hat JBoss Enterprise Application Platform 7.1 Performance Tuning GuideFor Use with Red Hat JBoss Enterprise Application Platform 7.1Legal NoticeCopyright © 2018 Red Hat, Inc.The text of and illustrations in this document are licensed by Red Hat under a Creative Commons Attribution–Share Alike 3.0 Unported license ("CC-BY-SA"). An explanation of CC-BY-SA is available at/licenses/by-sa/3.0/. In accordance with CC-BY-SA, if you distribute this document or an adaptation of it, you must provide the URL for the original version.Red Hat, as the licensor of this document, waives the right to enforce, and agrees not to assert, Section 4d of CC-BY-SA to the fullest extent permitted by applicable law.Red Hat, Red Hat Enterprise Linux, the Shadowman logo, JBoss, OpenShift, Fedora, the Infinity logo, and RHCE are trademarks of Red Hat, Inc., registered in the United States and other countries.Linux ® is the registered trademark of Linus Torvalds in the United States and other countries. Java ® is a registered trademark of Oracle and/or its affiliates.XFS ® is a trademark of Silicon Graphics International Corp. or its subsidiaries in the United States and/or other countries.MySQL ® is a registered trademark of MySQL AB in the United States, the European Union and other countries.Node.js ® is an official trademark of Joyent. Red Hat Software Collections is not formally related to or endorsed by the official Joyent Node.js open source or commercial project.The OpenStack ® Word Mark and OpenStack logo are either registered trademarks/service marks or trademarks/service marks of the OpenStack Foundation, in the United States and other countries and are used with the OpenStack Foundation's permission. We are not affiliated with, endorsed or sponsored by the OpenStack Foundation, or the OpenStack community.All other trademarks are the property of their respective owners.AbstractThis book is a guide of performance tuning for Red Hat JBoss Enterprise Application Platform 7.1.. . . . . . . . . . . . . . . . . . . . . . . . . . . . . . . . . . . . . . . . . . . . . . . . . . . . . . . . . . . . . . . . . . . . . . . . . . . . . . . . . . . . . . . . . . . . . . . . . . . . . . . . . . . . . . . . . . . . . . . . . . . . . . . . . . . . . . . . . . . . . . . . . . . . . . . . . . . . . . . . . . . . . . . . . . . . . . . . . . . . . . . . . . . . . . . . . . . . . . . . . . . . . . . . . . . . . . . . . . . . . . . . . . . . . . . . . . . . . . . . . . . . . . . . . . . . . . . . . . . . . . . . . . . . . . . . . . . . . . . . . . . . . . . . . . . . . . . . . . . . . . . . . . . . . . . . . . . . . . . . . . . . . . . . . . . . . . . . . . . . . . . . . . . . . . . . . . . . . . . . . . . . . . . . . . . . . . . . . . . . . . . . . . . . . . . . . . . . . . . . . . . . . . . . . . . . . . . . . . . . . . . . . . . . . . . . . . . . . . . . . . . . . . . . . . . . . . . . . . . . . . . . . . . . . . . . . . . . . . . . . . . . . . . . . . . . . . . . . . . . . . . . . . . . . . . . . . . . . . . . . . . . . . . . . . . . . . . . . . . . . . . . . . . . . . . . . . . . . . . . . . . . . . . . . . Table of Contents CHAPTER 1. INTRODUCTION 1.1. ABOUT THE USE OF EAP_HOME IN THIS DOCUMENT CHAPTER 2. MONITORING PERFORMANCE 2.1. CONFIGURING JBOSS EAP FOR REMOTE MONITORING CONNECTIONS2.2. JCONSOLE2.2.1. Connecting to a Local JBoss EAP JVM Using JConsole2.2.2. Connecting to a Remote JBoss EAP JVM Using JConsole2.3. JAVA VISUALVM2.3.1. Connecting to a Local JBoss EAP JVM Using VisualVM2.3.2. Connecting to a Remote JBoss EAP JVM Using VisualVM CHAPTER 3. DIAGNOSING PERFORMANCE ISSUES 3.1. ENABLING GARBAGE COLLECTION LOGGING 3.2. JAVA HEAP DUMPS 3.2.1. Creating a Heap Dump 3.2.1.1. OpenJDK and Oracle JDK 3.2.1.2. IBM JDK 3.2.2. Analyzing a Heap Dump 3.3. IDENTIFYING HIGH CPU UTILIZATION BY JAVA THREADS CHAPTER 4. JVM TUNING 4.1. SETTING A FIXED HEAP SIZE 4.2. CONFIGURING THE GARBAGE COLLECTORGarbage Collection Logging Options4.3. ENABLING LARGE PAGES4.4. ENABLING AGGRESSIVE OPTIMIZATIONS4.5. SETTING ULIMITS4.6. HOST CONTROLLER AND PROCESS CONTROLLER JVM TUNING CHAPTER5. EJB SUBSYSTEM TUNING 5.1. BEAN INSTANCE POOLS 5.1.1. Creating a Bean Instance Pool 5.1.2. Specifying the Instance Pool a Bean Should Use 5.1.3. Disabling the Default Bean Instance Pool 5.2. BEAN THREAD POOLS 5.2.1. Creating a Bean Thread Pool 5.2.2. Configuring EJB Services to Use a Specific Bean Thread Pool 5.3. EXCEPTIONS THAT INDICATE EJB SUBSYSTEM TUNING MIGHT BE REQUIRED CHAPTER6. DATASOURCE AND RESOURCE ADAPTER TUNING 6.1. MONITORING POOL STATISTICS 6.1.1. Datasource Statistics 6.1.1.1. Enabling Datasource Statistics Enable Datasource Statistics Using the Management CLI Enable Datasource Statistics Using the Management Console 6.1.1.2. Viewing Datasource StatisticsView Datasource Statistics Using the Management CLIView Datasource Statistics Using the Management Console6.1.2. Resource Adapter StatisticsEnable Resource Adapter StatisticsView Resource Adapter Statistics6.2. POOL ATTRIBUTES 4455778910111313131313141415161616161618181920202021212122222224242424242425252626262627Table of Contents1. . . . . . . . . . . . . . . . . . . . . . . . . . . . . . . . . . . . . . . . . . . . . . . . . . . . . . . . . . . . . . . . . . . . . . . . . . . . . . . . . . . . . . . . . . . . . . . . . . . . . . . . . . . . . . . . . . . . . . . . . . . . . . . . . . . . . . . . . . . . . . . . . . . . . . . . . . . . . . . . . . . . . . . . . . . . . . . . . . . . . . . . . . . . . . . . . . . . . . . . . . . . . . . . . . . . . . . . . . . . . . . . . . . . . . . . . . . . . . . . . . . . . . . . . . . . . . . . . . . . . . . . . . . . . . . . . . . . . . . . . . . . . . . . . . . . . . . . . . . . . . . . . . . . . . . . . . . . . . . . . . . . . . . . . . . . . . . . . . . . . . . . . . . . . . . . . . . . . . . . . . . . . . . . . . . . . . . . . . . . . . . . . . . . . . . . . . . . . . . . . . . . . . . . . . . . . . . . . . . . . . . . . . . . . . . . . . . . . . . . . . . . . . . . . . . . . . . . . . . . . . . . . . . . . . . . . . . . . . . . . . . . . . . . . . . . . . . . . . . . . . . . . . . . . . . . . . . . . . . . . . . . . . . . . . . . . . . . . . . . . . . . . . . . . . . . . . . . . . . . . . . . . . . . . . . . . . . . . . . . . . . . . . . . . . . . . . . . . . . . . . . . . . . . . . . . . . . . . . . . . . . . . . . . . . . . . . . . . . . . . . . . . . . . . . . . . . . . . . . . . . . . . 6.3. CONFIGURING POOL ATTRIBUTES 6.3.1. Configuring Datasource Pool Attributes 6.3.2. Configuring Resource Adapter Pool Attributes CHAPTER 7. MESSAGING SUBSYSTEM TUNING CHAPTER 8. LOGGING SUBSYSTEM TUNING 8.1. DISABLING LOGGING TO THE CONSOLE8.2. CONFIGURING LOGGING LEVELS8.3. CONFIGURING THE LOCATION OF LOG FILES CHAPTER 9. UNDERTOW SUBSYSTEM TUNING 9.1. BUFFER CACHES 9.2. JSP CONFIGURATION9.3. LISTENERS CHAPTER 10. IO SUBSYSTEM TUNING 10.1. CONFIGURING WORKERS 10.1.1. Monitoring Worker Statistics10.2. CONFIGURING BUFFER POOLS CHAPTER 11. JGROUPS SUBSYSTEM TUNING 11.1. MONITORING JGROUPS STATISTICS11.2. NETWORKING AND JUMBO FRAMES11.3. MESSAGE BUNDLING11.4. JGROUPS THREAD POOLS11.5. JGROUPS SEND AND RECEIVE BUFFERS CHAPTER 12. TRANSACTIONS SUBSYSTEM TUNING APPENDIX A. REFERENCE MATERIAL A.1. DATASOURCE STATISTICS A.2. RESOURCE ADAPTER STATISTICS A.3. IO SUBSYSTEM ATTRIBUTES 282829303131313132323233353535353636373738383940404343Red Hat JBoss Enterprise Application Platform 7.1 Performance Tuning Guide2Table of Contents3Red Hat JBoss Enterprise Application Platform 7.1 Performance Tuning Guide4CHAPTER 2. MONITORING PERFORMANCEYou can monitor JBoss EAP performance using any tool that can examine JVMs running on your machine. Red Hat recommends that you use either JConsole, for which JBoss EAP includes a preconfigured wrapper script, or Java VisualVM. Both these tools provide basic monitoring of JVM processes, including memory usage, thread utilization, loaded classes, and other JVM metrics.If you will be running one of these tools locally on the same machine that JBoss EAP is running on, then no configuration is necessary. However, if you will be running one of these tools to monitor JBoss EAP running on a remote machine, then some configuration is required for JBoss EAP to accept remote JMX connections .2.1. CONFIGURING JBOSS EAP FOR REMOTE MONITORING CONNECTIONSFor a Standalone Server1. Ensure that you have created a management user. You might want to create a separatemanagement user to monitor your JBoss EAP server. See the JBoss EAP Configuration Guide for details.2. When starting JBoss EAP, bind the management interface to the IP address that you will use to remotely monitor the server:$ EAP_HOME /bin/standalone.sh -bmanagement=IP_ADDRESSWARNINGThis exposes all the JBoss EAP management interfaces, including themanagement console and management CLI, to the specified network.Ensure that you only bind the management interface to a private network.3. Use the following URI with your management user name and password in your JVM monitoring tool to connect to the JBoss EAP server. The URI below uses the default management port(9990).service:jmx:remote+http://IP_ADDRESS :9990For a Managed Domain HostUsing the above procedure of binding the management interface on a managed domain host will only expose the host controller JVM for remote monitoring, and not the individual JBoss EAP servers running on that host.To configure JBoss EAP to remotely monitor individual servers on a managed domain host, follow the procedure below.1. Create a new user in the ApplicationRealm that you will use to connect to the JBoss EAP servers for remote monitoring. See the JBoss EAP Configuration Guide for details. CHAPTER2. MONITORING PERFORMANCE5Red Hat JBoss Enterprise Application Platform 7.1 Performance Tuning Guide6CHAPTER 2. MONITORING PERFORMANCERed Hat JBoss Enterprise Application Platform 7.1 Performance Tuning GuideCHAPTER 2. MONITORING PERFORMANCERed Hat JBoss Enterprise Application Platform 7.1 Performance Tuning GuideCHAPTER 2. MONITORING PERFORMANCERed Hat JBoss Enterprise Application Platform 7.1 Performance Tuning GuideCHAPTER 3. DIAGNOSING PERFORMANCE ISSUESRed Hat JBoss Enterprise Application Platform 7.1 Performance Tuning GuideCHAPTER 3. DIAGNOSING PERFORMANCE ISSUESRed Hat JBoss Enterprise Application Platform 7.1 Performance Tuning GuideCHAPTER 4. JVM TUNINGRed Hat JBoss Enterprise Application Platform 7.1 Performance Tuning GuideCHAPTER 4. JVM TUNINGRed Hat JBoss Enterprise Application Platform 7.1 Performance Tuning GuideCHAPTER 5. EJB SUBSYSTEM TUNINGRed Hat JBoss Enterprise Application Platform 7.1 Performance Tuning GuideCHAPTER 5. EJB SUBSYSTEM TUNINGRed Hat JBoss Enterprise Application Platform 7.1 Performance Tuning GuideCHAPTER 6. DATASOURCE AND RESOURCE ADAPTER TUNINGRed Hat JBoss Enterprise Application Platform 7.1 Performance Tuning GuideRed Hat JBoss Enterprise Application Platform 7.1 Performance Tuning GuideCHAPTER 6. DATASOURCE AND RESOURCE ADAPTER TUNINGRed Hat JBoss Enterprise Application Platform 7.1 Performance Tuning GuideCHAPTER 7. MESSAGING SUBSYSTEM TUNING Performance tuning advice for the messaging-activemq subsystem is covered in the Performance Tuning part of the JBoss EAP Configuring Messaging guide.CHAPTER 8. LOGGING SUBSYSTEM TUNINGCHAPTER 8. LOGGING SUBSYSTEM TUNINGYou can further improve upon JBoss EAP logging subsystem performance in production environmentsby disabling logging to console, configuring appropriate logging levels, and specifying the best location to store log files.For more information on configuring the logging subsystem, see the logging chapter in the JBoss EAP Configuration Guide.8.1. DISABLING LOGGING TO THE CONSOLEDisabling console logging can improve JBoss EAP performance. Although outputting logs to the console can be useful in development and testing environments, for production environments it is not necessaryin most cases. The JBoss EAP root logger includes a console log handler for all default standalone server profiles except standalone-full-ha. The default managed domain profiles do not include a console handler.To remove the default console handler from the root logger, use the following management CLI command./subsystem=logging/root-logger=ROOT:remove-handler(name=CONSOLE)8.2. CONFIGURING LOGGING LEVELSFor ideal performance, you must configure the logging levels for your production environment appropriately. For example, although INFO or DEBUG levels might be appropriate for development or testing environments, in most cases you should set your production environment logging level to something higher, such as WARN or ERROR.For details on setting log levels for different logging handlers, see Configuring Log Handlers in the JBoss EAP Configuration Guide.8.3. CONFIGURING THE LOCATION OF LOG FILESYou should consider the storage location of log files as a potential performance issue. If you save logs to a file system or disk configuration that has poor I/O throughput, it has the potential to affect the whole platform’s performance.To prevent logging from impacting JBoss EAP performance, it is recommended that you set log locations to high-performance dedicated disks that have a lot of space.For details on configuring log file locations for different logging handlers, see Configuring Log Handlers in the JBoss EAP Configuration Guide.Red Hat JBoss Enterprise Application Platform 7.1 Performance Tuning GuideCHAPTER 9. UNDERTOW SUBSYSTEM TUNINGThe non-blocking I/O undertow subsystem introduced in JBoss EAP 7 has greatly improved performance compared to the previous web subsystem in JBoss EAP 6. Opportunities for tuning the undertow subsystem for your environment include configuring buffer caches, JSP settings, and listeners.9.1. BUFFER CACHESA buffer cache is used to cache static files handled by the undertow subsystem. This includes images, static HTML, CSS, and JavaScript files. You can specify a default buffer cache for each Undertow servlet container. Having an optimized buffer cache for your servlet container can improve Undertow performance for serving static files.Buffers in a buffer cache are allocated in regions, and are of a fixed size. There are three configurable attributes for each buffer cache:buffer-sizeThe size of an individual buffer, in bytes. The default is 1024 bytes. Red Hat recommends that you set the buffer size to entirely store your largest static file.buffers-per-regionThe number of buffers per region. The default is 1024.max-regionsThe maximum number of regions, which sets a maximum amount of memory allocated to the buffer cache. The default is 10 regions.You can calculate the maximum amount memory used by a buffer cache by multiplying the buffer size, the number of buffers per region, and the maximum number of regions. For example, the default buffer cache is 1024 bytes * 1024 buffers per region * 10 regions = 10MB.Configure your buffer caches based on the size of your static files, and the results from testing expected loads in a development environment. When determining the effect on performance, consider the balance of the buffer cache performance benefit versus the memory used.For instructions on using the management CLI to configure buffer caches, see Configuring Buffer Caches in the JBoss EAP Configuration Guide.9.2. JSP CONFIGURATIONThere are JSP configuration options for Undertow servlet containers that provide optimizations for how JSP pages are compiled into Java bytecode.generate-strings-as-char-arraysIf your JSPs contain a lot of String constants, enabling this option optimizes scriplets by converting the String constants to char arrays.optimize-scriptletsIf your JSPs contain many String concatenations, enabling this option optimizes scriplets byremoving String concatenation for every JSP request.trim-spacesIf your JSPs contain a lot of white space, enabling this option trims the white space from HTTPrequests and reduces HTTP request payload.CHAPTER 9. UNDERTOW SUBSYSTEM TUNINGRed Hat JBoss Enterprise Application Platform 7.1 Performance Tuning GuideCHAPTER 10. IO SUBSYSTEM TUNINGRed Hat JBoss Enterprise Application Platform 7.1 Performance Tuning GuideCHAPTER 11. JGROUPS SUBSYSTEM TUNINGRed Hat JBoss Enterprise Application Platform 7.1 Performance Tuning GuideCHAPTER 12. TRANSACTIONS SUBSYSTEM TUNINGRed Hat JBoss Enterprise Application Platform 7.1 Performance Tuning GuideAPPENDIX A. REFERENCE MATERIALA.1. DATASOURCE STATISTICSTable A.1. Core Pool StatisticsActiveCount The number of active connections. Each of the connections iseither in use by an application or available in the pool.AvailableCount The number of available connections in the pool.AverageBlockingTime The average time spent blocking on obtaining an exclusive lockon the pool. This value is in milliseconds.AverageCreationTime The average time spent creating a connection. This value is inmilliseconds.AverageGetTime The average time spent obtaining a connection.AveragePoolTime The average time that a connection spent in the pool.AverageUsageTime The average time spent using a connection.BlockingFailureCount The number of failures trying to obtain a connection.CreatedCount The number of connections created.DestroyedCount The number of connections destroyed.IdleCount The number of connections that are currently idle.InUseCount The number of connections currently in use.MaxCreationTime The maximum time it took to create a connection. This value isin milliseconds.MaxGetTime The maximum time for obtaining a connection.MaxPoolTime The maximum time for a connection in the pool.MaxUsageTime The maximum time using a connection.MaxUsedCount The maximum number of connections used.MaxWaitCount The maximum number of requests waiting for a connection at thesame time.APPENDIX A. REFERENCE MATERIAL MaxWaitTime The maximum time spent waiting for an exclusive lock on thepool.TimedOut The number of timed out connections.TotalBlockingTime The total time spent waiting for an exclusive lock on the pool.This value is in milliseconds.TotalCreationTime The total time spent creating connections. This value is inmilliseconds.TotalGetTime The total time spent obtaining connections.TotalPoolTime The total time spent by connections in the pool. TotalUsageTime The total time spent using connections.WaitCount The number of requests that had to wait to obtain a connection. XACommitAverageTime The average time for an XAResource commit invocation. XACommitCount The number of XAResource commit invocations. XACommitMaxTime The maximum time for an XAResource commit invocation. XACommitTotalTime The total time for all XAResource commit invocations. XAEndAverageTime The average time for an XAResource end invocation. XAEndCount The number of XAResource end invocations.XAEndMaxTime The maximum time for an XAResource end invocation. XAEndTotalTime The total time for all XAResource end invocations. XAForgetAverageTime The average time for an XAResource forget invocation. XAForgetCount The number of XAResource forget invocations. XAForgetMaxTime The maximum time for an XAResource forget invocation. XAForgetTotalTime The total time for all XAResource forget invocations. XAPrepareAverageTime The average time for an XAResource prepare invocation.Red Hat JBoss Enterprise Application Platform 7.1 Performance Tuning GuideXAPrepareCount The number of XAResource prepare invocations.XAPrepareMaxTime The maximum time for an XAResource prepare invocation.XAPrepareTotalTime The total time for all XAResource prepare invocations.XARecoverAverageTime The average time for an XAResource recover invocation.XARecoverCount The number of XAResource recover invocations.XARecoverMaxTime The maximum time for an XAResource recover invocation.XARecoverTotalTime The total time for all XAResource recover invocations.XARollbackAverageTime The average time for an XAResource rollback invocation.XARollbackCount The number of XAResource rollback invocations.XARollbackMaxTime The maximum time for an XAResource rollback invocation.XARollbackTotalTime The total time for all XAResource rollback invocations.XAStartAverageTime The average time for an XAResource start invocation.XAStartCount The number of XAResource start invocations.XAStartMaxTime The maximum time for an XAResource start invocation.XAStartTotalTime The total time for all XAResource start invocations.Table A.2. JDBC StatisticsPreparedStatementCacheAccessCount The number of times that the statement cache was accessed.PreparedStatementCacheAddCount The number of statements added to the statement cache.PreparedStatementCacheCurrentSize The number of prepared and callable statements currentlycached in the statement cache.PreparedStatementCacheDeleteCount The number of statements discarded from the cache.PreparedStatementCacheHitCount The number of times that statements from the cache were used.APPENDIX A. REFERENCE MATERIAL PreparedStatementCacheMissCount The number of times that a statement request could not besatisfied with a statement from the cache.A.2. RESOURCE ADAPTER STATISTICSTable A.3. Resource Adapter StatisticsActiveCount The number of active connections. Each of the connections is either in use by anapplication or available in the poolAvailableCount The number of available connections in the pool.AverageBlockingTime The average time spent blocking on obtaining an exclusive lock on the pool. Thevalue is in milliseconds.AverageCreationTime The average time spent creating a connection. The value is in milliseconds. CreatedCount The number of connections created.DestroyedCount The number of connections destroyed.InUseCount The number of connections currently in use.MaxCreationTime The maximum time it took to create a connection. The value is in milliseconds. MaxUsedCount The maximum number of connections used.MaxWaitCount The maximum number of requests waiting for a connection at the same time. MaxWaitTime The maximum time spent waiting for an exclusive lock on the pool.TimedOut The number of timed out connections.TotalBlockingTime The total time spent waiting for an exclusive lock on the pool. The value is inmilliseconds.TotalCreationTime The total time spent creating connections. The value is in milliseconds.WaitCount The number of requests that had to wait for a connection.A.3. IO SUBSYSTEM ATTRIBUTESRed Hat JBoss Enterprise Application Platform 7.1 Performance Tuning GuideAPPENDIX A. REFERENCE MATERIAL。
COBOT用户手册 V2.7

C/C++代码静态分析工具COBOT用户手册(V2.7)北京大学软件工程国家工程中心北京北大软件工程发展有限公司2015年02月目录1 系统说明 (3)1.1 系统架构 (3)1.2 系统界面 (4)1.3 检测流程 (6)2 缺陷检测 (7)2.1 用户登录 (7)2.1.1 管理员身份登录 (7)2.1.2 普通用户身份登录 (10)2.2 新建项目 (10)2.2.1 项目创建 (10)2.2.2 编译选择 (11)2.2.2 属性修改 (13)2.3 导入程序 (14)2.4 检测设置 (18)2.4.1 检测配置 (18)2.4.2 缺陷检测配置 (19)2.4.3 度量分析配置 (22)2.4.4 定时检测配置 (22)2.5 检测分析 (25)2.5.1 缺陷检测 (25)2.5.2 度量分析 (28)2.6 问题追踪 (29)2.7 结果导出 (33)2.8 记录查看 (33)3 环境配置 (35)3.1 基本环境要求 (35)3.2 分批检测说明 (35)1系统说明COBOT4C V2.7是由北京北大软件工程发展有限公司和北京大学软件工程国家工程研究中心联合研发的一种C程序静态分析工具,采用全新的静态分析框架,可以有效地降低误报率和漏报率。
1.1系统架构图1-1系统具有以下特点:(1)检测能力强提供统一的、可视化的集成环境,直接对代码缺陷和违反规则情况进行可配置、一体化检测。
特别为我国相关编码标准提供支持,并对经常出现指针、库函数、数值等类缺陷进行增强检测。
(2)检测精度高采用值依赖分析、指向分析、抽象解释和约束求解等众多新技术,有效地降低了缺陷的误报率和漏报率。
(3)检测效率高千行代码检测速度基本在秒级左右,对数十万行的程序,可以在30分钟内检测完毕,远快于同类产品。
(4)灵活配置用户可以根据需求,对缺陷规则以及度量分析的进行灵活选择、配置。
(5)操作简洁系统检测流程清晰,操作过程简单易懂,系统提供各种友好的操作提示,辅助用户开展代码检测工作。
NXP NTM88应用库用户指南说明书
UM11589NTM88 Application Library User GuideRev. 1 — 22 March 2021User guideNTM88 Application Library User GuideNTM88 Application Library User Guide 1Introduction and usageThis document describes functions included in the application library for the NTM88series. The functions available in this library provide access to Free Running Counter(FRC). The library functions are to be used in addition and together with the existingTPMS firmware functions.The library version is compatible with all part numbers of the NTM88 family.2Library organizationThe library is provided as a library code file and a header file containing the functionprototypes. The files are listed below:•NTM88_AppLib_vxxx.lib - library code file•NTM88_AppLib_vxxx.h - functions prototypes header file3Description of library functionsThere are five functions to access the Free Running Counter (FRC):•NTM88_E_FRC_ENABLE(…) – enable FRC,•NTM88_E_FRC_CLEAR() – clear FRC,•NTM88_E_FRC_READ(…) – read FRC count,•NTM88_E_FRC_DISABLE() – disable FRC,•NTM88_E_FRC_CALIB(…) – calibrate FRC.The following sections provide detailed descriptions of the functions.3.1void TPMS_E_FRC_ENABLE (UINT8 u8ClrRes)Description: This function enables the Free Running Counter.Stack Usage: 2 bytesApprox. Duration: 1.3 msPower management: This function executes entirely in RUN.Resources: FRC.Input Parameters:•UINT8 u8ClrRes – clear or not the FRC counter:•0 – clear the FRC counter,•not 0 – FRC counter is not cleared.Returns: void.NTM88 Application Library User Guide3.2void TPMS_E_FRC_CLEAR (void)Description: This function clears the FRC counter register.Stack Usage: 0 bytesApprox. Duration: 9 µsPower management: This function executes entirely in RUN.Resources: FRC.Input Parameters: void.Output Parameters: void.3.3void TPMS_E_FRC_READ (UINT16 *pu16Count)Description: This function reads the FRC counter register.Stack Usage: 2 bytesApprox. Duration: 10 µsPower management: This function executes entirely in RUN.Resources: FRC.Input Parameters:•UINT16 *pu16Count - pointer to memory location to save the FRC count.Output Parameters: void.3.4void TPMS_E_FRC_DISABLE (void)Description: This function disables the Free Running Counter.Stack Usage: 0 bytesApprox. Duration: 1 msPower management: This function executes entirely in RUN.Resources: FRC.Input Parameters: void.Output Parameters: void.NTM88 Application Library User Guide3.5UINT8 TPMS_E_FRC_CALIB (UINT16 *pu16usPerPrdDescription: This function measures the number of micro seconds per LFO period,which corresponds to the time for the Free Running Counter to increment twice.Stack Usage: 18 bytesApprox. Duration: 8.2 msPower management: This function executes entirely in RUN.Resources: This function uses the FRC block, the timer module TPM1, and the 500 kHz reference clock generated by RF module. On entry, it expects that TPM1 module is inreset state in free-running timer counter mode with modulo counting disabled. Beforeexiting, function disables TPM1 and RF module, and keeps the FRC enabled.Input Parameters:•UINT16 *pu16usPerPrd - pointer to memory location to save number of micro seconds per LFO period.Output Parameters:•UINT8 u8Status - status/error flag:•0 – valid value returned in *pu16usPerPrd•not 0 – timeout, contents of *pu16usPerPrd is not valid.NTM88 Application Library User Guide 4Legal information4.1 DefinitionsDraft — A draft status on a document indicates that the content is still under internal review and subject to formal approval, which may resultin modifications or additions. NXP Semiconductors does not give any representations or warranties as to the accuracy or completeness of information included in a draft version of a document and shall have no liability for the consequences of use of such information.4.2 DisclaimersLimited warranty and liability — Information in this document is believed to be accurate and reliable. However, NXP Semiconductors does notgive any representations or warranties, expressed or implied, as to the accuracy or completeness of such information and shall have no liabilityfor the consequences of use of such information. NXP Semiconductors takes no responsibility for the content in this document if provided by an information source outside of NXP Semiconductors. In no event shall NXP Semiconductors be liable for any indirect, incidental, punitive, special or consequential damages (including - without limitation - lost profits, lost savings, business interruption, costs related to the removal or replacement of any products or rework charges) whether or not such damages are based on tort (including negligence), warranty, breach of contract or any other legal theory. Notwithstanding any damages that customer might incur for any reason whatsoever, NXP Semiconductors’ aggregate and cumulative liability towards customer for the products described herein shall be limited in accordance with the Terms and conditions of commercial sale of NXP Semiconductors.Right to make changes — NXP Semiconductors reserves the right to make changes to information published in this document, including without limitation specifications and product descriptions, at any time and without notice. This document supersedes and replaces all information supplied prior to the publication hereof.Suitability for use — NXP Semiconductors products are not designed, authorized or warranted to be suitable for use in life support, life-critical or safety-critical systems or equipment, nor in applications where failure or malfunction of an NXP Semiconductors product can reasonably be expected to result in personal injury, death or severe property or environmental damage. NXP Semiconductors and its suppliers accept no liability for inclusion and/or use of NXP Semiconductors products in such equipment or applications and therefore such inclusion and/or use is at the customer’s own risk.Applications — Applications that are described herein for any of these products are for illustrative purposes only. NXP Semiconductors makesno representation or warranty that such applications will be suitablefor the specified use without further testing or modification. Customersare responsible for the design and operation of their applications and products using NXP Semiconductors products, and NXP Semiconductors accepts no liability for any assistance with applications or customer product design. It is customer’s sole responsibility to determine whether the NXP Semiconductors product is suitable and fit for the customer’s applications and products planned, as well as for the planned application and use of customer’s third party customer(s). Customers should provide appropriate design and operating safeguards to minimize the risks associated withtheir applications and products. NXP Semiconductors does not accept any liability related to any default, damage, costs or problem which is basedon any weakness or default in the customer’s applications or products, or the application or use by customer’s third party customer(s). Customer is responsible for doing all necessary testing for the customer’s applications and products using NXP Semiconductors products in order to avoid a default of the applications and the products or of the application or use by customer’s third party customer(s). NXP does not accept any liability in this respect.Export control — This document as well as the item(s) described herein may be subject to export control regulations. Export might require a prior authorization from competent authorities.Evaluation products — This product is provided on an “as is” and “with all faults” basis for evaluation purposes only. NXP Semiconductors, its affiliates and their suppliers expressly disclaim all warranties, whether express, implied or statutory, including but not limited to the implied warranties ofnon-infringement, merchantability and fitness for a particular purpose. The entire risk as to the quality, or arising out of the use or performance, of this product remains with customer. In no event shall NXP Semiconductors, its affiliates or their suppliers be liable to customer for any special, indirect, consequential, punitive or incidental damages (including without limitation damages for loss of business, business interruption, loss of use, loss of data or information, and the like) arising out the use of or inability to usethe product, whether or not based on tort (including negligence), strict liability, breach of contract, breach of warranty or any other theory, even if advised of the possibility of such damages. Notwithstanding any damages that customer might incur for any reason whatsoever (including without limitation, all damages referenced above and all direct or general damages), the entire liability of NXP Semiconductors, its affiliates and their suppliers and customer’s exclusive remedy for all of the foregoing shall be limited to actual damages incurred by customer based on reasonable reliance up to the greater of the amount actually paid by customer for the product or five dollars (US$5.00). The foregoing limitations, exclusions and disclaimers shall apply to the maximum extent permitted by applicable law, even if any remedy fails of its essential purpose.Translations — A non-English (translated) version of a document is for reference only. The English version shall prevail in case of any discrepancy between the translated and English versions.Security — Customer understands that all NXP products may be subjectto unidentified or documented vulnerabilities. Customer is responsiblefor the design and operation of its applications and products throughout their lifecycles to reduce the effect of these vulnerabilities on customer’s applications and products. Customer’s responsibility also extends to other open and/or proprietary technologies supported by NXP products for usein customer’s applications. NXP accepts no liability for any vulnerability. Customer should regularly check security updates from NXP and follow up appropriately. Customer shall select products with security features that best meet rules, regulations, and standards of the intended application and make the ultimate design decisions regarding its products and is solely responsible for compliance with all legal, regulatory, and security related requirements concerning its products, regardless of any information or support that may be provided by NXP. NXP has a Product Security Incident Response Team (PSIRT)(************************)thatmanagestheinvestigation, reporting, and solution release to security vulnerabilities of NXP products.4.3 TrademarksNotice: All referenced brands, product names, service names and trademarks are the property of their respective owners.NXP — wordmark and logo are trademarks of NXP B.V.NTM88 Application Library User GuideContents1Introduction and usage (3)2Library organization (3)3Description of library functions (3)3.1void TPMS_E_FRC_ENABLE (UINT8u8ClrRes) (3)3.2void TPMS_E_FRC_CLEAR (void) (4)3.3void TPMS_E_FRC_READ (UINT16*pu16Count) (4)3.4void TPMS_E_FRC_DISABLE (void) (4)3.5UINT8 TPMS_E_FRC_CALIB (UINT16*pu16usPerPrd (5)4Legal information (6)Please be aware that important notices concerning this document and the product(s)described herein, have been included in section 'Legal information'.。
代码静态检查工具与应用介绍

代码静态检查工具与应用介绍代码的质量直接关系到软件的性能和可靠性。
为了提高代码质量,开发人员常常采用代码静态检查工具来检测潜在的代码缺陷和错误。
本文将介绍常用的代码静态检查工具及其应用,帮助读者更好地理解和应用这些工具。
一、什么是代码静态检查工具?代码静态检查工具是一类软件工具,通过扫描源代码来检查潜在的编程错误、不合规范的代码和潜在的安全隐患。
它可以在代码编写的早期发现问题,帮助开发人员提前修复错误,从而提高代码质量。
二、常用的代码静态检查工具1. FindBugs:FindBugs是一个基于Java字节码的静态分析工具,用于查找Java程序中的潜在缺陷。
它可以检测出空指针引用、资源未释放、不必要的对象创建等问题,并提供详细的问题报告。
2. PMD:PMD是一个针对Java源代码的静态规则检查工具。
它可以帮助开发人员发现代码中的潜在问题,如未使用的变量、无效的方法重写、复杂的表达式等。
PMD提供了多种规则,可以根据项目需求进行配置和定制。
3. ESLint:ESLint是用于JavaScript代码的静态检查工具,它能帮助开发人员发现代码中的潜在问题并提供修复建议。
ESLint支持可配置的规则集,可以根据项目需求进行灵活的配置。
4. Checkstyle:Checkstyle是一个用于Java代码的静态规则检查工具。
它可以帮助开发人员遵循编码规范,并提供统一的代码风格。
Checkstyle支持自定义规则和可配置的检查选项,以满足项目的需求。
三、代码静态检查工具的应用1. 代码质量控制:代码静态检查工具能够帮助开发人员发现代码缺陷和不规范的编码风格,并及时提供修复建议。
通过使用这些工具,可以规范代码质量,提高代码的可读性和可维护性。
2. 安全漏洞检测:代码静态检查工具能够帮助开发人员发现潜在的安全隐患,如SQL注入、跨站脚本攻击等。
通过及时修复这些问题,可以提高软件的安全性和可靠性。
3. 性能优化:代码静态检查工具还可以检测不合理的代码结构和低效的算法,帮助开发人员发现性能瓶颈,并提供相应的优化建议。
升级服务项目方案0420[2]
![升级服务项目方案0420[2]](https://img.taocdn.com/s3/m/c0f249e67cd184254a3535c8.png)
信息系统运维、升级服务项目方案1、项目名称:信息系统运维、升级服务2、项目概括:为保障各处室业务系统的正常运行,需要采购服务对各信息系统进行技术维护、信息更新及升级改造。
现申请对信息系统运维、升级服务项目进行政府采购。
3、项目详情:A、服务要求:提供各信息系统技术维护、信息更新及升级改造。
B、项目内容:(一)山东导游网技术维护及信息更新山东导游网正式上线于2014 年,是经山东省旅游局批准专门从事山东导游服务的网站,网站利用现代网络技全面实现导游员资格考试、年审培训、及日常业务办理的网络化与信息化,同时为广大导游员和游客提供最新资讯、导游词、经验交流、法律法规等行业知识与交流互动平台。
1、总体运维内容(1)各功能板块的运维启用利用现有资源,做好现有的通知公告、新闻资讯、培训园地、导游协会、视频资料、旅游达人、导游词、导游主页等版块的运维,同时实现各版块功能的有效启用,发挥其功能职责。
(2)日常更新维护对通知公告、新闻资讯、培训园地、导游协会、视频资料、旅游达人、导游词、导游主页等模块内容做好更新。
根据内容的重要程度更新频次可分为、每日更新、每周更新、月底更新、季度更新。
(3)增加项目根据我单位工作业务需要,增加必要的项目开发,完善网站功能与实用性。
2、网站正常维护工作(1)网站主页的协调性利用后台对网站的框架和信息等进行相应的调整,根据工作需要不定期的对网站进行整形修改,板块的调整,对网站进行优化美化,保持整个网站的协调性,美观大方。
(2)栏目修改在原有栏目的基础上,根据工作需要对栏目进行功能性的增加、修改、调整等工作。
由于信息更新比较频繁,内容的发布比较多,包括通知公告、图片新闻等,在信息发布模块要使用便捷好用的信息编辑器,能够对数码照片进行剪辑和适当的分辨率修改,新闻编辑,文字的大小格式段落格式,保持整体的大方美观。
(3)静态页的生成与搜索优化为了更好的被搜索引擎收录相关信息,网站需要不定期的进行页面的静态化以适合搜索引擎收录,尤其是早期的搜索引擎。
第五章:静态网格物体
第五章:静态网格物体文档摘要:由于本书正在完善中,故本节内容可能在全书出版的过程中发生变化。
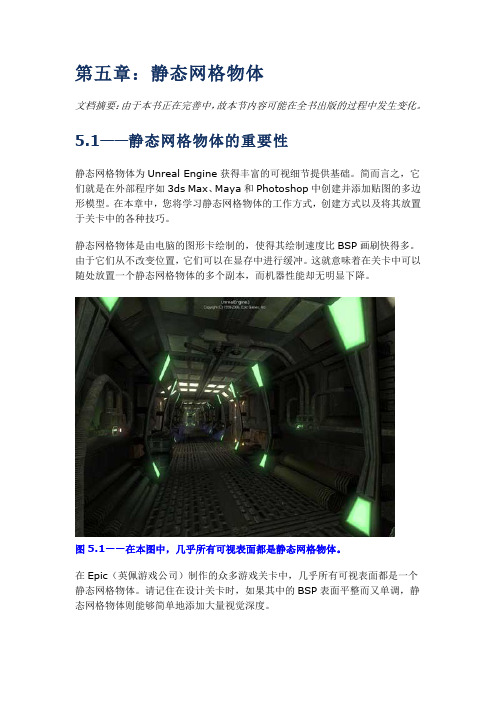
5.1——静态网格物体的重要性静态网格物体为Unreal Engine获得丰富的可视细节提供基础。
简而言之,它们就是在外部程序如3ds Max、Maya和Photoshop中创建并添加贴图的多边形模型。
在本章中,您将学习静态网格物体的工作方式,创建方式以及将其放置于关卡中的各种技巧。
静态网格物体是由电脑的图形卡绘制的,使得其绘制速度比BSP画刷快得多。
由于它们从不改变位置,它们可以在显存中进行缓冲。
这就意味着在关卡中可以随处放置一个静态网格物体的多个副本,而机器性能却无明显下降。
图5.1——在本图中,几乎所有可视表面都是静态网格物体。
在Epic(英佩游戏公司)制作的众多游戏关卡中,几乎所有可视表面都是一个静态网格物体。
请记住在设计关卡时,如果其中的BSP表面平整而又单调,静态网格物体则能够简单地添加大量视觉深度。
5.2——静态网格物体工作流概述创建静态网格物体的方法不胜枚举。
据此,我们将缩小其范围,变为两个主要的工作流。
这两个工作流可以用以下流程图进行描述:图5.2——本流程图描述了两种常用的静态网格物体设计方法。
第一个工作流包括了创建高分辨率或者高多边形网格形式的静态网格物体,稍后将该网格物体制成一个法线贴图。
此技术允许建模者能够创建极其丰富的物体表面细节。
一旦完成此高分辨率网格物体,一个较低分辨率的模型也同时创建。
此低分辨率的网格物体将是游戏中实际显示的,但还是运用了相应的高分辨率物体生成的法线。
第二个工作流仅需要一个低分辨率的网格物体。
与建立一个高分辨率网格物体模型来创建法线相反,法线贴图生成于灰度凹凸贴图,在Photoshop中可使用nVidia的免费插件生成。
用于将高度图转换为法线贴图的免费插件在PaintShop Pro与GIMP中也存在,通过Internet可以快速搜索到。
如果您的静态网格物体相当简单,则会发现相对于为关卡中的每一网格物体创建高分辨率几何体而言,此方法可以为您节约相当可观的时间。
Pipelinestudio(Tgnet)应用指南
精心整理Pipelinestudio (Tgnet )应用指南1 软件特点及主要用途Pipelinestudio (Tgnet )是经过使用证明的,历史悠久的输气体管道离线模拟软件,能够对管道的正常工况和事故工况进行稳态和动态分析,测试和评价管道的输送/改建/扩建方案,最终获得优化的系统性能和最佳的实际方案最终1234562 度。
特别是在不稳定流动的情况(输气管大多数处于不稳定流动状态)下,更导致压力、流量和温度的变化。
因此,描述气体管内流动状态的主要参数有:压力P 、密度?、流速v 和温度T 。
求解有关参数的方程主要是:连续性方程:其中:0;0≥≤≤t L x●运动方程:其中:;0≥≤≤tLx●能量守恒方程:以上方程中符号意义如下:L管道长度g重力加速度x距离f摩阻系数t时间Di管道内径AρPvh●?状态方程。
1)理想气体的状态方程理想气体的状态方程通用气体状态方程为:RTZPρ=状态方程规定:压缩系数Z是压力和温度的函数理想气体没有考虑实际气体中分子的大小和分子间的作用力,范德瓦尔斯状方程中b是对分子体积作出的修正,a 是对分子间作用力作出的修正。
2)真实气体的状态方程(1)SaremSarem 状态方程是一个老的状态方程。
它解决了在通用气体状态方程中,在通常输气管道的条件下,如何计算压缩系数的问题。
它使用对比压力和对比温度(天然气的压力、温度与其临界压力、临界温度之比)的概念,用勒让德多项式计算压缩系数。
其中对比压力和对比温度是基于虚拟临界压力和虚拟临界温度的近似值。
以相对密度为基础计(2(3SRK(4)Peng范德瓦尔斯方程在一定范围内已经能比较接近的描述实际气体的性质,但是它没有考虑温度和偏心因子的影响,因而适用范围有限,Peng-Robinson 是在考虑了上述因素后由范德瓦尔斯方程派生出的方程:Peng 方程的优点是:在较大的压力、温度范围内都比较精确;在相变区或相变区附近也比较精确;可以作气体组分跟综;计算量少于BWRS。
KWCMS系统
谢谢观看
ห้องสมุดไป่ตู้
技术领域
技术领域
1.基于J2EE技术开发,继承其强大、稳定、安全、高效、跨平台等多方面的优点。J2EE核心是一组技术规 范与指南,其中所包含的各类组件、服务架构及技术层次,均有共通的标准及规格,让各种依循J2EE架构的不同 平台之间,存在良好的兼容性,解决过去企业后端使用的信息产品彼此之间无法兼容,,企业内部或外部难以互通 的窘境。
2.采用Struts+Hibernate+Spring技术架构
典型的J2EE三层结构,分为表现层、中间层(业务逻辑层)和数据服务层。
功能介绍
功能介绍
1.人性化的信息采编
KWCMS的内容录入界面充分考虑内容维护人员的实际情况,他们可能不精通HTML,但他们会使用Word等办公 软件,因此,系统界面与Word等Office产品紧密集成,可直接从Word里拖动一块内容到KWCMS中来。如果Word中 包括图片、表格等内容,则系统自动上传图片等文件,完全无需人工干预,并可批量导入Word、PowerPoint、 Excel、JPG、GIF文件,并支持自动分页,自动清理HTML,自动排版。
J2EE为搭建具有可伸缩性、灵活性、易维护性的商务系统提供了良好的机制。J2EE能够开发部署在异构环 境中的可移植程序。基于J2EE的应用程序不依赖任何特定操作系统、中间件、硬件。因此设计合理的基于J2EE的 程序只需开发一次就可部署到各种平台。这在典型的异构企业计算环境中是十分关键的。J2EE标准也允许客户订 购与J2EE兼容的第三方的现成的组件,把他们部署到异构环境中,节省了由自己制订整个方案所需的费用。
J2EE体系结构提供中间层集成框架用来满足无需太多费用而又需要高可用性、高可靠性以及可扩展性的应用 的需求。通过提供统一的开发平台,J2EE降低了开发多层应用的费用和复杂性,同时提供对现有应用程序集成强 有力支持,完全支持Enterprise JavaBeans,有良好的向导支持打包和部署应用,添加目录支持,增强了安全 机制,提高了性能。
JEECMS系统使用手册2012-07美化版
系统使用说明书江西金磊科技发展有限公司2012-07第一章系统简介 (4)第二章环境搭建 (5)第三章后台管理篇 (6)1.后台管理登录 (6)2.后台管理界面简介 (7)3.首页 (7)4.栏目 (8)5.内容 (13)6.模版 (24)7.资源 (25)8.辅助 (26)9.维护 (35)10.生成 (37)11.用户 (41)12.配置 (48)13.统计 (54)第四章系统标签说明 (55)1.[@PROCESS_TIME/] (55)2.[@CMS_PAGINATION/] (55)3.[@CMS_CHANNEL_LIST] (56)4.[@CMS_CHANNEL] (57)5.[@CMS_COMMENT_LIST] (59)6.[@CMS_COMMENT_PAGE] (60)7.[@CMS_TOPIC_LIST] (62)8.[@CMS_TOPIC_PAGE] (63)9.[@CMS_VOTE] (64)10.[@CMS_C ONTENT] (66)11.[@CMS_CONTENT_LIST] (67)12.[@CMS_CONTENT_PAGE] (70)13.[@CMS_GUESTBOOK_LIST] (72)14.[@CMS_I NCLUDE] (73)15.[@CMS_LUCENE_LIST] (73)16.[@CMS_LUCENE_PAGE] (75)17.[@CMS_TAG_LIST] (77)18.[@CMS_CUT ] (78)第五章常用的一些标签 (80)1.页面处理时间标签: (80)2.页面模板包含标签: (80)3.常用链接地址: (80)4.根据栏目路径、ID调用栏目名及链接: (80)5.栏目列表标签: (80)6.子栏目列表 (80)7.文章列表 (81)8.默认文章缩略图调用 (81)9.字符串长度截断标签 (81)10.最上级栏目标签 (81)11.栏目节点列表标签(用于获取页面导航路径) (82)12.TAG列表标签: (82)第一章系统简介JEECMS是JavaEE版网站管理系统(Java Enterprise Edition Content Manage System)的简称。
vantiq 开发者指导手册
vantiq 开发者指导手册第一章简介Vantiq 是一款全面而强大的开发平台,旨在帮助开发者轻松构建实时、智能且联网的应用程序。
本指导手册将带领您深入了解如何使用Vantiq 平台进行开发工作,并提供了一系列详细的步骤和示例来帮助您快速上手。
第二章安装和配置在开始使用 Vantiq 之前,您需要正确地进行安装和配置。
以下是详细的步骤:1. 下载和安装 Vantiq 客户端。
您可以从 Vantiq 官方网站上找到最新的客户端版本,并按照指示进行安装。
2. 配置 Vantiq 客户端。
在第一次运行客户端时,您需要输入您的帐户信息并进行身份验证。
根据系统提示,填写相关信息以完成配置。
第三章 Vantiq 开发基础在本章中,您将学习 Vantiq 开发的基础知识。
以下是一些关键概念和技术:1. Vantiq 模型:Vantiq 使用模型来表示实时应用程序的结构和组件。
了解如何创建和定义模型是开始 Vantiq 开发的第一步。
2. Vantiq 流程:Vantiq 提供了流程引擎来处理和管理应用程序中的业务流程。
通过学习如何创建和配置流程,您可以更好地掌握应用程序的逻辑和流程控制。
3. Vantiq 数据存储:Vantiq 允许您使用不同的数据存储选项,如关系型数据库或 NoSQL 数据库,来存储和管理应用程序的数据。
了解如何配置和使用数据存储是非常重要的。
第四章 Vantiq 集成Vantiq 平台提供了多种集成选项,以便您能够将应用程序与其他系统进行连接。
以下是一些常见的集成方式:1. API 集成:Vantiq 允许您使用 API 来与其他系统进行通信和数据交换。
您可以学习如何创建和配置 API 对接点,以及如何使用 API 来获取和发送数据。
2. 设备集成:Vantiq 提供了各种设备集成选项,包括传感器、物联网设备等。
通过了解如何配置和管理设备集成,您可以实现实时监测和控制。
3. 第三方应用集成:Vantiq 还支持与第三方应用程序(如CRM、ERP等)的集成。
- 1、下载文档前请自行甄别文档内容的完整性,平台不提供额外的编辑、内容补充、找答案等附加服务。
- 2、"仅部分预览"的文档,不可在线预览部分如存在完整性等问题,可反馈申请退款(可完整预览的文档不适用该条件!)。
- 3、如文档侵犯您的权益,请联系客服反馈,我们会尽快为您处理(人工客服工作时间:9:00-18:30)。
网页静态化引擎应用指南
1. 概述
开发人员只需要关心模板的编写语法、包含关系的设置方式、数据获取接口参数的设置
方法和如何调用发布任务的接口,生成这一部分是又系统自动根据开发人员以上操作的
描述,自动定时循环产看处理。
以下是整个应用过程的图示:
开发人员
系统引擎
网站用户
编写并创建模板编辑模板包含关系编辑模板数据获取参数
调用任务发布接口
自动生成
查看页面
2. 技术要求
HTML
JavaScript
Velocity:该框架是基于j2ee的一套前台模板引擎,该引擎在java中定义,并执行
生成,在视图文件中定义了程序逻辑的编写语法,可直观的使用习惯的开发方式,
编写视图中的逻辑用来显示数据,静态化引擎的使用过程中不需要关系模板的定义
和生成(这一部分由系统自动完成),只需要在模板中编写相应的逻辑,用于显示,
这里具体使用语法请参照:
【公司内部论坛velocity语法说明】
【Velocity语法说明】
Java EE
Ibatis 获取数据结果的时候用到
BrickFremework:公司内部框架,需要导入“brick.jar”的支持
3. 开发步骤
3.1.1. 模板
一、编写模板
a) HTML: 按照正常的HTML代码编写即可
b) Javascript :按照正常习惯编写即可
c) 数据展现:由服务器端产生的输出数据,需要使用velocity代码去做数据呈现,参
照velocity视图逻辑语法,编写代码逻辑如下图:
依据上图表名,实际velocity 和普通的程序逻辑是相类似的,我们只需要花很短的
时间学习语法,就可以如鱼得水的开发模板了
d) 模板的嵌入,如图:
e) 分页:在模板中,开发者只需要将以下代码复制到页面中,其他计算填充由系统自
动完成,编码者只两个步骤,便可以轻松完成分页
i. 在head中导入JS文件:
1. 代码块:
2. 图示:
ii. 复制以下代码到页面
体中:1. 代码块:
首页
上一页
下一页
尾页
跳转到 第页
2. 图示
3. 注意:其中汉字、样式都可以更改,标签体、id、参数名不能修改,以“$”
和“#”开头参数,均为框架定义的固定有意义参数,不可修改
二、创建模板
a) 进入模板创建功能:
1、 登录进入“西安科技大市场”后台管理界面2、左侧菜单“静态化发布系
统”3、进入“页面管理”—>点击”添加”按钮
2、 模板字段说明:
i. 数据类型:页面模板载入数据信息所属的数据类型
ii. 页面类型:可分为以下几种形式,单页、列表、频道、碎片
iii. 模板路径:当条页面数据生成物理模板文件存放的地址
iv. 模板内容:开发人员编写的模板代码
v. 静态路径:生成的HTML静态文件的存放位置和名称
1. 以完整名称结尾:生成与该路径相等的文件名称,如
test/test.html ,那么生成后存放至 webroot/html/test/test.html
文件
2. 以“/”结尾:系统认为该路径是一个文件夹,有两种情况,
情况一:“单页”的情况下话系统会默认将文件的路径生成
为,路径+/年/月/日/信息ID.html,如 现在发布一条 ID为
“343DF2v54Ge2541DCFE”的信息
三、创建包含关系
包含关系,实际上就是指,多个页面中互相 #include 的关系描述,使用视图操作的形
式,创建或修改包含关系的描述
a) 操作方法:登录进入“西安科技大市场”后台管理界面2、左侧菜单“静态化发
布系统”3、进入“页面管理” 选择指定的页面数据点击”数据参数设置”
按钮进入“页面包含关系”页面
i. 设置父页面:点击“设置父页面”在页面列表中选择对应的父页面返回
ii. 设置子页面:点击“设置子页面”在页面列表中选择对应的子页面页面返
回
四、编写数据参数
a) 描述:页面参数是用来指向数据获取的接口,可以是sql语句,也可以是获取结果
集的“java方法”名,也可以是一个固定的值,在生成页面的过程中,静态引擎会
直接根据现有的参数描述,执行相应的操作获取结果集,输出到前段模板中
b) 操作方法:登录进入“西安科技大市场”后台管理界面2、左侧菜单“静态化发
布系统”3、进入“页面管理” 选择指定的页面数据点击”数据参数设置”
按钮进入“数据参数设置”页面点击“添加“按钮
模板载入数据类型
模板文件保
存的路径
HTML生成
存放路径
c) 参数说明:
i. 参数名称
ii. 参数代码:获取的结果集,返回到页面时的参数名称,如 参数代码设置为
“list”那么在页面中获取参数则需要这么获取pageParam. list
iii. 参数类型:
1. 单个参数:指向一条SQL语句的ID,只可以执行返回一个对象的结果,sql
是基于ibatis框架编写规则,所以必须按照ibatis的sqlMap映射文件的格
式编写,以及导入
2. 列表参数:与单个参数相同,不同的是他可以返回多行数据,即多个对象
组成的结果集
3. 方法参数:调用java方法
4. 固定参数:自定义的字符串值,在页面中可取到
iv. 实例说明:sql是基于ibatis框架编写规则,所以必须按照ibatis的sqlMap映
射文件的格式编写,以及导入
1. Sql文件存放目录:必须存放在classes/config/目录下,如:
2. sql内容则为如下图
3. 页面模板中获取代码
五、生成模板
a) 操作方法:登录进入“西安科技大市场”后台管理界面2、左侧菜单“静态化发
布系统”3、进入“页面管理” 选择指定的页面数据点击“页面模板生成”
按钮
3.1.2. 调用任务接口
调用的方法:String id, String code,String state,IBaseDAO db)
参数:
Id :发布数据的主键ID
Code:数据类型的代码(见:静态发布系统—>数据代码)
State:任务类型 【1:发布,2、撤销】
Db:数据源对象
调用方法如图:
4. 系统自动处理
系统自动生成,开发人员不需要关心
5. 查看
所有生成的文件均生成在webRoot/html/HTML路径下,可以在TOMCAT中找到相应的
文件夹,通过HTTP的方式访问,如:
HTML文件物理路径:tomcat_Path/webapps/trm/html/test/test.html
地址栏则输入:http://主机:端口/trm/html/test/test.html