考研英语大作文图表作文范文及模板
考研英语大作文模板(通用版)
考研英语大作文模板(通用版)英语一考图画,英语二考图表,因此他们的首段是有区别的,但是功能句都是可以通用的,因此本次分享分为三个部分。
部分(1)介绍英语一首段模板部分(2)介绍英语二首段模板部分(3)介绍通用写作功能句(小作文同样适用)第一部分英语一首段模板:【模板说明】:(1)加深字体为模板的“功能句”,即背下来直接写上就可以。
(2)划线句为根据图片内容进行描述,需自行填充。
【句子说明】:1,This is a simple but thought-provoking cartoon.“这是一幅简单而启人深思的漫画”万用开头。
2,描述图画(1)要求:简明扼要地描述图画中的人物、动作、环境、文字等(文字见下句)。
(2)可能会用到的句型:①There be 句型:引出人物或图画主体。
例如,there is a little boy (有一个小男孩)。
②with引导的定语从句,用以补充说明图画主体的动作、神情、状态等,即with+主体状态、动作、神情:例如,there is a little boy with smile(这有一个小男孩,他微笑着);更加复杂一点的例如,there is a little boy,with a huge phone in his hand.(一个小男孩手里拿着巨大的手机)③动词ing形式引导的定语从句,功能与②相同,可用来丰富句型。
例如,there is a little boy ,yelling at his parents,with a huge phone in his hand。
(小男孩拿着巨大的手机,并对他的父母大喊大叫。
)④如果图片为一组图片且构成对比时,需要表达出这种对比关系,可用的句型为although it\she\he——————,the ——(主体人物或事物)————。
:例如,although he is small and thin,the brave man decide to challenge the man stronger than him(虽然他又小又瘦,但这个勇敢的男人决定挑战比他强壮的人)3,Eventually, several Chinese characters can be noticed, which say that___________________________.最后,一些汉字写道:———————————.描述汉字。
英文考研作文图表
英文考研作文图表1. The bar chart shows the number of people indifferent age groups who use smartphones. As we can see, the highest percentage of smartphone users falls in the age group of 18-24, accounting for approximately 40% of the total. This indicates that young adults are the most active users of smartphones.2. The line graph illustrates the trend of average global temperature over the past century. It is evidentthat there has been a gradual increase in temperature over the years. This suggests that climate change is a pressing issue that needs to be addressed urgently.3. The pie chart displays the distribution of household expenses in a typical urban family. It is clear that the largest proportion of the budget is spent on housing, followed by transportation and food. This highlights the importance of these basic necessities in our daily lives.4. The scatter plot depicts the relationship between hours spent studying and exam scores. Interestingly, there seems to be no clear correlation between the two variables. This suggests that factors other than studying time may influence academic performance.5. The table presents data on the top five countries with the highest GDP growth rates in the past year. It is notable that all of these countries are emerging economies. This demonstrates their potential for rapid economic development.6. The line graph shows the fluctuation in oil prices over a five-year period. It is evident that there have been significant fluctuations in prices, with a sharp increase in 2014 followed by a gradual decline. This indicates the volatility of the oil market.7. The bar chart compares the literacy rates of different countries. It is clear that developed countries have higher literacy rates than developing countries. This highlights the importance of education in promoting socialand economic development.8. The pie chart illustrates the distribution of online shopping preferences by product category. It is evidentthat electronics and clothing are the most popular categories, while books and groceries are less commonly purchased online. This reflects changing consumer behaviorin the digital age.9. The scatter plot displays the relationship between income and happiness levels. Surprisingly, there seems tobe a weak correlation between the two variables. This suggests that factors other than financial well-being contribute to overall happiness.10. The table presents data on the number ofinternational tourists visiting different countries. It is evident that France attracts the highest number of tourists, followed by Spain and the United States. This highlightsthe popularity of these destinations among travelers.。
考研英语图表类作文

考研英语图表类作文考研英语图表类作文图表类的英语作文我们很早就已经接触过了,所以在考研中也应该没问题才是。
下面是店铺给大家整理的考研英语图表类作文,供大家参阅!考研英语图表类作文:Global E-commerce turnover全球电子商务成交额Global E-commerce turnoverFrom the curve chart given above, we can observe that the turnover of global E-commerce experienced some change during the past several years. From 1997 to 2005, itrose dramatically from 20 billion to 900 billion.The curve chart reveals that the global E-commerce industry enjoys an explosivegrowth. Quite a few reasons can be listed to account for this phenomenon, and the followingsmight be the most critical ones: for one thing, the authorities of different countries haveissued some preferential policies to protect and encourage the development of E-commerce,thus quite a few online-transaction websites emerge overnight. Moreover, the one-click-payment consumption mode has been widely accepted by the public thanks to thewidespread availability of the Internet. Last but not least, peopl e’s decision to purchaseon-line can also be put down to the power of so-called “group-dynamics”: when our friends areshopping at network, we will be influenced by them and imitate their behaviors unconsciously.The rapid development of E-commerce signals that new business models contributelargely to the sustainable development of the global economy. However, when enjoying thefruits offered by modern technology, we should also keep aneye on the underlying threat ofit. In a world features open boundary, deception and fraud sometime abound. (209 words ) 考研英语图表类作文:Changes in the number of TV-goers and Film-goers电视观众与电影观众数量变化Changes in the number of TV-goers and Film-goersFrom the curve chart given above, we can observe that the number of film-goers and TV-goers experienced some changes over the past decade. From 1975 to 1985, the number offilm-goers decreased rapidly from 80 million to nearly 10 million. During the same period, thenumber of TV-goers increased sharply from less than 10 million to approximately 100 million.The curve chart informs us of the phenomenon that there exists an opposite tendencybetween film-goers and TV-goers. Many reasons can account for this phenomenon, and thefollowings might be the most critical ones: for one thing, by improving the quality ofprograms, the TV-industry has retained a large body of televiewers and attracted quite a fewpotential viewers that would have swarmed into cinemas. When it comes to the cinema, thereason why it slackens might be attributed to the change of peo ple’s consumption idea, peoplein increasing numbers hold the opinion that the ticket fare is sometimes too high for them toafford. Besides, by taking advantage of the convenience offered by the Internet, people candownload their favorite movies from the websites directly instead of sitting in the movie theater,which also reinforces the inexorable decline of cinema industry.Whether the film industry will continue to shrink away or not is still unknown. However, noone can deny the fact that movies play an indispensable role in enriching our lives. Perhapsone day,the cinema industry will enjoy a revival, time will tell.考研英语图表类作文:overseas traveling industryThe boom of overseas traveling industryFrom the bar chart given above, we can observe that the number of people travelingabroad experienced some changes during the past several years. From 1999 to 2000, thenumber of Chinese people traveling abroad increased rapidly from 7.5 million to 10 million, andthen to 12.1 million in 2001.The bar chart reveals that people in mounting numbers are going to travel abroad. Whatexactly contribute to this phenomenon? Reasons can be listed as follows: for one thing, theauthorities have issued some preferential policies to promote the development of the overseastourism industry, which encourages a sudden emergence of travel agencies that can providecustomers with convenient overseas tourism services. Additionally, with the improvement offinancial status and purchasing power, a considerable number of Chinese people can affordthe once-deemed-expensive traveling expenses. Last but not least, as there exists hugedifference in cultures, customs and landscapes between China and overseas countries, quite afew people hold that overseas traveling is not only a perfect way to relax oneself, but alsoenrich their knowledge and expand their horizons.By observing the past trends, we may forecast that the growth tendency will continue.However,it is also a highly variable industry which is vulnerable to seasons and climates,international political situation,fluctuations in exchange.考研英语图表类作文:Domestic market shareDomestic market share of different car brandsFrom the bar chart given above, we can observe that themarket share of different brandsin domestic car markets experienced some changes during the past several years. The carmarket share of Chinese brands increased markedly from 25% in 2008 to roughly 35% in 2009.During the same period , the proportion of Japanese brands decreased sharply by nearly 10%from 35% to 25%. The percentage of American brands remained unchanged at 15% from 2008to 2009.The bar chart reveals that there exists some difference in the development tendencyamong different car brands. What exactly contribute to this phenomenon ? Reasons can belisted as follows: for one thing, the Chinese government has issued some preferential policies toprotect and promote the rapid extension of domestic automotive industry. Moreover, withthe decline of the prices of domestic cars, people in mounting numbers are more inclined tochoose them. As for Japanese car brands, its loss of customers can be attributed to the “RecallCrisis” and low price performance ration.To maintain the leading position, Chinese automotive industry should spare no efforts toimprove their capabilities of products innovation, service awareness and continue to lower itsprices. Only in this way can the car industry enjoy a sustainable development. (208 words)。
考研英语作文必背模板图表作文.doc
smoking each year. Obviously, the total loss of moneyaround the globe substantially exceeds the gain in theindustry.[8.归纳结论段]In conclusion, as the economic development aims at making our life better, we cannot sacrifice our health for short-term financial benefits. If we have to spend more and more money providing medical services for those who suffer from smoking-related illnesses, the notion of promoting economy via tobacco production is not justifiable. It is high time that we fought for the total tobacco ban.日用花销统计Statistics in People's Daily Expenses in Xi'anYearItem 1995 1996 1997 1998 1999Food 66% 61% 48% 41% 36%Clothing 9% 10% 12% 15% 18%Recreation 4% 5% 8% 9% 11%[2.图画/图表描述段]What is shown in the table above indicates that dramatic changes have taken place in the daily expenses in Xi' an from 1995 to 1999. The expenses on food have declined by 30% while those on clothing and recreation have increased respectively by 9% and 7%. The statistics of rise and fall seem to exist in isolation but closely related to one another.[6.原因列军段]There are two factors accounting for these changes. Development in economy is an essential one in the five years. The increased income resulting from economic growth plays an important part in the less expense on food. Hence, a small percentage of total income is enough to cover food expense. Another one is the changes in life style. When food presents no worry to the average, people begin to focus more of interest on handsome appearance and happy leisure time. As a result of such a shift, spending on clothing and recreation increased year after year.[9.趋势预测段]From the analyses made above, we may come to the conclusion that people's living standards in Xi' an have been constantly improved between 1995 and 1999. With the further growth in economy and more changes in life style, the tendency indicated in the table will continue in the table will continue in the better direction.中国大学网研究生考试频道欢迎你!/。
考研英语一的作文万能模板
考研英语一的作文万能模板一、图表作文。
Nowadays, with the rapid development of economy, the issue of (图表中的主题) has aroused wide concern in the public. According to the chart, we can see that (图表内容简要描述). From the data given, we can draw the conclusion that (结论). There are several reasons for this phenomenon.Firstly, (原因一). Secondly, (原因二). Moreover, (原因三). Therefore, it is high time that we took effective measures to solve the problem.To begin with, the government should make strict laws to limit (解决方法一). In addition, individuals should enhance their awareness of (解决方法二), and try to adopt a more environmentally friendly lifestyle. Only in this way can we build a harmonious society.In conclusion, (结论重述). Only when we take these measures can we solve the problem and achieve sustainable development.二、观点对比型作文。
Nowadays, there is a growing concern over the issue of (话题). Some people believe that (观点一), while others argue that (观点二). As for me, I agree with the former/latter point of view.Those who support the former point of view have their reasons. First of all, (理由一). In addition, (理由二). Therefore, it is reasonable to believe that (观点一).On the other hand, those who support the latter point of view also have their reasons. For one thing, (理由一). For another, (理由二). Therefore, it is reasonable to believe that (观点二).In my opinion, (个人观点). The reason is that (原因). Therefore, it is high time that we took effective measures to (解决方法).In conclusion, (结论重述). Only when we take these measures can we solve the problem and achieve sustainable development.三、利弊对比型作文。
考研英语2图表作文

图表作文的篇章结构:写图表作文时,常采用三段式的谋篇方式。
文章的第一段往往分析图表中的数据变化反映什么问题或趋势,概述图表所揭示的信息。
第二段分析造成这一问题或趋势的原因。
第三段则展望未来的情况或提出解决问题的办法或建议。
中间段1. It’s an urgent task for us to change this unfavorable situation: ______________.2. The picture can reminds you of some strange, yet familiar phenomena existing in our society.3. Confronted with AAA, we should take a serious of effective measures to cope with the situation.16. It is high time that something was done about it. For example, ______________. In addition, ______________. All these measures will certainly ______________.22. There are, I think, two main reasons for ______________. In the first place, ______________. In the second place, ______________. Therefore, ______________.30. However, just like everything has both its good and bad sides, ______________ also has its own disadvantages, such as, ______________. besides, ______________.33. There are many reasons responsible for this instance, and the following are the typical ones. For one thing, ______________,in addition, ______________. The main reason is that ______________.36. One of the reasons that is given for ______________ is that ______________.结尾句1. The most effective means to solve this problem is that ______________. In that case, ______________.2. Everything has its own two sides, no exception with AAA. For one thing, ______________. for another, ______________.4. On the whole, it is high time that we recognized the significance of ______________.6. Judging by the figures, we can draw a conclusion that ______________.7. In a word, the whole society should pay close attention to the problem of ______________. Only in this way can ______________ in the future.8. In my opinion, we should place much emphasis on the importance of ______________.12. As a popular saying goes, ______________. In my opinion what really counts is not ______________, but ______________. I believe that as long as ______________, we will ______________. So I am for theopinion that ______________.16. People are coming to realize the importance of ______________. They have begun to try their bestto ______________. We believe that ______________.17. All in all, we cannot live without ______________ . But at the same time we must try to find out new ways to cope with problems that would arise.18. Whatever you do, please remember the saying-______________. If you understand it and apply it to your study or work, you’ll definitely benefit alot from it.21. It is essential that effective actions should be taken to end the situation.24. From what has been discussed above, we may reasonably arrive at the conclusion that ______________.38. If we can’t take useful means, we may not control this trend, and some undesirable result may comeout unexpectedly, so what we should do is ______________.53. In my opinion, to solve this problem there might be two ways. One way to tackle this question is______________. Another way that is worth adopting is ______________.考研英语二图表作文模板第一段(一升一降一不变,一缓慢)What a thought-provoking and illuminating chart it is! As is apparently depicted in the chart, it is obvious that(内容)soared from(数据)in(年份)to(数据)in(年份), While, as a sharp contrast, (内容)decreased from(数据)in(年份)to(数据)in(年份).In addition ,(内容)was almost the same in(年份)and(年份)./(there was only a slow increase from(数据)in(年份)to(数据)in(年份))第二段(解释具体原因)Why does this phenomenon revealed in the chart above appear? Several reasons accounting for the situation can be what follows. To begin with ,I am strongly convinced that this is partly duo to the fact that(原因一), In addition, this is partly because ,(原因二), Last but not least,this is partly because(原因三). Maybe there are some other reasons bring about this phenomenon. But it is generally believed that the above mentioned reasons are commonly acceptable.第三段(发表个人观点)From the analyses made above , we may come to the conclusion that(结论). I am sure my opinion is both sound and well-grounded.对于英语(二)的考生来说,大作文备考的重点是图表作文,因为大纲样题中给出的是表格,而且两年真题考的是柱状图,都属于图表范畴。
考研英语二 图表类作文
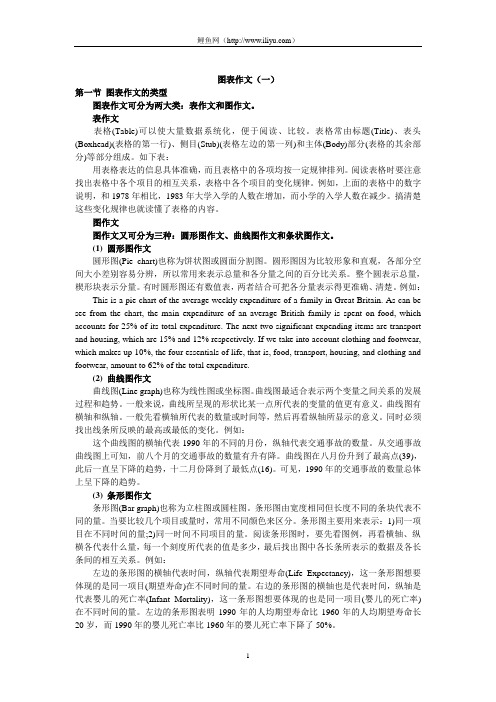
图表作文(一)第一节图表作文的类型图表作文可分为两大类:表作文和图作文。
表作文表格(Table)可以使大量数据系统化,便于阅读、比较。
表格常由标题(Title)、表头(Boxhead)(表格的第一行)、侧目(Stub)(表格左边的第一列)和主体(Body)部分(表格的其余部分)等部分组成。
如下表:用表格表达的信息具体准确,而且表格中的各项均按一定规律排列。
阅读表格时要注意找出表格中各个项目的相互关系,表格中各个项目的变化规律。
例如,上面的表格中的数字说明,和1978年相比,1983年大学入学的人数在增加,而小学的入学人数在减少。
搞清楚这些变化规律也就读懂了表格的内容。
图作文图作文又可分为三种:圆形图作文、曲线图作文和条状图作文。
(1) 圆形图作文圆形图(Pie chart)也称为饼状图或圆面分割图。
圆形图因为比较形象和直观,各部分空间大小差别容易分辨,所以常用来表示总量和各分量之间的百分比关系。
整个圆表示总量,楔形块表示分量。
有时圆形图还有数值表,两者结合可把各分量表示得更准确、清楚。
例如:This is a pie chart of the average weekly expenditure of a family in Great Britain. As can be see from the chart, the main expenditure of an average British family is spent on food, which accounts for 25% of its total expenditure. The next two significant expending items are transport and housing, which are 15% and 12% respectively. If we take into account clothing and footwear, which makes up 10%, the four essentials of life, that is, food, transport, housing, and clothing and footwear, amount to 62% of the total expenditure.(2) 曲线图作文曲线图(Line graph)也称为线性图或坐标图。
考研英语作文万能模板:图表

考研英语作⽂万能模板:图表 考研英语作⽂中免不了有⼀些图表作⽂,那么怎么应对这些作⽂呢?店铺考研英语作⽂频道为⼤家提供考研英语作⽂万能模板:图表,希望⼤家喜欢。
考研英语作⽂万能模板:图表 1. According to the figures shown in the table/graph we can see/conclude that… 例句:According to the figures shown in the table, we can see that great changes have been taking place in people’s diet over the period from 1988 to 1998. 2. We can see/We have noted/It can be seen from the table/chart/graph that… 例句:We have noted from the graph that there is a wide gap between the top ten universities both of China and of the world. 3. The graph/table/chart shows/indicates/reveals/points out that… 例句:The chart reveals that the number of road accidents is spiraling upward every year as more and more highways are constructed all over China. 4. As is shown/can be seen in the chart/graph/diagram released by the government… 例句:As we can see in the diagram released by the government, the rapid growth of population has resulted in the extinction of many wildlife species. 5. After considering the information in the graph/table/chart, we might conclude that… 例句:After considering the information in the graph, we might conclude that the energy structure in rural areas has been greatly improved over the past 15 years. 6.The chart/graph/table shows a minimal/slight/slow/steady/marked/dramatic/sharp/suddenincrease/rise/decline/reduction/fall/drop in…compared with those of last year/10 years ago/last century… 例句:The graph shows a marked decline in the number of wildlife species compared with that of last century. 7. This year, the products of…dropped to half/was cut in half/doubled/tripled. 例句:This year, the products of cotton doubled. 8. The number of … grew/rose/dropped from…to… 例句:The number of car accidents grew from 3691 in 1985 to 8245 in 1995. 9. No increase is shown in …; then came a sharp increase of … 例句:No increase is shown in 1988; then came a sharp increase of 8 million. 10.Sth. is twice/three/half as large/high/much as sth. else. 例句:The production of cotton is twice as much as that of wheat. 11.The table/chart/graph represents the development and changes in … 例句:The table represents the development and changes in agriculture structure in the past 30 years. 12.By comparison with…, it dropped/ fell/ decreased from…to…/ by… 例句:By comparison with 1990, it dropped by 15 percent. 13.There appeared an even more stable/consistent/steady tendency to rise/drop. 14.The curve has leveled off/stayed the same/remained unchanged for 2 years and the trend will be continuing.。
- 1、下载文档前请自行甄别文档内容的完整性,平台不提供额外的编辑、内容补充、找答案等附加服务。
- 2、"仅部分预览"的文档,不可在线预览部分如存在完整性等问题,可反馈申请退款(可完整预览的文档不适用该条件!)。
- 3、如文档侵犯您的权益,请联系客服反馈,我们会尽快为您处理(人工客服工作时间:9:00-18:30)。
考研英语大作文图表作文范文及模板图表作文1.写作攻略图表作文是考研英语写作中较为常见的题型之一,也是难度较大的一种写作题型。
这类作文可综合提供题目、数据、图像、提纲,形式多样,但实际上只涉及5个方面:描述图表、指明寓意、分析原因、联系实际、给出建议,而每次考试只是从这5个方面的内容中选出3个结合在一起。
从写作类型来看,基本上属于说明文。
要求考生围绕题目将有关信息转化为文字形式,考生应该具有一定数据分析和材料归纳的能力,同时会运用一定的写作方法。
考研试题一般以三段式写作方法来组织文章,第一段总结归纳信息反映的整体情况,点出主题思想,第二段回答第一段所得出的问题,对数字、数据等做出有条理的分析比较,第三段做出总结或给以简单的评论。
表格和图表题型写作要点:(1)考生应仔细研究题目以及提示信息,认清图表中的数字、线条、阴影等部分的变化趋势和走向,抓住其主要特点,然后根据图表所显示的中心信息确定内容层次以及主题句。
(2)考生应该仔细研究图表所给出的大量信息,从中选取最重要,最有代表性的信息,然后根据全文的主旨去组织运用所获取的关键信息。
切忌简单地罗列图表所给出的信息。
(3)图表作文一般采用的时态为一般现在时,但如果图表中给出了具体时间参照,考生则应对时态进行相应的调整。
(4)图表作文有一些固定句型和表达法,考生应对此融会贯通。
(5)图表作文可以细分为表格,曲线图、柱形图和饼形图。
除了上述共同要点,考生还应了解这四种图在写作方面的不同特点。
——表格可以表示多种事物的相互关系,所以考生要对表格中所给出的大量数字进行比较分析,从中找出其变化规律。
——曲线图常表示事物的变化趋势,考生应认真观察坐标系所显示的数据信息,并且密切注意交汇在坐标横轴和纵轴上的数字及单位。
——柱形图用来表示各种事物的变化情况及相互关系,要求考生通过宽度相等的柱形的高度或长度差别来判断事物的动态发展趋势,因此考生应密切关注坐标线上的刻度单位及图表旁边的提示说明与文字。
——饼形图表示各事物在总体中所占的比例及相互关系,旨在要求考生准确理解并阐述一个被分割成大小不等切片的饼形图所传达的信息。
考生应清楚掌握部分与整体,部分与部分之间的相互关系,这种关系通常是以百分比的数字形式给出的。
(6)列出各段主题句。
考生可以根据所给提纲或已知信息列出每段的主题句,为全文的展开做好铺垫。
(7)围绕主题句完成段落的展开。
尽量做到主题明确、条理清楚、文字简练。
(8)检查与修改。
对图表作文的检查与修改应着重看文章中所列举的信息是否与图表所显示的信息一致,资料是否恰当。
2.必背模版句型As can be seen from/in the chart/diagram/table/graph...从表格/图形中我们可以看到……The table shows a three times increase over that of last year.表格显示比去年上升了3倍。
According to /As is shown in the Table /Figure/Chart...如表格/图表中显示……The number is 5 times as much as that of...此数字是……的5倍。
It has increased by three times as compared with that of ...同……相比,增长了3倍。
It can be seen from the chart/diagram/table/graph/figures/statistics that...从表格/图表/数据中我们可以看到……From the table/figures/data/results/information above, it can/may be seen/concluded/shown/estimated/calculated/inferred that...从以上的表格/图表/数据/结果/信息中,我们可以看到/总结/预测/计算/得出……A has the highest sales figure in the three departments, followed byB and C.在3个部门中,A的销售额最高,其次是B和C。
The figure of A is about twice as much as that of B.A的数字是B的两倍。
The rise lasted for two weeks and then began to level off in August.上升两个星期后,8月份开始平稳。
It accounts for 30% of the total population.占到总人口的30%。
The number of students has reached 500, indicating a rise of 20%, compared to last semester.学生人数达到500人,与上个学期相比上升了20%。
It picked up speed at the end of this month.这个月底加快了速度。
The pie charts show the changes on... in some place in 2000.此饼形图显示了2000年一些地方……的变化。
from this year on,there was a gradual declined reduction in the..., reaching a figure of...从这年起,……逐渐下降至……There are a lot of similarities/differences between...and...……与……之间有许多相似(不同)之处It can be drawn from the chart that the proportions of A and B are going down, though the falling level of the latter is a lot lower/higher than that of the former.尽管B的下降速度比A要慢/快,从表中我们可以看到A和B的比例都在下降。
The increase/decrease is more noticeable during the second half of the 5?year period.在5年期限的后半段,增长/降低比较明显。
It falls from 50% in 2000 to 30% in 2004, and then the trend reverse, finishing at 58% in 2005.从2000年的50%降到2004年的30%,然后形势逆转,2005年达到了58%。
The table shows the changes in the number of...over the period from...to...该表格描述了在……年之……年间……数量的变化。
As can be seen from the graph, the two curves show the fluctuation of...如图所示,两条曲线描述了……的波动情况。
3.必背经典范文Directions: the table below shows the number of road accidents which occurred in Britain in different places and the ages of the injured persons. Write a report describing the information shown below.Road accidents in Britainwhen/where accidents occurredAge2-4Age5-7Age8-11Age11-13Age14-16TOTALGoing to school21383127Going home from school21692231Playing in the street89812651202Cycling into the street110259247Shopping for their parents432132152TOTAL9815281217359The chart above organizes data about road accidents involving children in Britain by and by when and where the accidents occurred. It can be seen that the incidence of accidents decreases as the children?s age increase and that age correlates with the circumstances surrounding the accident.For all ages, the most common situation leading to accident is playing in the street but young children were particularly affected. Children between the ages of 5-7 seemed to get into accidents while engaged in activities appropriate to their age, such as shopping for their parents or going home from school. In fact, this age group accounted for the most road accidents of all. Children between 8 and age 11 had the most accidents cycling in the street. After age 11, the number of accidents dropped considerably in all situations.From the chart, we get to know that playing in the street is the most common and universal site of accidents of all ages, but the risks that other sites and situations present vary with the children?s ages.题目:表格给出了英国在不同地点和不同年龄段的人所发生的交通事故。