弯曲疲劳强度的工业经验
doi:10.1111/j.1460-2695.2010.01450.x
Industrial experiences of bending fatigue strength in table liner for cement mill
S.-H.BAEK,1S.-S.CHO 2and W.-S.JOO 3
1Graduate
School of Mechanical Engineering,Dong-A University,840Hadan2-dong,Busan 604-714,Korea,2Department of Vehicle Engineering,
College of Engineering,Kangwon National University,Samcheok,Gangwon-do 245-711,Korea,3Department of Mechanical Engineering,Dong-A University,840Hadan2-Dong,Busan 604-714,Korea Received in final form 17November 2009
A B S T R A C T A table liner for the vertical roller mill has been used to grind natural limestone.Un-
expected fatigue failure accidents have occurred during portland cement manufacturing process.The design life of a table liner is 4×10⁷cycles,but the actual fatigue life of a table liner is 2×10⁶to 8×10⁶cycles.The fatigue crack of a table liner initiates from the outside edge of the grinding path of the limestone.When such a crack occurs,the table liner has to be replaced,and this requires 30%of the total maintenance cost of the vertical roller mill.Therefore,this study examines the fatigue failure of a table liner by plane-bending fatigue test,stress measurement test,finite element analysis and fatigue fracture analysis.
Keywords bending fatigue strength;finite element analysis;Goodman diagram;stress-life curve;vertical roller mill.
I N T R O D U C T I O N
A vertical roller mill for cement production is far supe-rior than the existing tube mill with respect to energy efficiency.However,the table liner for a roller mill un-dergoes periodic repeated loading because it is a rotary machine.A fatigue function is expressed in terms of the stress ratio and mean https://www.360docs.net/doc/449661381.html,ually,a fatigue function uses the Goodman diagram.1–3Stress ratio R in a fatigue cycle is defined as follows.4,5R =
σmin σmax
(1)
where σmin is the minimum stress and σmax is the maximum stress in a fatigue stress cycle.
Joo et al.6,7reported that the loads applied to a turbine blade are repeated bending load,torsional load and cen-trifugal load.According to X-ray fractography and the Goodman diagram,repeated bending stress is the major cause of turbine blade fatigue failure.Mandell et al.4,8,9proposed the Goodman diagram based on 13stress ratios.This method formulated the S-N behaviour considering the effect of mean stress.
Correspondence :W.-S.Joo.E-mail:wsjoo@dau.ac.kr
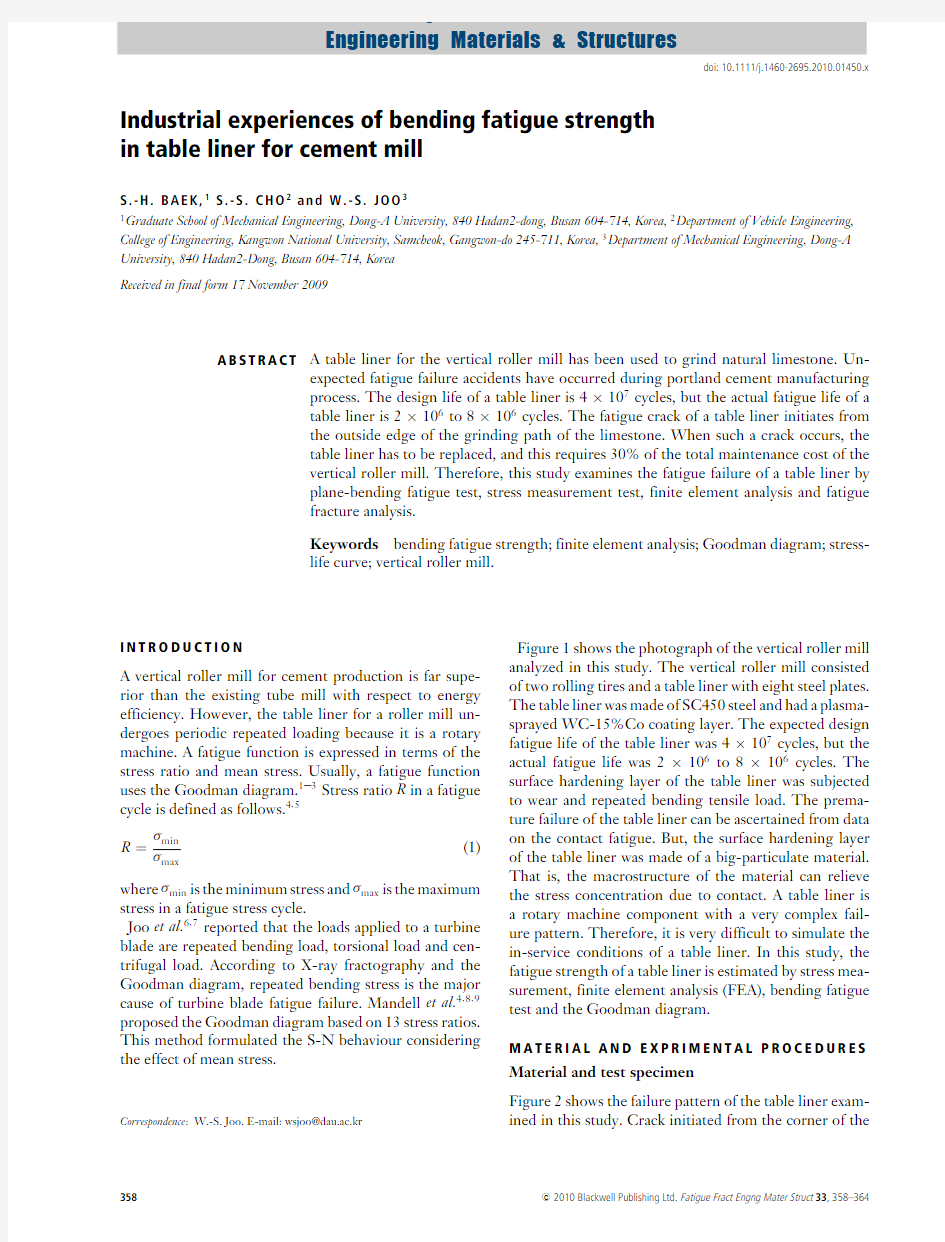
Figure 1shows the photograph of the vertical roller mill analyzed in this study.The vertical roller mill consisted of two rolling tires and a table liner with eight steel plates.The table liner was made of SC450steel and had a plasma-sprayed WC-15%Co coating layer.The expected design fatigue life of the table liner was 4×10⁷cycles,but the actual fatigue life was 2×10⁶to 8×10⁶cycles.The surface hardening layer of the table liner was subjected to wear and repeated bending tensile load.The prema-ture failure of the table liner can be ascertained from data on the contact fatigue.But,the surface hardening layer of the table liner was made of a big-particulate material.That is,the macrostructure of the material can relieve the stress concentration due to contact.A table liner is a rotary machine component with a very complex fail-ure pattern.Therefore,it is very difficult to simulate the in-service conditions of a table liner.In this study,the fatigue strength of a table liner is estimated by stress mea-surement,finite element analysis (FEA),bending fatigue test and the Goodman diagram.
M A T E R I A L A N D E X P R I M E N T A L P R O C E D U R E S
Material and test specimen
Figure 2shows the failure pattern of the table liner exam-ined in this study.Crack initiated from the corner of the
358c 2010Blackwell Publishing Ltd.Fatigue Fract Engng Mater Struct 33,358–364
Fatigue & Fracture of
Engineering Materials & Structures
BENDING FATIGUE STRENGTH IN TABLE LINER FOR CEMENT MILL
359
Fig.1Vertical roller
mill.
Fig.2Sampling directions of tensile and bending specimens and fracture process of table liner.
Fig.3Tensile test specimen configuration.
table liner and grew in the cylindrical and axial directions.To test the mechanical properties of a table liner,the test specimen should reflect the damage pattern of the table liner.Therefore,the principal stress direction of the test specimen was made to coincide with the radial direction of the table liner.Six tensile test specimens and 18fatigue test specimens were prepared.
Figure 3shows a tensile test specimen made according to ASTM E8M-94a.10An electro-mechanical system of 98kN capacity (Instron,model 1337,USA)was used to carry out the tensile tests.An extensometer was calibrated to an accuracy of under 2μm.It had a standard deviation of 2.5μm.11Poisson’s ratio was measured by a strain gauge of 5mm in length (Kyowa,KFC-5-D16-23,Japan)and a strain measurement device (Kyowa,UCOM-93,Japan).
Table 1Mechanical properties of SC450steel Properties
Unused Used Yield strength (MPa)
238.2241.6Ultimate tensile strength (MPa)480474Poisson’s ratio 0.30.306Elongation (%)
2422.7Young’s modulus (GPa)
203
206
The test specimens were made of materials taken from an unused table liner and a fractured table liner,respec-tively.Table 1shows the results of the tensile test.The mechanical properties of the fractured table liner showed hardly any difference from those of the unused table liner.We could expect the table liner to be in an elastic state.Plane bending fatigue test
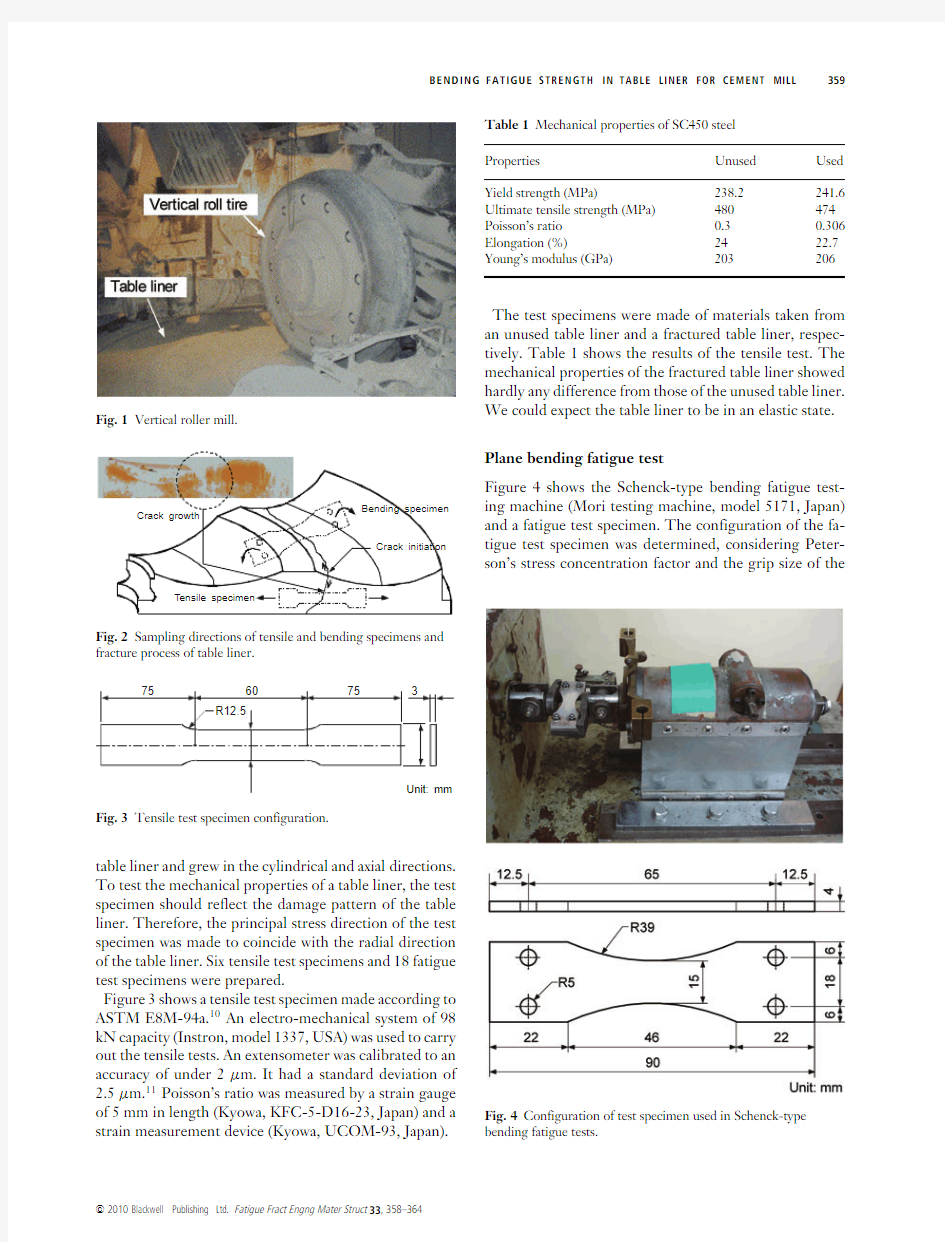
Figure 4shows the
Schenck-type bending fatigue test-ing machine (Mori testing machine,model 5171,Japan)and a fatigue test specimen.The configuration of the fa-tigue test specimen was determined,considering Peter-son’s stress concentration factor and the grip size of the
Fig.4Configuration of test specimen used in Schenck-type bending fatigue tests.
c 2010Blackwell Publishing Ltd.Fatigue Fract Engng Mater Struct 33,358–364
360S.-H.BAEK et
al.
Fig.5Fracture aspect of table liner for vertical mill.
testing machine.12The stress concentration factor and curvature radius of the fatigue testing specimen were 1.05and 39mm,respectively.The maximum bending mo-ment,the loading speed and the test temperature were 20N m,1500rpm and room temperature,respectively.
F A T I
G U E S T R E N G T
H A N A L Y S
I S O F T H E T A B L E L I N E R
Failure accident of the table liner
The diameter of the vertical roller mill was 6240mm,and the radius of the table liner was 2390mm.The driv-ing power and grinding volume of the limestone were 4250kW and 5.5MN/hr,respectively.Figure 5shows the failure pattern of the vertical roller mill.A table liner is used to prevent the mill table from being worn by lime-stone.The top of the table liner were made from SC450steel and the bottom of the table liner had a built-up welding layer.
Figure 6shows the hardening layer crack that formed after the built-up welding.The average diameter of the cracks was 6.5mm.These cracks occurred during the welding process but not when the table liner was in service.Also,particulate cracks minimized the welding residual stress and
delamination.
Fig.6Macrostructure of hardfacing layer in table liner.
The surface hardening layer of the table liner had a life of less than 4×10⁷cycles.If the life of the table liner exceeds 4×10⁷cycles,the surface hardening layer would reach its wear limit.But,more than 80%of table liners are replaced by fatigue fracture and not by wear.
Fatigue crack was initiated at the interface between the surface hardening layer and the base metal of the ta-ble liner.Also,the fatigue crack grew in the radial and the thickness direction from the edge of the table liner.Ahmed et al.13proposed that the rolling contact fatigue crack in a WC-15%Co sprayed material initiates due to the shear stress in the base metal as well as the difference in the mechanical properties between the coating layer and the base metal.Static structural analysis
Figure 7shows the results of the plane bending fatigue test for stress ratio –1.Unfractured test conditions appear
10
4
10
5
10
6
10
7
160180200220240260280300320S t r e s s a m p l i t u d e σ (M P a )
Cycles to failure N (cycle)
Fig.7S-N curve of SC450steel.
c 2010Blackwell Publishing Ltd.Fatigue Fract Engng Mater Struct 33,358–364
BENDING FATIGUE STRENGTH IN TABLE LINER FOR CEMENT MILL
361
Fig.8Finite element model of vertical roller
mill.
Fig.9Von-Mises stress distribution of table liner for vertical roller mill.
upon more than 1×10⁷cycles.The endurance limit obtained from the staircase test method was 185MPa.FEA of the vertical style roller mill was performed with ANSYS R8.0.14An 8-node hexahedron element was used.The numbers of elements and nodes were 88149and 100638,respectively.The finite element model exam-ined a quarter of the mill.The boundary condition for the mill was set to the axisymmetric condition.The ap-plied load was determined by using the static equilibrium relation between the rolling tire and the table liner (See Fig.8).Based on this assumption,the applied force on the inner and outer contact region is 1.1MN and 2.9MN,respectively.15,16
Figure 9shows the FEA of the table liner.The maximum principal stress of 222.3MPa was obtained at the loading point.The minimum principal stress of 28.94MPa was obtained at 90?from the loading point.
To examine the FEA results,static stress measurement tests were performed by using a hydraulic pressure
piston
Fig.10Location of strain gauge used at static stress measurement.Photography of strain gauge attached to table liner.
2400
2100180015001200900600300060
80100120140160180200220240
260280
V o n -M i s e s s t r e s s (M P a )
Radius from center of table (mm)
Fig.11Radial stress distribution of the table liner.
(RG 400/180-550).The strain gauge used in the stress measurement test was the delta rosette gauge (Kyowa-KFG-5-120-D17-11).The length of the strain gauge was set to 5mm considering the area of the table liner.
Figure 10shows the attachment locations of the strain gauges.These locations were the “most dangerous”areas according to the FEA result and were most likely to cause failure accidents of the table liner.Strain gauges were attached at 15?intervals from location A.Experimental principal stresses were obtained from the strain gauges.Figure 11shows the radial direction stress distribution in the table liner.A sine stress waveform was obtained in the radial direction.In the grinding path,the outside stress distribution was 1.3times higher than the inner stress distribution.Therefore,the stress concentrated on the outer grinding path.Stresses at 45?and 90?from location A appeared to be lower than the stresses at 0?
c 2010Blackwell Publishing Ltd.Fatigue Fract Engng Mater Struct 33,358–364
362S.-H.BAEK et al.
360
330
300
270
240
210
180
150
120
90
60
30
P r i n c i p a l s t r e s s (M P a )
Circumferential angle (degree)
Fig.12Comparison of principal stress distribution of circumferential direction.
from location A.From the above results,the maximum stress in the table liner was produced at location A on the outside grinding path.
Figure 12shows the cylindrical directional stress distri-bution at intervals of 15?around the maximum principle stress.The solid line is the maximum principal stress re-gression curve,which was generated from measurements given by the strain gauges,and the dotted line is the maxi-mum principal stress regression curve obtained from FEA.The difference between the FEA and strain gauge meth-ods themselves generated an error of 12%of the maxi-mum principal stress values.But,the distribution of the principal stress obtained from the FEA was similar with that obtained from the strain gauge.Therefore,the stress waveform of the table liner
was similar to that of the rotary machine such as a pump and gear.17The stress pattern of the table liner indicated a symmetric structure with re-spect to 180?.The table liner was subjected to two repeat bending stress per one revolution.Figure 13shows the location of the maximum principal stress and the location of actual failure from the centre of the outside grinding path of the table liner.The maximum principal stress was measured experimentally at 10locations in the high stress
C e n t e r o f v e r t i c a l r o
l l e r m i l l
Fig.13Fracture position at the outside grinding path by visual examination and FEA.
S t r e s s a m p l i t u d e σa (M P a )
Mean stress σm (MPa)
Fig.14Goodman diagram for table liner.Note that the Goodman line endpoint is the UTS from an axial tensile test.
distribution area.The experimental maximum principal stress was located between 118mm and 358mm from the centre of the outside table liner.The analytic maximum principal stress was located 257mm from the centre of the outside table liner.Therefore,the maximum princi-pal stress region was found to be the area that fractured most frequently in the table liner.Fatigue strength estimation
The Goodman diagram 1–3,18is used to evaluate fatigue failure of parts under repeated load.Figure 14shows the operation condition of the table liner in the Goodman diagram.A safe domain was bounded by a limit line in the form of a straight line through two limit points taken from the ultimate tensile strength of 474MPa and the fatigue limit of 185MPa.The line was a solid line.Stress ratio in table liner is 0.5.The endurance limit line given above doesn’t consider the mean stress effect.Therefore,the effect of the mean stress on life can be estimated by ap-plying the modified Goodman expression to an equivalent reversed value for the stress at the notch.
σar =σa
1?σ
m
σu (2)where σar is the equivalent completely reversed stress am-plitude,σm is the mean stress (=125MPa),σa is the stress amplitude (=125MPa)and σu is the ultimate strength (=480MPa).Fatigue notch factor k f =1is employed in this study because notch has a large radius and SC450steel is ductile material.The dotted line represents the endurance limit line in the form of a straight line through two limit points taken from the ultimate tensile strength of 474MPa and the equivalent completely reversed stress amplitude of 169MPa.
c 2010Blackwell Publishing Ltd.Fatigue Fract Engng Mater Struct 33,358–364
BENDING FATIGUE STRENGTH IN TABLE LINER FOR CEMENT MILL363
The dash dotted line marked the region where the mean stress was equal to the stress amplitude;that is,this line means the region where stress ratio equals0.The mean stress and stress amplitude of the table liner were deter-mined from the maximum and minimum stress obtained by FEA.The table liner can move to the structurally dan-gerous area easily due to the in-service conditions because the stress condition of the table liner existed on the bound-ary of the Goodman diagram.The fatigue limit used in the Goodman diagram was measured in the controlled test conditions.
The fatigue limit of a machine part depends strongly on its various conditions(surface roughness,material struc-ture,residual stress,and processing method).The cor-relation of the fatigue limit and some of the factors can be expressed by the empirical equation.To account for the important of these conditions,we employ a variety of modifying factors,each of which is intended to account for a single https://www.360docs.net/doc/449661381.html,ing this idea,we may write
Se=C load C size C surf C temp C residual C reliab S e(3) where S e is fatigue limit of the table liner and S e is fatigue limit of SC450steel(R=?1).Cho et al.16proposed some strength reduction factors in the table liner.These are as follows.
C load=1,C size=0.6,C surf0.814,
C temp=1,C reliab=0.897(4)
Residual stress in the surface layer of table liner plays an important role in the overall fatigue properties of the part.In this study,we may consider the induced residual stress at table liner surface as tensile stress.Grover et al.19 proposed that the residual stress factor C residual had0.52 for the worst welded test condition.We obtain C residual= 0.52.If we substitute above factors into Eq.(3),we obtain
modified fatigue limit38.5MPa.When all the modifying factors are considered,fatigue limit dropped by77.2%. From the above test result,the fatigue limit in the stress amplitude axis was set to38.5MPa.The fatigue limit line was represented with a dotted line in Fig.14.The results from FEA and strain gauge analysis exist in the dangerous area of the Goodman diagram.Therefore, the fatigue limit of the table liner should be determined by considering the fatigue strength reduction factors of the table liner.
C O N C L U S I O N S
This study investigated the fatigue strength estimation of a table liner for a vertical roller mill by using the plane-bending fatigue test,stress measurement,FEA and the Goodman diagram.1Fatigue crack was initiated at the interface between the surface hardening layer and the base metal of the table liner.Also,the fatigue crack grew in the radial and the thickness direction from the edge of the table liner.
2The table liner was subjected to two repeat bending stress per one revolution.
3The table liner exists in the structurally“dangerous”area because the stress condition of the table liner exists out of the boundary of the Goodman diagram.
4Fatigue strength reduction factors are useful in explaining the premature failure of the table liner. Acknowledgment
This work was supported by the research fund of Dong-A University.
R E F E R E N C E S
1Goodman,J.(1899)Mechanics Applied to Engineering.
Longmans,Green,and Co.,London.
2Shen,M.-H.H.(1999)Reliability assessment of high cycle fatigue design of gas turbine blades using the probabilistic
Goodman diagram.Int.J.Fatigue21,699–708.
3Wang,S.,Dixon,M.W.,Huey,C.O.and Chen,S.(2000) The clemson limit stress diagram for ductile parts subjected
to positive mean fatigue loading.ASME J.Mech.Des.122,
143–146.
4Sutherland,H.J.and Mandell,J.F.(2004)Effect of mean stress on the damage of wind turbine blades.ASME J.Sol.
Energy Eng.126,1041–1049.
5Park,S.J.,Kim,K.S.and Kim,H.S.(2007)Ratcheting behaviour and mean stress considerations in uniaxial
low-cycle fatigue of Inconel718at649?C.Fatigue Fract.
Engng.Mater.Struct.30,1076–1083.
6Hong,S.H.,Lee,D.W.,Cho,S.S.and Joo,W.S.(2005)A study on the failure analysis of turbine blade under fatigue
load using X-ray https://www.360docs.net/doc/449661381.html,n Pacific Conference on
Fracture and Strength;Advances in Fracture and Strength.
Jeju,Korea,pp.1095–1101.
7Lee,D.W.,Cho,S.S.,Hong,S.H.and Joo,W.S.(2008) Failure analysis of turbine blade in atomic power plant.
J.Mech.Sci.Technol.22,864–870.
8Mandell,J.F.,Samborsky,D.D.,Wang,L.and Wahl,N.K.
(2003)New fatigue data for wind turbine blade materials.
ASME J.Sol.Energy Eng.125,506–514.
9Sutherland,H.J.and Mandell,J.F.(2005)Optimized constant-life diagram for the analysis of fiber glass composites used in wind turbine blades.ASME J.Sol.Energy Eng.127,
563–569.
10ASTM Standard E8M-94a.(1994)Standard Test Methods for Tension Testing of Metallic Materials.ASTM Standards Section
3.3,pp.81–100.
11ASTM E399-90.(1994)Standard Test Method for Plane-Strain Fracture Toughness of Metallic Materials.Annual Book of
ASTM Standards.03.10,pp.407–437.
12Peterson,R.E.(1953)Stress Concentration Design Fracture.
John Willey&Sons,Canonsburg,PA,USA,p.44.
13Ahmed,R.and Hadfield,M.(1999)Failure modes of plasma sprayed WC-15%Co coated rolling elements.Wear230,
39–55.
c 2010Blackwell Publishing Ltd.Fatigue Fract Engng Mater Struct33,358–364
364S.-H.BAEK et al.
14ANSYS Release8.0.(2003)ANSYS User’s and Theory Manual.
ANSYS,Inc.New York,USA.
15Baek,S.H.,Cho,S.S.,Kim,H.S.and Joo,W.S.(2006) Trade-off analysis in multi-objective optimization using
Chebyshev orthogonal polynomials.J.Mech.Sci.Technol.20, 366–375.
16Lee,D.W.,Cho,S.S.and Joo,W.S.(2008)Safety evaluation of table liner for vertical roller mill by modified
fatigue limit.Eng.Fail.Anal.15,989–999.17Norton,R.L.(1999)Machine Design:An Integrated Approach.
Prentice Hall,New Jersey,USA.
18Kluger,K and?agoda,T.(2004)Application of the Dang-Van criterion for life determination under uniaxial
random tension–compression with different mean values.
Fatigue Fract.Eng.Mater.Struct.27,505–512.
19Grover,H.J.,Gordon,S.A.and Jackson,L.R.(1954)Fatigue of Metals and https://www.360docs.net/doc/449661381.html,ernment Printing Office
Washington,D.C.
c 2010Blackwell Publishing Ltd.Fatigue Fract Engng Mater Struct33,358–364
机械设计试题及答案
1.在疲劳曲线上,以循环基数N0为界分为两个区:当N≥N0时,为(无限寿命区)区;当N <N0时,为(有限寿命区)区。 2.刚度是指机械零件在载荷作用下抵抗(弹性变形)的能力。零件材料的弹性模量越小,其刚度就越(小)。 3.润滑油的(油)性越好,则其产生边界膜的能力就越强;(粘度)越大,则其内摩擦阻力就越大。 4.为改善润滑油在某些方面的性能,在润滑油中加入的各种具有独特性能的化学合成物即为(添加剂)。 5.正是由于(弹性滑动)现象,使带传动的传动比不准确。带传动的主要失效形式为(打滑)和(带的疲劳破坏)。 6.蜗杆传动的主要缺点是齿面间的(相对滑动速度)很大,因此导致传动的(效率)较低、温升较高。 7.链传动水平布置时,最好(紧边)边在上,(松边)在下。 8.设计中,应根据被联接轴的转速、(转矩)和(直径)选择联轴器的型号。 9.径向滑动轴承的半径间隙与轴颈半径之比称为(相对间隙);而(偏心距)与(半径间隙)之比称为偏心率 。 10.对于普通平键,考虑到载荷分布的不均匀性,双键联接的强度按(1.5 )个键计算。 1.当所受轴向载荷通过(螺栓组形心)时,螺栓组中各螺栓承受的(轴向工作拉力)相等。2.从结构上看,带轮由(轮毂)、轮辐和(轮缘)三部分组成。 3.在直齿圆柱齿轮传动的接触疲劳强度计算中,以(节点)为计算点,把一对轮齿的啮合简化为两个(圆柱体)相接触的模型。 4.按键齿齿廓曲线的不同,花键分为(矩形)花键和(渐开线)花键。 5.请写出两种螺纹联接中常用的防松方法:(双螺母等)和(防松垫圈等)。
6.疲劳曲线是在(应力比)一定时,表示疲劳极限 与(循环次数)之间关系的曲线。 γN 7.理论上为(点)接触或(线)接触的零件,在载荷作用下,接触处局部产生的应力称为接触应力。 8.开式齿轮传动的主要失效形式是:(齿面的磨粒磨损)和(断齿)。 9.径向滑动轴承的条件性计算主要是限制压强、(速度)和(pv值)不超过许用值。10.在类型上,万向联轴器属于(无弹性元件的挠性)联轴器,凸缘联轴器属于(刚性)联轴器。 二、选择填空(每空1分,共10分) 1.下列磨损中,不属于磨损基本类型的是( 3 );只在齿轮、滚动轴承等高副零件上经常出现的是( 2 )。 (1)粘着磨损;(2)表面疲劳磨损; (3)磨合磨损;(4)磨粒磨损。 2.在通过轴线的截面内,(1 )的齿廓为直边梯形;在与基圆柱相切的截面内,(3 )的齿廓一侧为直线,另一侧为曲线。 (1)阿基米德蜗杆;(2)法向直廓蜗杆; (3)渐开线蜗杆;(4)锥蜗杆。 3、对于直齿圆柱齿轮传动,其齿根弯曲疲劳强度主要取决于(4 );其表面接触疲劳强度主要 取决于( 1 )。 (1)中心距和齿宽;(2)中心距和模数; (3)中心距和齿数;(4)模数和齿宽。 4、对于径向滑动轴承,(1 )轴承具有结构简单,成本低廉的特点;( 3 )轴承必须成对使 用。 (1)整体式;(2)剖分式; (3)调心式;(4)调隙式。 5.在滚子链传动的设计中,为了减小附加动载荷,应(4 )。 (1)增大链节距和链轮齿数;(2)增大链节距并减小链轮齿数; (3)减小链节距和链轮齿数;(4)减小链节距并增加链轮齿数。 6.对中性高且对轴的削弱又不大的键联接是( 1 )联接。
齿轮接触强度与弯曲强度
1. 齿轮接触强度计算 1.1齿轮接触的计算应力 βανεννπσK K K K u u bd F Z Z Z MPa E E R L F H A t E H red H 1)(11112 2 2121±?=-+-= 式中: A K —工况系数; νK —动载系数; αH K —接触强度的端面载荷分配系数; βK —齿向载荷分布系数; H Z —节点域系数; E Z —弹性系数; εZ 一重合度系数; 1.1.1 工况系数A K 由于齿轮的载荷特性为工作稳定状况下,故取工况系数为A K =1.0. 1.1.2 动载系数νK 由于 =15.96m/s 齿轮重合度 再根据《机械设计手册》图8-32与8.33得;
)=1.48-0.44(1.48-1.22)=1.36 1.1.3 端面载荷分配系数αH K 查表8-120得 21εαZ C K H H ? = 其中H C 查图8-34为0.865. 1.1.4 齿向载荷分布系数βK 查图8.35可得βK =1.13. 1.1.5 节点域系数H Z 式中:错误!未找到引用源。为端面分度圆压力角; 错误!未找到引用源。 为基圆螺旋角; 错误!未找到引用源。 为端面啮合角; 经计算最后得到H Z =2.254 1.1.6 弹性系数E Z 带入各值后,得E Z =189.87错误!未找到引用源。。 1.1.7 重合度系数εZ 与1.13的分母约去,不需考虑。
最后得到理论接触应力为: MPa Z mm mm N Z MPa H 67.124413 .11 865.036.11208.2208.3776.1572.7627.5265287.189254.2=???????? ??=ε εσ 1.2 接触疲劳极限lim H σ' W R V L N H H Z Z Z Z Z lim lim σσ=' 式中: 'H l i m σ表示计算齿轮的接触疲劳极限; Hlim σ表示试验齿轮的接触疲劳极限; N Z 表示接触强度的寿命系数; L Z 表示润滑剂系数; V Z 表示速度系数; R Z 表示光洁度系数; W Z 表示工作硬化系数。 1.2.1 试验齿轮的接触疲劳极限lim 1H σ 由手册中图8-38d 查得lim 2lim 1H H σσ==1690MPa 。 1.2.2 接触强度的寿命系数N Z 查表8-123得6 0102?=N , nt N e γ60= 0N N e >,取121==N N Z Z 。 1.2.3 润滑剂系数L Z 取10050=υ,由图8-40查得21L L Z Z ==1. 1.2.4 速度系数V Z 由图8-41,按V=1米/秒和MPa H 1200lim >σ查得95.021==V V Z Z 。
直齿圆柱齿轮传动的轮齿弯曲强度计算
直齿圆柱齿轮传动的轮齿弯曲强度计算准则 为了保证在预定寿命内齿轮不发生轮齿断裂失效,应进行轮齿弯曲强度计算。 直齿圆柱齿轮传动的轮齿弯曲强度计算准则为:齿根弯曲应力σF 小于或等于许用弯曲应力[σ F ],即 σF ≤[σF ] 轮齿弯曲强度计算公式 轮齿弯曲强度的验算公式 计算弯曲强度时,仍假定全部载荷仅由一对轮齿承担。显然,当载荷作用于齿顶时,齿根所受的弯曲力矩最大。 图 11-8 齿根危险截面 计算时将轮齿看作悬臂梁(如图11-8所示)。其危险截面可用切线法确定,即作与轮齿对称中心线成夹角并与齿根圆角相切的斜线,而认为两切点连线是危险截面位置(轮齿折断的实际情况与此基本相符)。危险截面处齿厚为。 法向力Fn 与轮齿对称中心线的垂线的夹角为 ,Fn 可分解为 使齿根产生弯曲应力,则产生压缩应力。因后者较小故通常略去不计。 齿根危险截面的弯曲力矩为 式中:K 为载荷系数;为弯曲力臂。 危险截面的弯曲截面系数W 为 故危险截面的弯曲应力为 3030F s F α1F 2F F h F σ
令 式中称为齿形系数....。因和均与模数成正比,故值只与齿形中的尺寸比例有关而与模数无关,对标准齿轮仅决定于齿数。由此可得轮齿弯曲强度的验算公式 Mpa (a) 通常两齿轮的齿形系数和并不相同,两齿轮材料的许用弯曲应力[]和[] 也不相同,因此应分别验算两个齿轮的弯曲强度。 轮齿弯曲强度设计公式 引入齿宽系数,可得轮齿弯曲强度设计公式为 mm (b) 上式中的负号用于内啮合传动。内齿轮的齿形系数可参阅有关书籍。 式(a )和(b)中为小齿轮齿数;的单位为N ·mm ;b 和m 的单位为mm ; 和[]的单位为MPa 。 式(b)中的应代入和中的较大者。 算得的模数应圆整为标准模数。 传递动力的齿轮,其模数不宜小于1.5mm 。 26( )cos ()cos F F F F h m Y s m αα=F Y F h F s F Y 1 112122[]F F F F KTY KTY bd m bm z σσ= =≤1F Y 2F Y 1F σ2F σa b a ψ=m ≥1z 1T F σF σ[]F F Y σ11[]F F Y σ2 2[]F F Y σ
材料力学习题弯曲应力
弯 曲 应 力 基 本 概 念 题 一、择题(如果题目有5个备选答案,选出2~5个正确答案,有4个备选答案选出一个正确答案。) 1. 弯曲正应力的计算公式y I M z = σ的适用条件是( ) 。 A . 粱材料是均匀连续、各向同性的 B .粱内最大应力不超过材料的比例极限 C .粱必须是纯弯曲变形 D .粱的变形是平面弯曲 E .中性轴必须是截面的对称轴 2. 在梁的正应力公式y I M z = σ中,I z 为粱的横截面对( )轴的惯性矩。 A . 形心轴 B .对称轴 C .中性轴 D .形心主惯性轴 3. 梁的截面为空心圆截面,如图所示,则梁的抗弯截面模量W 为( )。 A . 32 3 D π B . )1(32 4 3 απ-D C . 32 3 d π D . 32 32 3 3 d D ππ- E .2 6464 44 D d D ππ- 题3图 题4图 4. 欲求图示工字形截面梁上A 点剪应力τ,那么在剪应力公式z z S bI S F *=τ中,S *z 表示 的是( )对中性轴的静矩。 A .面积I B .面积Ⅱ C .面积I 和Ⅱ D .面积Ⅱ和Ⅲ E .整个截面面积 -21-
5.欲求题4图所示工字形截面梁上A 点剪应力τ,那么在剪应力公式z z S bI S F *=τ中,b 应取( )。 A .上翼缘宽度 B .下翼缘宽度 C .腹板宽度 D .上翼缘和腹板宽度的平均值 6.图为梁的横截面形状。那么,梁的抗弯截面模量W z =( )。 A . 6 2 bh B .32632d bh π- C .2641243h d bh ? ??? ??-π D .??? ? ?-???? ??-22641243d h d bh π 7.两根矩形截面的木梁叠合在一起(拼接面上无粘胶无摩擦),如图所示。那么该组合梁的抗弯截面模量W 为( ) A . 62bh B .??? ? ??622 bh C .)2(612 h b D .h bh 21222???? ?? 8.T 形截面的简支梁受集中力作用(如图),若材料的[σ]- >[σ]+,则梁截面位置的合理放置为( )。 -22-
斜齿圆柱齿轮设计例题(变载荷)_校核弯曲强度
4.校核齿根弯曲疲劳强度NO 1)齿形系数: 当量齿数Z v1=Z1/cos3β=27/cos312036'12''=29 Z v2=Z2/cos3β=81/cos312036'12''=87 图12.21page229 Y Fa1=2.55 Y Fa2=2.22 应力修正系数:图12.22page230 Y Sa1=1.62 Y Sa2=1.78 重合度系数Yε:εα=[1.88-3.2(1/Z1+1/Z2)]cosβ =[1.88-3.2(1/29+1/87)]cos12036'12'' εα=1.69 Yε=0.25+0.75/εα=0.25+0.74/1.69 Yε=0.69 螺旋角系数Yβ:Yβ=max(1-εββ0/1200,1-0.25εβ,0.75) =max(1-1×12.60/1200,1-0.25×1,0.7 5) Yβ=0.9 2)载荷系数
a.齿间载荷分配系数:表12.10page217 K Fα=εα/cos2βb=1.69/cos212.60 K Fα=1.75 b.齿向载荷分布系数:图12.14page219 b/h=83/(2.25×2.5)=12.3 K Fβ=1.36 c.载荷系数:K=K A K v K FαK Fβ=1.5×1.2×1.75×1.36 K=4.28 3)许用应力: (同直齿轮例题)[σF]=σFlim Y N Y X/s Fmin a.极限应力:图12.23page231 σFlim1=600Mpa σFlim2=450M pa b.当量应力循环次数: 设3×10⁶ doi:10.1111/j.1460-2695.2010.01450.x Industrial experiences of bending fatigue strength in table liner for cement mill S.-H.BAEK,1S.-S.CHO 2and W.-S.JOO 3 1Graduate School of Mechanical Engineering,Dong-A University,840Hadan2-dong,Busan 604-714,Korea,2Department of Vehicle Engineering, College of Engineering,Kangwon National University,Samcheok,Gangwon-do 245-711,Korea,3Department of Mechanical Engineering,Dong-A University,840Hadan2-Dong,Busan 604-714,Korea Received in final form 17November 2009 A B S T R A C T A table liner for the vertical roller mill has been used to grind natural limestone.Un- expected fatigue failure accidents have occurred during portland cement manufacturing process.The design life of a table liner is 4×10⁷cycles,but the actual fatigue life of a table liner is 2×10⁶to 8×10⁶cycles.The fatigue crack of a table liner initiates from the outside edge of the grinding path of the limestone.When such a crack occurs,the table liner has to be replaced,and this requires 30%of the total maintenance cost of the vertical roller mill.Therefore,this study examines the fatigue failure of a table liner by plane-bending fatigue test,stress measurement test,finite element analysis and fatigue fracture analysis. Keywords bending fatigue strength;finite element analysis;Goodman diagram;stress-life curve;vertical roller mill. I N T R O D U C T I O N A vertical roller mill for cement production is far supe-rior than the existing tube mill with respect to energy efficiency.However,the table liner for a roller mill un-dergoes periodic repeated loading because it is a rotary machine.A fatigue function is expressed in terms of the stress ratio and mean https://www.360docs.net/doc/449661381.html,ually,a fatigue function uses the Goodman diagram.1–3Stress ratio R in a fatigue cycle is defined as follows.4,5R = σmin σmax (1) where σmin is the minimum stress and σmax is the maximum stress in a fatigue stress cycle. Joo et al.6,7reported that the loads applied to a turbine blade are repeated bending load,torsional load and cen-trifugal load.According to X-ray fractography and the Goodman diagram,repeated bending stress is the major cause of turbine blade fatigue failure.Mandell et al.4,8,9proposed the Goodman diagram based on 13stress ratios.This method formulated the S-N behaviour considering the effect of mean stress. Correspondence :W.-S.Joo.E-mail:wsjoo@dau.ac.kr Figure 1shows the photograph of the vertical roller mill analyzed in this study.The vertical roller mill consisted of two rolling tires and a table liner with eight steel plates.The table liner was made of SC450steel and had a plasma-sprayed WC-15%Co coating layer.The expected design fatigue life of the table liner was 4×10⁷cycles,but the actual fatigue life was 2×10⁶to 8×10⁶cycles.The surface hardening layer of the table liner was subjected to wear and repeated bending tensile load.The prema-ture failure of the table liner can be ascertained from data on the contact fatigue.But,the surface hardening layer of the table liner was made of a big-particulate material.That is,the macrostructure of the material can relieve the stress concentration due to contact.A table liner is a rotary machine component with a very complex fail-ure pattern.Therefore,it is very difficult to simulate the in-service conditions of a table liner.In this study,the fatigue strength of a table liner is estimated by stress mea-surement,finite element analysis (FEA),bending fatigue test and the Goodman diagram. M A T E R I A L A N D E X P R I M E N T A L P R O C E D U R E S Material and test specimen Figure 2shows the failure pattern of the table liner exam-ined in this study.Crack initiated from the corner of the 358c 2010Blackwell Publishing Ltd.Fatigue Fract Engng Mater Struct 33,358–364 Fatigue & Fracture of Engineering Materials & Structures 齿轮的直径计算方法: 齿顶圆直径=(齿数+2)*模数 分度圆直径=齿数*模数 齿根圆直径=齿顶圆直径-(4.5×模数) 比如:M4 32齿34*3.5 齿顶圆直径=(32+2)*4=136 分度圆直径=32*4=128 齿根圆直径=136-4.5*4=118 7M 12齿 中心距(分度圆直径1+分度圆直径2)/2 就是(12+2)*7=98 这种计算方法针对所有的模数齿轮(不包括变位齿轮)。 模数表示齿轮牙的大小。 齿轮模数=分度圆直径÷齿数 =齿轮外径÷(齿数-2) 齿轮模数是有国家标准的(1357-78) 模数标准系列(优先选用)1、1.25、1.5、2、2.5、3、4、5、6、8、10、12、14、16、20、25、32、40、50 模数标准系列(可以选用)1.75,2.25,2.75,3.5,4.5,5.5,7,9,14,18,22,28,36,45 模数标准系列(尽可能不用)3.25,3.75,6.5,11,30 上面数值以外为非标准齿轮,不要采用! 塑胶齿轮注塑后要不要入水除应力 精确测定斜齿轮螺旋角的新方法 ()周节 齿轮分度圆直径d的大小可以用模数(m)、径节()或周节()与齿数(z)表示 径节P()是指按齿轮分度圆直径(以英寸计算)每英寸上所占有的齿数而言 径节与模数有这样的关系: 25.4 1/8模=25.48=3.175 3.175/3.1416(π)=1.0106模 1) 什么是「模数」? 模数表示轮齿的大小。 R模数是分度圆齿距与圆周率(π)之比,单位为毫米()。 除模数外,表示轮齿大小的还有CP(周节:)与DP(径节:)。【参考】齿距是相邻两齿上相当点间的分度圆弧长。 2) 什么是「分度圆直径」? 分度圆直径是齿轮的基准直径。 决定齿轮大小的两大要素是模数和齿数、 分度圆直径等于齿数与模数(端面)的乘积。 过去,分度圆直径被称为基准节径。最近,按标准,统一称为分度圆直径。 3) 什么是「压力角」? 齿形与分度圆交点的径向线与该点的齿形切线所夹的锐角被称为分度圆压力角。一般所说的压力角,都是指分度圆压力角。 最为普遍地使用的压力角为20°,但是,也有使用14.5°、15°、17.5°、22.5°压力角的齿轮。 4) 单头与双头蜗杆的不同是什么? 蜗杆的螺旋齿数被称为「头数」,相当于齿轮的轮齿数。 齿轮接触疲劳强度试验方法(GB/T14229-93) 1主题内容与适用范围 本标准规定了测定渐开线圆柱齿轮接触疲劳强度的试验方法,以确定齿轮接触承载能力所需的基础数据。 本标准适用于钢、铸铁制造的渐开线圆柱齿轮由齿面点蚀损伤而失效的试验。其它金属齿轮的接触疲劳强度试验可参照使用。 4试验方法 确定齿轮接触疲劳强度应在齿轮试验机上进行试验齿轮的负荷运转试验。当齿面出现接触疲劳失效或齿面应力循环次数达到规定的循环基数N。而未失效时(以下简称“越出”),试验终止并获得齿面在试验应力下的一个寿命数据。当试验齿轮及试验过程均无异常时,通常将该数据称为“试验点”。根据不同的试验目的,选择小列不同的试验点的组合,经试验数据的统计处理,确定试验齿轮的接触疲劳特性曲线及接触疲劳极限应力。 4.1常规成组法 常规成组法用于测定试验齿轮的可靠度-应力-寿命曲线(即R-S-N曲线),求出试验齿轮的接触疲劳极限应力。 试验时取4~5个应力级,每个应力级不少于5个试验点(不包括越出点)。最高应力有中的各试验点的齿面应力循环次数不少于1×10⁶。最高应力级与次高应力级的应力间隔为总试验应力范围的40%~50%,随着应力的降低,应力间隔逐渐减少。最低应力级至少有一个试验点越出。 4.2少试验点组合法 少试验点组合法通常用于测定S-N曲线或仅测定极限应力。 试验时试验点总数为7~16个。测定S-N曲线时,应力级为4~10个,每个应力级取1~4个试验点。 测定极限应力时可采用升降法。 采用正交法进行对比试验时,每个对比因素至少有3个试验点。 5试验条件及试验齿轮 5.1齿轮接触疲劳强度试验按下述规定的试验条件和试验齿轮进行(对比试验的研究对象除外),上此可确定试验齿轮的接触疲劳极限应力σHlim。 1. 图示悬臂梁,横截面为矩形,承受载荷F 1与F 2作用,且F 1=2 kN ,F 2=5 kN ,试计算 梁的最大弯曲正应力,及该应力所在截面上K 点处的弯曲正应力。 解:(1) 画梁的弯矩图 (2) 最大弯矩(位于F 2作用点所在横截面): M max =2kNm (3) 计算应力: 最大应力:MPa W M Z 9.466 1080401029 23 max max =???==-σ 1 z K 点的应力:MPa I y M Z K 2.3512 1080401021233 max =???== -σ 5. 铸铁梁的载荷及截面尺寸如图所示。许用拉应力[σl ]=40 MPa ,许用压应力[σc ]=160 MPa 。 解:(1) 画梁的弯矩图 x 由弯矩图知:可能危险截面是B 和C 截面 (2) 计算截面几何性质 形心位置和形心惯性矩 mm A y A y i Ci i C 5.15730 20020030100 3020021520030=?+???+??=∑∑= 4 6232 310125.60200 30)1005.157(12 2003020030)5.157215(1230200m I zC -?=??-+?+??-+?=(3) 强度计算 B 截面的最大压应力 3max 6 20100.157552.4 []60.12510 B C C C zC M y MPa I σσ-??===?p B 截面的最大拉应力 3max 6 (0.23)2010(0.230.1575) 24.12 []60.12510 B C t t zC M y MPa I σσ--?-===?p C 截面的最大拉应力 3max 6 10100.157526.2 []60.12510C C t t zC M y MPa I σσ-??===?p 梁的强度足够。 材料力学的基本计算公式 外力偶矩计算公式(P功率,n转速) 1.弯矩、剪力和荷载集度之间的关系式 2.轴向拉压杆横截面上正应力的计算公式(杆件横 截面轴力F N,横截面面积A,拉应力为正) 3.轴向拉压杆斜截面上的正应力与切应力计算公式(夹角 a 从x轴正方向逆时针转至外法线的方位角为正) 4.纵向变形和横向变形(拉伸前试样标距l,拉伸后试样 标距l1;拉伸前试样直径d,拉伸后试样直径d1) 5.纵向线应变和横向线应变 6.泊松比 7.胡克定律 8.受多个力作用的杆件纵向变形计算公式? 9.承受轴向分布力或变截面的杆件,纵向变形计算公式 10.轴向拉压杆的强度计算公式 11.许用应力,脆性材料,塑性材 料 12.延伸率 13.截面收缩率 14.剪切胡克定律(切变模量G,切应变g ) 15.拉压弹性模量E、泊松比和切变模量G之间关系 式 16.圆截面对圆心的极惯性矩(a)实心圆 (b)空心圆 17.圆轴扭转时横截面上任一点切应力计算公式(扭矩 T,所求点到圆心距离r) 18.圆截面周边各点处最大切应力计算公式 19.扭转截面系数,(a)实心圆 (b)空心圆 20.薄壁圆管(壁厚δ≤ R0/10 ,R0为圆管的平均半 径)扭转切应力计算公式 21.圆轴扭转角与扭矩T、杆长l、扭转刚度GH p的关 系式 22.同一材料制成的圆轴各段的扭矩不同或各段的直 径不同(如阶梯轴)时或 23.等直圆轴强度条件 24.塑性材料;脆性材料 25.扭转圆轴的刚度条件? 或 26.受压圆筒形薄壁容器横截面和纵截面上的应力计 算公式, 27.平面应力状态下斜截面应力的一般公式 , 28.平面应力状态的三个主应力 , , 29.主平面方位的计算公式 30.面最大切应力 31.受扭圆轴表面某点的三个主应力,, 32.三向应力状态最大与最小正应力 , 33.三向应力状态最大切应力 34.广义胡克定律 1. 齿面接触疲劳强度的计算 齿面接触疲劳强度的计算中,由于赫兹应力是齿面间应力的主要指标,故把赫兹应力作为齿面接触应力的计算基础,并用来评价接触强度。齿面接触疲劳强度核算时,根据设计要求可以选择不同的计算公式。用于总体设计和非重要齿轮计算时,可采用简化计算方法;重要齿轮校核时可采用精确计算方法。 分析计算表明,大、小齿轮的接触应力总是相等的。齿面最大接触应力一般出现在小轮单对齿啮合区内界点、节点和大轮单对齿啮合区内界点三个特征点之一。实际使用和实验也证明了这一规律的正确。因此,在齿面接触疲劳强度的计算中,常采用节点的接触应力分析齿轮的接触强度。强度条件为:大、小齿轮在节点处的计算接触应力均不大于其相应的许用接触应力,即: ⑴圆柱齿轮的接触疲劳强度计算 1)两圆柱体接触时的接触应力 在载荷作用下,两曲面零件表面理论上为线接触或点接触,考虑到弹性变形,实际为很小的面接触。两圆柱体接触时的接触面尺寸和接触应力可按赫兹公式计算。 两圆柱体接触,接触面为矩形(2axb),最大接触应力σHmax位于接触面宽中线处。计算公式为: 接触面半宽: 最大接触应力: ?F——接触面所受到的载荷 ?ρ——综合曲率半径,(正号用于外接触,负号用于内接触) ?E1、E2——两接触体材料的弹性模量 ?μ1、μ2——两接触体材料的泊松比 2)齿轮啮合时的接触应力 两渐开线圆柱齿轮在任意一处啮合点时接触应力状况,都可以转化为以啮合点处的曲率半径ρ1、ρ2为半径的两圆柱体的接触应力。在整个啮合过程中的最大接触应力即为各啮合点接触应力的最大值。节点附近处的ρ虽然不是最小值,但节点处一般只有一对轮齿啮合,点蚀也往往先在节点附近的齿根表面出现,因此,接触疲劳强度计算通常以节点为最大接触应力计算点。 参数直齿圆柱齿轮斜齿圆柱齿轮 节点处的载荷为 齿面接触疲劳强度计算 一、轮齿受力 分析 一对直齿圆锥 齿轮啮合传动 时,如果不考虑 摩擦力的影响,轮齿间的作用力可以近似简化为作用于齿宽中点节线的集中载荷f n,其方向垂直于工作齿面。如图6-14所示主动锥齿轮的受力情况,轮齿间的法向作用力f n可分解为三个互相垂直的分力:圆周力f t1、径向力f r1和轴向力f a1。各力的大小为: = (6-15) 式中:d m1为主动锥齿轮分度圆锥上齿宽中点处的直径,也称分度圆锥的平均直径,可根据锥距r、齿宽b和分度圆直径d1确定,即: d m1=(1-0.5)d1(6-16) 式中:称齿宽系数,通常取=0.25~0.35 圆周力的方向在主动轮上与回转方向相反,在从动轮上与回转方向相同;径向力的方向分别指向各自的轮心;轴向力的方向分别指向大端。根据作用力与反作用力的原理得主、从动轮上三个分力之间的关系:f t1 =-f t2、f r1=- f a2、f a1= -f r2,负号表示方向相反。 二、齿面接触疲劳强度计算 直齿圆锥齿轮的失效形式及强度计算的依据与直齿圆柱齿轮基本相同,可近似按齿宽中点的一对当量直齿圆柱齿轮来考虑。将当量齿轮有关参数代入直齿圆柱齿轮齿面接触疲劳强度计算公式,则得圆锥齿轮齿面接触疲劳强度的计算公式分别为 ≤(6-17) d1 ≥(6-18) 式中:z e为齿轮材料弹性系数,见表6-5;z h为节点啮合系数,标准齿轮正 确安装时z h =2 .5;为许用应力,确定方法与直齿圆柱齿轮相同。 三、齿根弯曲疲劳强度计算 将当量齿轮有关参数代入直齿圆柱齿轮齿根弯曲疲劳强度计算公式,则得圆锥齿轮齿根弯曲疲劳强度的计算公式为 ≤(6-19) m ≥ (6-20) 式中:为齿形系数,应根据当量齿数z v(z v=z/cosδ)由图6-8查得;[]为许用弯曲应力,确定方法与直齿圆柱齿轮相同。 ######################################################################## ## 渐开线圆柱齿轮疲劳强度计算法## ## ( GB/T3480-97,ISO6336-1996 ) ## ## 2014-03-14 ################郑州机械研究所################ 09:47:49 ## ------------------基本输入参数-------------------------- 小轮总扭矩(N.m)T = 1475.0 小轮转速(转/分)RPM1 = 354.0 大轮转速(转/分)RPM2 = 91.624 实际速比U = 3.8636 中心距(mm) A = 275.001 法向模数(mm)Mn = 5.0 螺旋角(度)β= 11.0 法向齿形角(度)αn = 20.0 ------------------------------------------------------------------------------------------------------ 小齿轮大齿轮 齿轮齿数Z = 22 85 总有效齿宽(mm) B = 110.0 110.0 变位系数Xn = 0.3886 0.1262 齿顶高系数Ha* = 1.0 1.0 顶隙系数Cn* = 0.25 0.25 ------------------齿轮几何参数----------------------------------------------------------- 小齿轮大齿轮 分度圆直径(mm) D = 112.059 432.955 节圆直径(mm) Dp = 113.084 436.917 基圆直径(mm) Db = 105.069 405.948 顶圆直径(mm) Da = 125.785 444.056 根圆直径(mm) Df = 103.445 421.717 齿顶厚(mm) Sa = 2.937 4.021 滑动率η= 0.991 0.991 分度圆线速度(m/s) V = 2.077 齿轮精度等级(GB 10095-1988) IQ = 6 端面重合度εα= 1.525 轴向重合度εβ= 1.336 ------------------材料及热处理等参数---------------------------------------------------------- 传动类型:减速传动 齿轮啮合类型:外啮合 螺旋角类型:斜齿 修形方式:齿向倒坡或有装配调整 6.1. 矩形截面悬臂梁如图所示,已知l =4 m , b / h =2/3,q =10 kN/m ,[σ]=10 MPa , 解:(1) 画梁的弯矩图 由弯矩图知: 2max 2 ql M = (2) 计算抗弯截面系数 32 323669 h bh h W === (3) 强度计算 2 2max max 3391 2[]29 416 277ql M ql h W h h mm b mm σσ= ==?≤∴≥==≥ ql 2x 6.2. 20a 工字钢梁的支承和受力情况如图所示,若[σ]=160 MPa ,试求许可载荷。 解:(1) 画梁的弯矩图 由弯矩图知: max 23 P M = (2) 查表得抗弯截面系数 6323710W m -=? (3) 强度计算 max max 66 22 3[] 33[]3237101601056.8822 P M P W W W W P kN σσσ-===?≤????∴≤== 取许可载荷 []57P kN = No20a x 6.3. 图示圆轴的外伸部分系空心轴。试作轴弯矩图,并求轴内最大正应力。 解:(1) 画梁的弯矩图 由弯矩图知:可能危险截面是C 和B 截面 (2) 计算危险截面上的最大正应力值 C 截面: 3max 3332 1.341063.20.06 32 C C C C C M M MPa d W σππ??====? B 截面: x 3max 3434 44 0.91062.10.060.045(1)(1)32320.06B B B B B B B M M MPa D d W D σππ?====?-- (3) 轴内的最大正应力值 MPa C 2.63max max ==σσ 6.5. 把直径d =1 m 的钢丝绕在直径为2 m 的卷筒上,设E =200 GPa ,试计算钢丝中产生 的最大正应力。 解:(1) 由钢丝的曲率半径知 1 M E M EI I ρ ρ= ∴= (2) 钢丝中产生的最大正应力 93 max 200100.510100 1 MR ER MPa I σρ-???==== 6.8. 压板的尺寸和载荷如图所示。材料为45钢,σs =380 MPa ,取安全系数n=1.5。试校 核压板的强度。 A-A弯曲疲劳强度的工业经验
标准齿轮模数齿数计算公式
齿轮接触疲劳强度试验方法
材料力学A弯曲应力作业答案解析
材料力学的基本计算公式-材料力学弯曲公式
齿轮传动的强度设计计算
齿面接触疲劳强度计算
齿轮疲劳强度计算
材料力学习题解答(弯曲应力)