考官Simon雅思小作文范文(22篇)
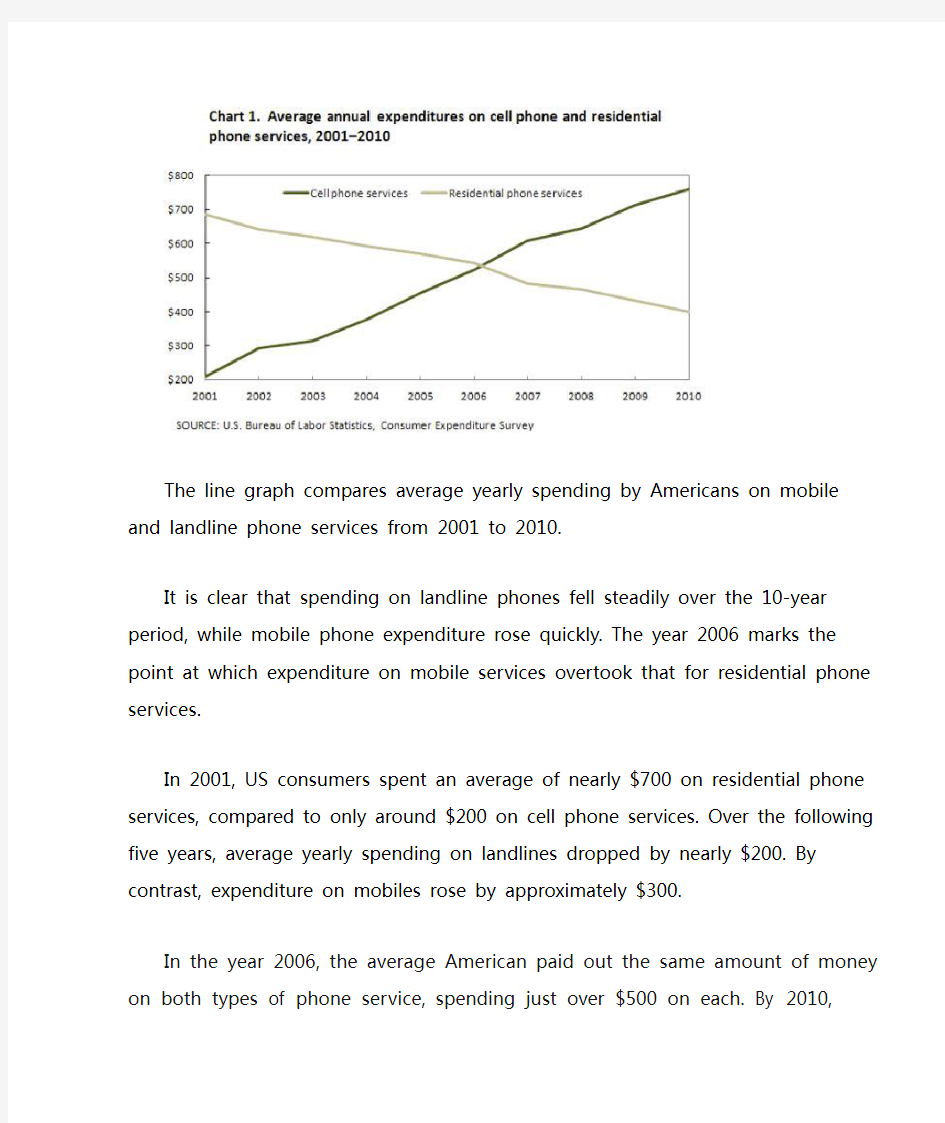

The line graph compares average yearly spending by Americans on mobile and landline phone services from 2001 to 2010.
It is clear that spending on landline phones fell steadily over the 10-year period, while mobile phone expenditure rose quickly. The year 2006 marks the point at which expenditure on mobile services overtook that for residential phone services.
In 2001, US consumers spent an average of nearly $700 on residential phone services, compared to only around $200 on cell phone services. Over the following five years,average yearly spending on landlines dropped by nearly $200. By contrast, expenditure on mobiles rose by approximately $300.
In the year 2006, the average American paid out the same amount of money on both types of phone service, spending just over $500 on each. By 2010, expenditure on mobile phones had reached around $750, while the figure for spending on residential services had fallen to just over half this amount.
The diagram illustrates the various stages in the life of a honey bee. We can see that the complete life cycle lasts between 34 and 36 days. It is also noticeable that there are five main stages in the development of the honey bee, from egg to mature adult insect.
The life cycle of the honey bee begins when the female adult lays an egg; the female typically lays one or two eggs every 3 days. Between 9 and 10 days later, each egg hatches and the immature insect, or nymph, appears.
During the third stage of the life cycle, the nymph grows in size and sheds its skin three times. This moulting first takes place 5 days after the egg hatches, then 7 days later, and again another 9 days later. After a total of 30 to 31 days from the start ofthe cycle, the young adult honey bee emerges from its final moulting stage, and in the space of only 4 days it reaches full maturity.
(169 words, band 9)
The chart compares average figures for temperature and precipitation over the course of a calendar year in Kolkata.
It is noticeable that monthly figures for precipitation in Kolkata vary considerably, whereas monthly temperatures remain relatively stable. Rainfall is highest from July to August, while temperatures are highest in April and May.
Between the months of January and May, average temperatures in Kolkata rise from their lowest point at around 20°C to a peak of just over 30°C. Average rainfall in the city also rises over the same period, from approximately 20mm of rain in January to 100mm in May.
While temperatures stay roughly the same for the next four months, the amount of rainfall more than doubles between May and June. Figures for precipitation remain above 250mm from June to September, peaking at around 330mm in July. The final three months of the year see a dramatic fall in precipitation, to a low of about 10mm in December, and a steady drop in temperatures back to the January average. (173 words, band 9)
Posted by Simon in IELTS
The bar charts compare students of different ages in terms of why they are studying and whether they are supported by an employer.
It is clear that the proportion of students who study for career purposes is far higher among the younger age groups, while the oldest students are more likely to study for interest. Employer support is more commonly given to younger students.
Around 80% of students aged under 26 study to further their careers, whereas only 10% study purely out of interest. The gap between these two proportions narrows as students get older, and the figures for those in their forties are the same, at about 40%. Students aged over 49 overwhelmingly study for interest (70%) rather than for professional reasons (less than 20%).
Just over 60% of students aged under 26 are supported by their employers. By contrast, the 30-39 age group is the most self-sufficient, with only 30% being given time off and help with fees. The figures rise slightly for students in their forties and for those aged 50 or more.
(178 words, band 9)
The bar chart compares the number of incidents and injuries for every 100 million passenger miles travelled on five different types of public transport in 2002.
It is clear that the most incidents and injuries took place on demand-response vehicles. By contrast, commuter rail services recorded by far the lowest figures.
A total of 225 incidents and 173 injuries, per 100 million passenger miles travelled, took place on demand-response transport services. These figures were nearly three times as high as those for the second highest category, bus services. There were 76 incidents and 66 people were injured on buses.
Rail services experienced fewer problems. The number of incidents on light rail trains equalled the figure recorded for buses, but there were significantly fewer injuries, at only 39. Heavy rail services saw lower numbers of such events than light rail services, but commuter rail passengers were even less likely to experience problems. In fact, only 20 incidents and 17 injuries occurred on commuter trains.
(165 words, band 9)
The line graph compares the percentage of people aged 65 or more in three countries over a period of 100 years.
It is clear that the proportion of elderly people increases in each country between 1940 and 2040. Japan is expected to see the most dramatic changes in its elderly population.
In 1940, around 9% of Americans were aged 65 or over, compared to about 7% of Swedish people and 5% of Japanese people. The proportions of elderly people in the USA and Sweden rose gradually over the next 50 years, reaching just under 15% in 1990. By contrast, the figures for Japan remained below 5% until the early 2000s. Looking into the future, a sudden increase in the percentage of elderly people is predicted for Japan, with a jump of over 15% in just 10 years from 2030 to 2040. By 2040, it is thought that around 27% of the Japanese population will be 65 years oldor more, while the figures for Sweden and the USA will be slightly lower, at about 25% and 23% respectively.
(178 words, band 9)
The table shows percentages of consumer expenditure for three categories of products and services in five countries in 2002.
It is clear that the largest proportion of consumer spending in each country went on food, drinks and tobacco. On the other hand, the leisure/education category has the lowest percentages in the table.
Out of the five countries, consumer spending on food, drinks and tobacco was noticeably higher in Turkey, at 32.14%, and Ireland, at nearly 29%. The proportion of spending on leisure and education was also highest in Turkey, at 4.35%, while expenditure on clothing and footwear was significantly higher in Italy, at 9%, than in any of the other countries.
It can be seen that Sweden had the lowest percentages of national consumer expenditure for food/drinks/tobacco and for clothing/footwear, at nearly 16% and just over 5% respectively. Spain had slightly higher figures for these categories, but the lowest figure for leisure/education, at only 1.98%.
The charts compare the amount of water used for agriculture, industry and homes around the world, and water use in Brazil and the Democratic Republic of Congo.
It is clear that global water needs rose significantly between 1900 and 2000, and that agriculture accounted for the largest proportion of water used. We can also see that water consumption was considerably higher in Brazil than in the Congo.
In 1900, around 500km3 of water was used by the agriculture sector worldwide. The figures for industrial and domestic water consumption stood at around one fifth of that amount. By 2000, global water use for agriculture had increased to around 3000km3, industrial water use had risen to just under half that amount, and domestic consumption had reached approximately 500km3.
In the year 2000, the populations of Brazil and the Congo were 176 million and 5.2 million respectively. Water consumption per person in Brazil, at 359m3, was much higher than that in the Congo, at only 8m3, and this could be explained by the fact that Brazil had 265 times more irrigated land.
(184 words, band 9)
The bar chart compares the cost of an average house in five major cities over a period of 13 years from 1989.
We can see that house prices fell overall between 1990 and 1995, but most of the cities saw rising prices between 1996 and 2002. London experienced by far the greatest changes in house prices over the 13-year period.
Over the 5 years after 1989, the cost of average homes in Tokyo and London dropped by around 7%, while New York house prices went down by 5%. By contrast, prices rose by approximately 2% in both Madrid and Frankfurt.
Between 1996 and 2002, London house prices jumped to around 12% above the 1989 average. Homebuyers in New York also had to pay significantly more, with prices rising to 5% above the 1989 average, but homes in Tokyo remained cheaper than they were in 1989. The cost of an average home in Madrid rose by a further 2%, while prices in Frankfurt remained stable.
(165 words)
The table gives information about poverty rates among six types of household in Australia in the year 1999.
It is noticeable that levels of poverty were higher for single people than for couples, and people with children were more likely to be poor than those without. Poverty rates were considerably lower among elderly people.
Overall, 11% of Australians, or 1,837,000 people, were living in poverty in 1999. Aged people were the least likely to be poor, with poverty levels of 6% and 4% for single aged people and aged couples respectively.
Just over one fifth of single parents were living in poverty, whereas only 12% of parents living with a partner were classed as poor. The same pattern can be seen for people with no children: while 19% of single people in this group were living below the poverty line, the figure for couples was much lower, at only 7%.
(150 words, band 9)
The map shows two potential locations (S1 and S2) for a new supermarket in a town called Garlsdon.
The main difference between the two sites is that S1 is outside the town, whereas S2 is in the town centre. The sites can also be compared in terms of access by roador rail, and their positions relative to three smaller towns.
Looking at the information in more detail, S1 is in the countryside to the north west of Garlsdon, but it is close to the residential area of the town. S2 is also close to the housing area, which surrounds the town centre.
There are main roads from Hindon, Bransdon and Cransdon to Garlsdon town centre, but this is a no traffic zone, so there would be no access to S2 by car. By contrast, S1 lies on the main road to Hindon, but it would be more difficult to reach from Bransdon and Cransdon. Both supermarket sites are close to the railway that runs through Garlsdon from Hindon to Cransdon.
The bar chart compares consumer spending on six different items in Germany, Italy, France and Britain.
It is clear that British people spent significantly more money than people in the other three countries on all six goods. Of the six items, consumers spent the most money on photographic film.
People in Britain spent just over £170,000 on photographic film, which is the highest figure shown on the chart. By contrast, Germans were the lowest overall spenders, with roughly the same figures (just under £150,000) for each of the six products. The figures for spending on toys were the same in both France and Italy, at nearly £160,000. However, while French people spent more than Italians on photographic film and CDs, Italians paid out more for personal stereos, tennis racquets and perfumes. The amount spent by French people on tennis racquets, around £145,000, is the lowest figure shown on the chart.
The diagrams show how house designs differ according to climate.
The most noticeable difference between houses designed for cool and warm climates is in the shape of the roof. The designs also differ with regard to the windows and the use of insulation.
We can see that the cool climate house has a high-angled roof, which allows sunlight to enter through the window. By contrast, the roof of the warm climate house has a peak in the middle and roof overhangs to shade the windows. Insulation and thermal building materials are used in cool climates to reduce heat loss, whereas insulation and reflective materials are used to keep the heat out in warm climates.
Finally, the cool climate house has one window which faces the direction of the sun, while the warm climate house has windows on two sides which are shaded from the sun. By opening the two windows at night, the house designed for warm climates can be ventilated.
(162 words, band 9)
The picture illustrates the way in which water passes from ocean to air to land during the natural process known as the water cycle.
Three main stages are shown on the diagram. Ocean water evaporates, falls as rain, and eventually runs back into the oceans again.
Beginning at the evaporation stage, we can see that 80% of water vapour in the air comes from the oceans. Heat from the sun causes water to evaporate, and water vapour condenses to form clouds. At the second stage, labelled ‘precipitation’ on the diagram, water falls as rain or snow.
At the third stage in the cycle, rainwater may take various paths. Some of it may fall into la kes or return to the oceans via ‘surface runoff’. Otherwise, rainwater may filter through the ground, reaching the impervious layer of the earth. Salt water intrusion is shown to take place just before groundwater passes into the oceans to complete the cycle.
(156 words, band 9)
The first picture shows the layout of an art gallery, and the second shows some proposed changes to the gallery space.
It is clear that significant changes will be made in terms of the use of floor space in the gallery. There will be a completely new entrance and more space for exhibitions. At present, visitors enter the gallery through doors which lead into a lobby. However, the plan is to move the entrance to the Parkinson Court side of the building, and visitors will walk straight into the exhibition area. In place of the lobby and office areas, which are shown on the existing plan, the new gallery plan shows an education area and a small storage area.
The permanent exhibition space in the redeveloped gallery will be about twice as large as it is now because it will occupy the area that is now used for temporary exhibitions. There will also be a new room for special exhibitions. This room is shown in red on the existing plan and is not currently part of the gallery.
(178 words, band 9)
The table shows data about the underground rail networks in six major cities.
The table compares the six networks in terms of their age, size and the number of people who use them each year. It is clear that the three oldest underground systems are larger and serve significantly more passengers than the newer systems. The London underground is the oldest system, having opened in 1863. It is also the largest system, with 394 kilometres of route. The second largest system, in Paris, is only about half the size of the London underground, with 199 kilometres of route. However, it serves more people per year. While only third in terms of size, the Tokyo system is easily the most used, with 1927 million passengers per year.
Of the three newer networks, the Washington DC underground is the most extensive, with 126 kilometres of route, compared to only 11 kilometres and 28 kilometres for the Kyoto and Los Angeles systems. The Los Angeles network is the newest, having opened in 2001, while the Kyoto network is the smallest and serves only 45 million passengers per year.
(185 words)
Cambridge IELTS book 7, page 101:
The pie charts compare the amount of electricity produced using five different sources of fuel in two countries over two separate years.
Total electricity production increased dramatically from 1980 to 2000 in both Australia and France. While the totals for both countries were similar, there were big differences in the fuel sources used.
Coal was used to produce 50 of the total 100 units of electricity in Australia in 1980, rising to 130 out of 170 units in 2000. By contrast, nuclear power became the most important fuel source in France in 2000, producing almost 75% of the country’s electricity.
Australia depended on hydro power for just under 25% of its electricity in both years, but the amount of electricity produced using this type of power fell from 5 to only 2 units in France. Oil, on the other hand, remained a relatively important fuel source inFrance, but its use declined in Australia. Both countries relied on natural gas for electricity production significantly more in 1980 than in 2000.
(170 words)
The chart gives information about UK immigration, emigration and net migration between 1999 and 2008.
Both immigration and emigration rates rose over the period shown, but the figures for immigration were significantly higher. Net migration peaked in 2004 and 2007.
In 1999, over 450,000 people came to live in the UK, while the number of people who emigrated stood at just under 300,000. The figure for net migration was around 160,000, and it remained at a similar level until 2003. From 1999 to 2004, the immigration rate rose by nearly 150,000 people, but there was a much smaller rise in emigration. Net migration peaked at almost 250,000 people in 2004.
After 2004, the rate of immigration remained high, but the number of people emigrating fluctuated. Emigration fell suddenly in 2007, before peaking at about 420,000 people in 2008. As a result, the net migration figure rose to around 240,000 in 2007, but fell back to around 160,000 in 2008.
It is clear from the charts that the figures for developed countries are much higher than those for developing nations. Also, the charts show an overall increase in participation in education and science from 1980 to 1990.
People in developing nations attended school for an average of around 3 years, with only a slight increase in years of schooling from 1980 to 1990. On the other hand, the figure for industrialised countries rose from nearly 9 years of schooling in 1980 to nearly 11 years in 1990.
From 1980 to 1990, the number of scientists and technicians in industrialised countries almost doubled to about 70 per 1000 people. Spending on research and development also saw rapid growth in these countries, reaching $350 billion in 1990. By contrast, the number of science workers in developing countries remained below 20 per 1000 people, and research spending fell from about $50 billion to only $25 billion.
(187 words)
The diagram below shows how the Australian Bureau of Meteorology collects
up-to-the-minute information on the weather in order to produce reliable forecasts.
The figure illustrates the process used by the Australian Bureau of Meteorology to forecast the weather.
There are four stages in the process, beginning with the collection of information about the weather. This information is then analysed, prepared for presentation, and finally broadcast to the public.
Looking at the first and second stages of the process, there are three ways of collecting weather data and three ways of analysing it. Firstly, incoming information can be received by satellite and presented for analysis as a satellite photo. The same data can also be passed to a radar station and presented on a radar screen or synoptic chart. Secondly, incoming information may be collected directly by radar and analysed on a radar screen or synoptic chart. Finally, drifting buoys also receive data which can be shown on a synoptic chart.
At the third stage of the process, the weather broadcast is prepared on computers. Finally, it is delivered to the public on television, on the radio, or as a recorded telephone
雅思6.5分 小作文范文参考
●批改By Will 本次批改严格按照ILETS小作文评分标准进行。ILETS小作文评分项:TA (内容的完整性), CC (连贯性及一致性), GRA (语法范围及精准度), LR (词汇资源)。文末会进行总评及打分。 ●文中标识: 用词不当逻辑错误语法错误修改添加 The graph provides the information concerning the average temperatures on a month basis in three major cities.(介于有两张图,都要提一下。此后可加一句:In addition, clearly demonstrated in the table are the time of sunshine on an annual base.) (补充:在下一段看到了你对于后一张图的总结,这样的话建议你在开头强调一下“the first graph”) As can be seen from the graph, there is a similar trend in terms of average monthly temperature between London and New York during the period from January to December. (可加入连接词:To be specific) The average temperature in London (介于你后面写的是两个城市的数据,这里改为:for both of the cities) gradually rises from January to July both in London and new york, reaching a peak at 25 degrees and 20 degrees respectively. After that, the following 4 months witness a dramatic decrease both in London and new york. In comparison (这里不妨分段), an opposite trend is found in Sydney. It (这是悉尼的第一句,建议写出来具体的量词至少:The temperature) keeps stable at 25 degrees from January to march, after which the average temperature undergoes a considerable descent, reaching the bottom point at approximately 15 degrees, before there is (there is 没必要了,可以去除) a steady ascent by 10 degrees. It is obvious that the table depicts the average number of hours of sunshine per year in three major cities. As we can see from the statistics, when it comes to the total annual hours of sunshine, new york ranks first, followed by Sydney ,London lies last. Specifically, people who live in new york enjoy 2,353 hours of sunshine every year, which is similar to people living in London with 2,473 hours (不是人和人像,是时间长短像,改为:which is similar to the amount of sunshine for those in London). However, only 1,180 hours of sunshine are found in London annually. 总评6.5(TA6.5 CC6.5 LR6.5 GRA7.0) 1.语法变化上从句数量可以了,分词的使用还可以多一些。偶尔试试一到两句倒装,如我在开头给你的那个。 2.趋势等词汇变化可以,试着多换换题目话题词汇,如people=residents=citizens
最新雅思考官满分范文12篇资料
Writing Task2 Topics 2-2 “Prevention is better than cure.” Out of a country’s health budget, a large proportion should be diverted from treatment to spending on health education and preventative measures. To what extent do you agree or disagree with this statement? 3-2 When a country develops its technology, the traditional skills and ways of life die out. It is pointless to try and keep them alive. To what extent do you agree or disagree with this opinion? 6-GB Using a computer everyday can have more negative than positive effects on young children. Do you agree or disagree? 5-2 In some countries young people are encouraged to work or travel for a year between finishing high school and starting university studies. Discuss the advantages and disadvantages for young people who decide to do this. 4-GB Some people believe that children should be allowed to stay at home and play until they are six or seven years old. Others believe that it is important for young children to go to school as soon as possible. What do you think are the advantages of attending school from a young age? 6-2 Successful sports professionals can earn a great deal more money than people in other important professions. Some people think this is fully justified while others think it is unfair. Discuss both these views and give your own opinion. 6-4 Some people prefer to spend their lives doing the same things and avoiding change. Others, however, think that change is always a good thing. Discuss both these views and give your own opinion. 3-3 In many countries children are engaged in some kind of paid work. Some people regard this as completely wrong, while others consider it as valuable work experience important for learning and taking responsibility. What are your opinions on this? 4-2 Happiness is considered very important in life. Why is it difficult to define? What factors are important in achieving happiness? 4-4 In many countries schools have severe problems with students behavior. What do you think are the causes of this? What solutions can you suggest? 5-GB Nowadays we are producing more and more rubbish. Why do you think this happening? What can governments do to help reduce the amount of rubbish produced?
Simon考官9分小作文范文合集
雅思小作文范文 整理自雅思考官simon博客 The table below gives information about the underground railway systems in six cities. Full essay (band 9): The table shows data about the underground rail networks in six major cities. The table compares the six networks in terms of their age, size and the number of people who use them each year. It is clear that the three oldest underground systems are larger and serve significantly more passengers than the newer systems. The London underground is the oldest system, having opened in 1863. It is also the largest sy stem, with 394 kilometres of route. The second largest system, in Paris, is only about half the size of the London underground, with 199 kilometres of route. However, it serves more peopl e per year. While only third in terms of size, the Tokyo system is easily the most used, with 1 927 million passengers per year. Of the three newer networks, the Washington DC underground is the most extensive, with 12 6 kilometres of route, compared to only 11 kilometres and 28 kilometres for the Kyoto and L os Angeles systems. The Los Angeles network is the newest, having opened in 2001, while th e Kyoto network is the smallest and serves only 45 million passengers per year. (185 words)
作文范文之雅思小作文真题
作文范文之雅思小作文真题
雅思小作文真题 【篇一:雅思作文题目汇总】 一、教育 1、教育应该包括哪些内容? 母题:it is generally believed that education is of vital importance to the development of individuals and the well-being of societies. what should education consist of to fulfil both these functions? (050312) 提示:本题围绕教育的两大功能来展开(个人与社会),准备好这篇文章,即可应付教育类话题中的最大分支—教育的功能,做到以不变应万变。对于社会角度,可以从促进经济发展、增加社会流动性(social mobility)、维护社会稳定这几个方面来展开,对于个人,可以写改变思维模式、有利于就业和便利生活来写。 子题:大学应当教授理论知识还是实践技能?大学的是应当把学生培养成合格的公民还是让他们自己得益?准备未来职业最好的方法是上大学还是尽快离校积累工作经验?大学要不要扩招?中学阶段应当提供通才教育还是专才教育?要不要延长义务教育年限?要不要让农村地区的学生更容易上学?老师要教学生如何判断是非吗? 2、学校的科目谁来选择?(060916) 母题:some people think that the government should decide which subjects students should study at the university, while others think that students should be allowed to apply for the subject they prefer. discuss the two views and give your opinion. 提示:这类题目采取的策略就是“双批判”,因为题目中提供的两种选择往往都是错误的。
雅思小作文及范文汇总
101. You should spend about 20 minutes on this task. The line graph below gives information about the number of visitors to three London museums between June and September 2013. Summarise the information by selecting and reporting the main features, and make comparisons where relevant. Write at least 150 words. Test Tip Check the horizontal axis to find whether the graph refers to past, present, future or all three. We use the present simple to describe the graph: The graph shows… , We can see… If the graph refers to past period of time, we use the past simple, and if the graph includes future times, we use will or it is predicted that. Look at the line graph and complete the text with the correct forms of the verbs in brackets and the correct prepositions.
剑桥英语雅思考官范文大作文小作文
剑10 1-2 It is important for children to learn the difference between right and wrong at an early age. Punishment is necessary to help them learn this distinction. To what extent do you agree or disagree with this opinion What sort of punishment should parents and teachers be allowed to use to teach good behavior to children One important stage in a child’s growth is certainly the development of a conscience, which is linked to the ability to tell right from wrong. This skill comes with time and good parenting, and my firm conviction is that punishment does not have much of a role to play in this. Therefore I have to disagree almost entirely with the given statement. To some extent the question depends on the age of the child. To punish a very young child is both wrong and foolish, as an infant will not understand what is happening or why he or she is being punished. Once the age of reason is reached however, a child can be rewarded for good behavior and discouraged from bad. This kind but firm approach will achieve more than harsh punishments, which might entail many negative consequences unintended by the parents. To help a child learn the difference between right and wrong, teachers and parents should firstly provide good role modelling in their own behavior. After that, if sanctions are needed, the punishment should not be of a physical nature, as that merely sends the message that it is acceptable for larger people to hit smaller ones-an outcome which may well result in the child starting to bully others. Nor should the punishment be in any way cruel.
雅思考官级9分范文:现代人的独立
雅思考官级9分范文:现代人的独立 题目:Some people think that in the modern world we are more dependent on each other, while others think that people have become more independent. Discuss both views and give your own opinion. 范文: People have different views about whether we are more or less dependent on others nowadays. In my view, modern life forces us to be more independent than people were in the past. There are two main reasons why it could be argued that we are more dependent on each other now. Firstly, life is more complex and difficult, especially because the cost of living has increased so dramatically. For example, young adults tend to rely on their parents for help when buying a house. Property prices are higher than ever, and without help it would be impossible for many people to pay a deposit and a mortgage. Secondly, people
剑桥英语7雅思考官范文(大作文+小作文)
It is generally believed that some people are born with certain talents, for instance for sport or music, and others are not. However, it is sometimes claimed that any child can be taught to become a good sports person or musician. Discuss both these views and give your own opinion. The relative importance of natural talent and training is a frequent topic of discussion when people try to explain different levels of ability in, for example, sport, art or music. Obviously, education systems are based on the belief that all children can effectively be taught to acquire different skills, including those associated with sport, art or music. So from our own school experience, we can find plenty of evidence to support the view that a child can acquire these skills with continued teaching and guided practices. I personally think that some people do have talents that are probably inherited via their genes. Such talents can give individuals a facility for certain skills that allow them to excel, while more hard-working students never manage to reach a comparable level. But, as with all questions of nature versus nurture,they are not mutually exclusive. Good musicians or artists and exceptional sports stars have probably succeeded because of both good training and natural talent. Without the natural talent, continuous training would be neither attractive nor productive, and without the training,the child would not learn how to exploit and develop their talent. In conclusion. I agree that any child can be taught particular skills, but to be really good in areas such as music, art or sport, then some natural talent is
雅思考官级9分范文:环境污染我们能做什么
雅思考官级9分范文:环境污染我们能做什么 题目是Explain some of the ways in which humans are damaging the environment. What can governments do to address these problems? What can individual people do? 9分范文: Humans are responsible for a variety of environmental problems, but we can also take steps to reduce the damage that we are causing to the planet. This essay will discuss environmental problems and the measures that governments and individuals can take to address these problems. Two of the biggest threats to the environment are air pollution and waste. Gas emissions from factories and exhaust fumes from vehicles lead to global warming, which may have a devastating effect on the planet in the future. As the human population increases, we are also producing ever greater quantities of waste, which contaminates the earth and pollutes rivers and oceans.
剑桥英语10雅思考官范文(大作文+小作文)
剑桥英语10雅思考官范文(大作文+小作文)
剑10 1-2 It is important for children to learn the difference between right and wrong at an early age. Punishment is necessary to help them learn this distinction. To what extent do you agree or disagree with this opinion? What sort of punishment should parents and teachers be allowed to use to teach good behavior to children? One important stage in a child’s growth is certainly the development of a conscience, which is linked to the ability to tell right from wrong. This skill comes with time and good parenting, and my firm conviction is that punishment does not have much of a role to play in this. Therefore I have to disagree almost entirely with the given statement. To some extent the question depends on the age of the child. To punish a very young child is both wrong and foolish, as an infant will not understand what is happening or why he or she is being punished. Once the age of reason is reached however, a child can be rewarded for good behavior and discouraged from bad. This kind but firm approach will achieve more than harsh punishments, which might entail many negative consequences unintended by the parents. To help a child learn the difference between right and wrong, teachers and parents should firstly provide good role modelling in their own behavior. After that, if sanctions are needed, the punishment should not be of a physical nature, as that merely sends the message that it is acceptable for larger people to hit smaller ones-an outcome which may well result in the child starting to bully others. Nor should the punishment be in any way cruel.
雅思剑桥部分Task1考官范文翻译
TEST2 此图表显示在所列出的四个欧洲国家中,英国对图中所包含各种商品的花费最高。对任一种商而言,英国人的相应花费都要比其它国人高出许多。只在网球拍上,英国人和另一个国家意大利人消费相当。 相比之下,德国人消费额度最低。在其对胶卷的消费上可见一斑,德国人远不如英国人对胶卷的花费。德国只在两种商品上的消费高于法国,分别是网球拍和香水。 与此同时,法国和意大利两国居民大体上消费水平居中,平均额度也趋同。具体来说,法国人对唱片和胶卷的消费要高于意大利人,然而对网球拍的消费不及意大利人。意大利人对随身听的花费略高于法国,玩具消费则在两国人中等同。 数据清楚表明,欧洲国家之间的消费习惯存在巨大差异。 TEST3 此数据表明了发展和发达国家对科教投入之间的差异。 就在校年数而言,我们可以看到在1980年,发达国家的人在校学习所用时间为8.5年,相比之下远远超过发展中国家的2.5年。这一差距在1990年扩大,两个数据分别增至10.5年和3.5年。 在图表二中,趋势也是如此。1980年至1990年,发达国家的科学家和技师的人数从每1000人中的55人升到85人,然而这一数据在发展中国家从12人升到20人。 最后,对研发项目的投资显示发达国家数据的不止翻了两番,从2000亿美元增长到4200亿美元,而发展中国家实际上有所削减,从750亿美元降至250亿美元。 总体上,我们可以看出两经济体之间不仅存在巨大差异,而且这一差异正在扩大。 IELTS4 TEST1 此表格对1999年澳大利亚不同类型的贫困家庭进行了分类。 平均来说,11%的家庭属于贫困家庭,其组成人数近200万。然而,那些单亲或独身家庭几乎在此比例上翻了两番,分别为21%和19%。 夫妇家庭一般更为富有。对丁克家庭而言,贫困比例(7%)较有孩子的家庭(12%)要低。明显的是,那时对有孩子的家庭来说,其贫困比例要高于平均比例。 老年人的贫穷可能性较小,即使数据再一次倾向老年夫妇(仅4%),而不是单身老年家庭(6%)。 总体上,表格显示单身家庭和那些有孩子的家庭生活贫困的可能性比那些夫妇家庭要大。 TEST3 此柱状图给出了1999年澳大利亚男性和女性所进修中学以上各个水平的教育文凭的信息。我们可以很快看出,男女比例在不同教育水平之间存在着巨大差异。最大的性别差异在于最低的中学以上水平,其中90%的男性获得了技校文凭,而女性只有10%的比例。相比之下,更多的女性获得了高职高专文凭(70%),女性中学历达到本科水平(55%)的比例也略高于男性。 就更高水平的教育而言,拥有研究生文凭的男性显然比女性多(分别为70%和30%)。此外,男性数量占博士生毕业的60%。 因此我们可以得出,更多的男性较女性来说获得了低等或高等教育文凭,而更多的女性拿到了本科水平。尽管男性差异在本科阶段最小。
雅思考官级9分范文:大学生该学什么
雅思考官级9分范文:大学生该学什么 题目是Some people think that all university students should study whatever they like. Others believe that they should only be allowed to study subjects that will be useful in the future, such as those related to science and technology. Discuss both these views and give your own opinion. 范文: People have different views about how much choice students should have with regard to what they can study at university. While some argue that it would be better for students to be forced into certain key subject areas, I believe that everyone should be able to study the course of their choice. There are various reasons why people believe that universities should only offer subjects that will be useful in the future. They may assert that university courses like medicine, engineering and information technology are
英语考试作文-9分雅思图表写作范文全集之地图篇 学校变迁
英语考试作文 9分雅思图表写作范文全集之地图篇学校 变迁 9分雅思图表小作文范文全集之地图学校变迁The diagrams below show the site of a school in 2004 and the plan for changes to the school site in 2024. 真题传送门:2017全年雅思写作真题范文大汇总(第一时间更新) 范文集结:全部9篇9分雅思写作地图范文汇总放送 范文 The two pictures compare the layout of a school as it was in the year 2004 with a proposed site design for the year 2024. It is clear that the main change for 2024 involves the addition of a new school building. The school will then be able to accommodate a considerably larger number of students. In 2004, there were 600 pupils attending the school,
and the two school buildings were separated by a path running from the main entrance to the sports field. By 2024, it is expected that there will be 1000 pupils, and a third building will have been constructed. Furthermore, the plan is to join the two original buildings together, creating a shorter path that links the buildings only. As the third building and a second car park will be built on the site of the original sports field, a new, smaller sports field will need to be laid. A new road will also be built from the main entrance to the second car park. Finally, no changes will be made to the main entrance and original car park. (183 words, band 9)
雅思考官范文精选,中英文对照1
原因解决论 1.what is the problem and the possible effect it causes 2.what are the causes of the problem 3.what are the solutions of the problem 4.the possible results of these solutions 例文 毫无疑问我们今天的生活中比过去的噪音要多得多,尤其是在城市,而这可能是对我们有最直接影响污染形式。举个例子来说,我们已经发现长时间接触高分贝的噪音可以导致听觉丧失和高血压。也可能带来压力,失眠和像压抑这样的心理问题。这些问题又通常导致工作效率低由于员工太累压力太大无法高效工作。There is no doubt that we have to live with far more noise than in the past, particularly in cities, and this may be the form of pollution which affects us most directly. For example, it has been found that prolonged exposure to high levels of noise can lead to hearing loss and high blood pressure. It may also give rise to stress, insomnia and mental problems including depression. These problems, in turn, often result in lower productivity at work because employees are too tired and stressed to work efficiently. 为了有效的解决这个问题,我们必须搞清楚什么导致了噪音的上升。有三个主要原因。第一,有交通噪音,原因是公路上不断增
雅思小作文范文-地图
The development of Chorleywood village from 1868 to 1994. 思路: 1. 严格按照时间的推进进行描述,不可以出现倒序或是插叙的情况。 2. 物体的坐标词汇应该是绝对方位词:东西南北,物体的大小词汇应该是相对单位词:较大,较小,倍数等。 3. 线段的描述应该包含两方面:方向和动作。 4. 注意使用被动句来表达客观存在。 答案: The map shows the changes and development of Chorleywood village in Great Britain over a period of 126 years from 1868 to 1994. Chronologically, during the first 15 years from 1868 to 1883, Chorleywood was merely a very small village with two crossing main roads for its all transportation. From 1883 to 1922, with the expansion to the south, a new living area took shape and almost tripled the original scale. Besides, in 1909, a railway line, parallel with the east-bound main road, was built, linking the east and west, as well as forming Chorleywood Station. During the next period between 1922 and 1970, Chorleywood extended both eastward and westward and almost doubled the previous size. The year 1970 saw another big change of Chorleywood--the establishment of a south-bound motorway as the axis, which connected east-west main road with the railway. By 1994, there emerged 5 new resident places and some entertainment including Chorleywood Park and Golf course, all of which scattered along the two sides of the newly-built traffic system.(177)