外文翻译

附件2:外文原文
Power Spectra Estimation
1. INTRODUCTION
Perhaps one of the more important application areas of digital signal processing(DSP) is the power spectral estimation of periodic and random signals. Speechrecognition problems use spectrum analysis as a preliminary measurement to performspeech bandwidth reduction and further acoustic processing. Sonar systems usesophisticated spectrum analysis to locate submarines and surface vessels. Spectralmeasurements in radar are used to obtain target location and velocity information. Thevast variety of measurements spectrum analysis encompasses is perhaps limitless andit will thus be the intent of this article to provide a brief and fundamental introductionto the concepts of power spectral estimation.
2.WHAT IS A SPECTRUM?
A spectrum is a relationship typically represented by a plot of the magnitude or relative value of some parameter against frequency. Every physical phenomenon,whether it be an electromagnetic, thermal, mechanical, hydraulic or any other system,has a unique spectrum associated with it. In electronics, the phenomena are dealt with in terms of signals, represented as fixed or varying electrical quantities of voltage,current and power. These quantities are typically described in the time domain and for every function of time, f(t), an equivalent frequency domain function F(0) can be found that specifically describes the frequency-component content (frequency spectrum) required to generate f(t). A study of relationships between the time domain and its corresponding frequency domain representation is the subject of Fourier analysis and Fourier transforms. Theforward Fourier transform , time to frequency domain, of the function x(t) is defined
and the inverse Fourier transform , frequency to time domain,of X(w) is
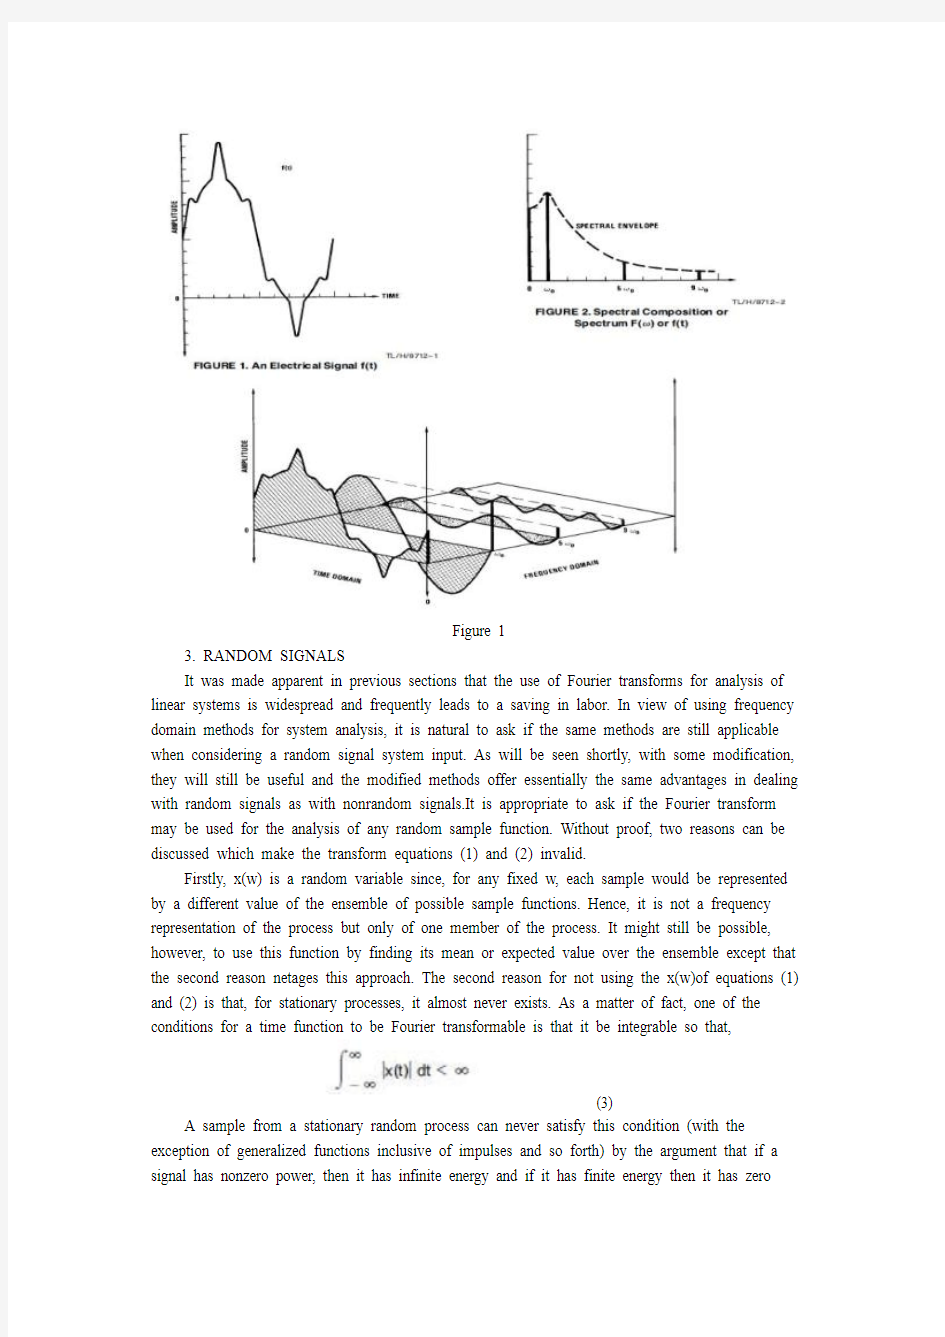
Though these expressions are in themselves self-explanatory, a short illustrative example will be presented to aid in relating the two domains. If an arbitrary time function representation of a periodic electrical signal, f(t), were plotted versus time as shown in Figure 1 , its Fourier transform would indicate a spectral content consisting of a DC component, a fundamental frequency component 0o, a fifth harmonic component 50o and a ninth harmonic component 90o (see Figure 2 ). It is illustratively seen in Figure 3 that the superposition of these frequency components, in fact, yields the original time function f(t).
Figure 1
3. RANDOM SIGNALS
It was made apparent in previous sections that the use of Fourier transforms for analysis of linear systems is widespread and frequently leads to a saving in labor. In view of using frequency domain methods for system analysis, it is natural to ask if the same methods are still applicable when considering a random signal system input. As will be seen shortly, with some modification, they will still be useful and the modified methods offer essentially the same advantages in dealing with random signals as with nonrandom signals.It is appropriate to ask if the Fourier transform may be used for the analysis of any random sample function. Without proof, two reasons can be discussed which make the transform equations (1) and (2) invalid.
Firstly, x(w) is a random variable since, for any fixed w, each sample would be represented by a different value of the ensemble of possible sample functions. Hence, it is not a frequency representation of the process but only of one member of the process. It might still be possible, however, to use this function by finding its mean or expected value over the ensemble except that the second reason netages this approach. The second reason for not using the x(w)of equations (1) and (2) is that, for stationary processes, it almost never exists. As a matter of fact, one of the conditions for a time function to be Fourier transformable is that it be integrable so that,
(3)
A sample from a stationary random process can never satisfy this condition (with the exception of generalized functions inclusive of impulses and so forth) by the argument that if a signal has nonzero power, then it has infinite energy and if it has finite energy then it has zero
power (average power). Shortly, it will be seen that the class of functions having no Fourier integral, due to equation (3), but whose average power is finite can be described by statistical means. Assuming x(t) to be a sample function from a stochastic process, a truncated version of the function xT(t) is defined as
4. WINDOWS
Prior to looking at other techniques of spectrum estimation, we find that to this point the subject of spectral windows has been brought up several times during the course of our discussion.
No elaboration, however, has been spent explaining their spectral effects and meaning.
In most applications it is desirable to taper a finite length data sequence at each end to enhance certain characteristics of the spectral estimate. The process of terminating a sequence after a finite number of terms can be thought of as multiplying an infinite length, i.e., impulse response sequence by a finite width window function.In other words, the window function determines how much of the original impulse sequence can be observed through this window, seeFigures 2a, 2b, and 2c . This tapering by mulitiplying the sequence by a data window is thus analogous to multiplying the correlation function by a lag window. In addition, since multiplication in the time domain is equivalent to convolution in the frequency domain then it is also analogous to convolving the Fourier transform of a finite-length-sequence with the Fourier transform of the window function, Figures 2d, 2e, and 2f . Note also that the Fourier transform of the rectangular window function exhibits significant oscillations and poor high frequency convergence, Figure 2e . Thus, when convolving this spectrum with a desired amplitude function, poor convergence of the resulting amplitude response may occur. This calls for investigating the use of other possible window functions that minimize some of the difficulties encountered with rectangular function.
Figure 2
In order for the spectrum of a window function to have minimal effects upon the desired
amplitude response, resulting from convolving two functions, it is necessary that the window spectrum approximate an impulse function. This implies that as much of its energy as possible should be concentrated at the center of the spectrum. Clearly, an ideal impulse spectrum is not feasible since this requires an infinitely long window.
In general terms, the spectrum of a window function typically consists of a main lobe, representing the center of the spectrum, and various side lobes, located on either side of The main lobe. It is desired that the window function satisfy two criteria; (1) that the main lobe should be as narrow as possible and (2) relative to the main lobe, the maximum side lobe level should be as small as possible. Unfortunately, however, both conditions cannot be simultaneously optimized so that, in practice, usable window functions represent a suitable compromise between the two criteria. A window function in which minimization of the main lobe width is the primary objective, fields a finer frequency resolution but suffers from some oscillations, i.e., the spectrum passband and substantial ripple in the spectrum stopband. Coversely, a window function in which minimization of the side lobe level is of primary concern tends to have a smoother amplitude response and very low ripple in the stopband but, yields a much poorer frequency resolution. Examining Figure 3 assume a hypothetical impulse response,Figure 3a , whose spectrum isFigure 3b . Multiplying the impulse response by the rectangular window,Figure 2b , yields the windowed impulse response, Figure 3c ,implying The convolution of the window spectrum,Figure 2e , with the impulse response spectrum, Figure 3b . The result of this convolution is seen inFigure 3d and is a distorted version of the ideal spectrum, Figure 3b , having passband oscillations and stopband ripple. Selecting another window, i.e., with more desirable spectral characteristics, we see the appropriately modified windowed data, Figure 3e , results in a very good approximation of Figure 3b .
This characteristically provides a smoother passband and lower stopband ripple level but sacrifices the sharpness of the roll-off rate inherent in the use of a rectangular window (compare Figures 3d and 3f ). Concluding this brief discussion, a few common window functions will next be considered.
Figure 3. (a)(b) Unmodified Data Sequence
(c)(d) Rectangular Windowed Data Sequence
(e)(f) Hamming Windowed Data Sequence
外文翻译
Load and Ultimate Moment of Prestressed Concrete Action Under Overload-Cracking Load It has been shown that a variation in the external load acting on a prestressed beam results in a change in the location of the pressure line for beams in the elastic range.This is a fundamental principle of prestressed construction.In a normal prestressed beam,this shift in the location of the pressure line continues at a relatively uniform rate,as the external load is increased,to the point where cracks develop in the tension fiber.After the cracking load has been exceeded,the rate of movement in the pressure line decreases as additional load is applied,and a significant increase in the stress in the prestressing tendon and the resultant concrete force begins to take place.This change in the action of the internal moment continues until all movement of the pressure line ceases.The moment caused by loads that are applied thereafter is offset entirely by a corresponding and proportional change in the internal forces,just as in reinforced-concrete construction.This fact,that the load in the elastic range and the plastic range is carried by actions that are fundamentally different,is very significant and renders strength computations essential for all designs in order to ensure that adequate safety factors exist.This is true even though the stresses in the elastic range may conform to a recognized elastic design criterion. It should be noted that the load deflection curve is close to a straight line up to the cracking load and that the curve becomes progressively more curved as the load is increased above the cracking load.The curvature of the load-deflection curve for loads over the cracking load is due to the change in the basic internal resisting moment action that counteracts the applied loads,as described above,as well as to plastic strains that begin to take place in the steel and the concrete when stressed to high levels. In some structures it may be essential that the flexural members remain crack free even under significant overloads.This may be due to the structures’being exposed to exceptionally corrosive atmospheres during their useful life.In designing prestressed members to be used in special structures of this type,it may be necessary to compute the load that causes cracking of the tensile flange,in order to ensure that adequate safety against cracking is provided by the design.The computation of the moment that will cause cracking is also necessary to ensure compliance with some design criteria. Many tests have demonstrated that the load-deflection curves of prestressed beams are approximately linear up to and slightly in excess of the load that causes the first cracks in the tensile flange.(The linearity is a function of the rate at which the load is applied.)For this reason,normal elastic-design relationships can be used in computing the cracking load by simply determining the load that results in a net tensile stress in the tensile flange(prestress minus the effects of the applied loads)that is equal to the tensile strength of the concrete.It is customary to assume that the flexural tensile strength of the concrete is equal to the modulus of rupture of the
网络营销外文翻译
E---MARKETING (From:E--Marketing by Judy Strauss,Adel El--Ansary,Raymond Frost---3rd ed.1999 by Pearson Education pp .G4-G25.) As the growth of https://www.360docs.net/doc/629542508.html, shows, some marketing principles never change.Markets always welcome an innovative new product, even in a crowded field of competitors ,as long as it provides customer value.Also,Google`s success shows that customers trust good brands and that well-crafted marketing mix strategies can be effective in helping newcomers enter crowded markets. Nevertheless, organizations are scrambling to determine how they can use information technology profitably and to understand what technology means for their business strategies. Marketers want to know which of their time-ested concepts will be enhanced by the Internet, databases,wireless mobile devices, and other technologies. The rapid growth of the Internet and subsequent bursting of the dot-com bubble has marketers wondering,"What next?" This article attempts to answer these questions through careful and systematic examination of successful e-mar-keting strategies in light of proven traditional marketing practices. (Sales Promotion;E--Marketing;Internet;Strategic Planning ) 1.What is E--Marketing E--Marketing is the application of a broad range of information technologies for: Transforming marketing strategies to create more customer value through more effective segmentation ,and positioning strategies;More efficiently planning and executing the conception, distribution promotion,and pricing of goods,services,and ideas;andCreating exchanges that satisfy individual consumer and organizational customers` objectives. This definition sounds a lot like the definition of traditional marketing. Another way to view it is that e-marketing is the result of information technology applied to traditional marketing. E-marketing affects traditional marketing in two ways. First,it increases efficiency in traditional marketing strategies.The transformation results in new business models that add customer value and/or increase company profitability.
交通灯外文翻译 2
当今时代是一个自动化时代,交通灯控制等很多行业的设备都与计算机密切相关。因此,一个好的交通灯控制系统,将给道路拥挤,违章控制等方面给予技术革新。随着大规模集成电路及计算机技术的迅速发展,以及人工智能在控制技术方面的广泛运用,智能设备有了很大的发展,是现代科技发展的主流方向。本文介绍了一个智能交通的系统的设计。该智能交通灯控制系统可以实现的功能有:对某市区的四个主要交通路口进行控制:个路口有固定的工作周期,并且在道路拥挤时中控制中心能改变其周期:对路口违章的机动车能够即时拍照,并提取车牌号。在世界范围内,一个以微电子技术,计算机和通信技术为先导的,一信息技术和信息产业为中心的信息革命方兴未艾。而计算机技术怎样与实际应用更有效的结合并有效的发挥其作用是科学界最热门的话题,也是当今计算机应用中空前活跃的领域。本文主要从单片机的应用上来实现十字路口交通灯智能化的管理,用以控制过往车辆的正常运作。 研究交通的目的是为了优化运输,人流以及货流。由于道路使用者的不断增加,现有资源和基础设施有限,智能交通控制将成为一个非常重要的课题。但是,智能交通控制的应用还存在局限性。例如避免交通拥堵被认为是对环境和经济都有利的,但改善交通流也可能导致需求增加。交通仿真有几个不同的模型。在研究中,我们着重于微观模型,该模型能模仿单独车辆的行为,从而模仿动态的车辆组。 由于低效率的交通控制,汽车在城市交通中都经历过长时间的行进。采用先进的传感器和智能优化算法来优化交通灯控制系统,将会是非常有益的。优化交通灯开关,增加道路容量和流量,可以防止交通堵塞,交通信号灯控制是一个复杂的优化问题和几种智能算法的融合,如模糊逻辑,进化算法,和聚类算法已经在使用,试图解决这一问题,本文提出一种基于多代理聚类算法控制交通信号灯。 在我们的方法中,聚类算法与道路使用者的价值函数是用来确定每个交通灯的最优决策的,这项决定是基于所有道路使用者站在交通路口累积投票,通过估计每辆车的好处(或收益)来确定绿灯时间增益值与总时间是有差异的,它希望在它往返的时候等待,如果灯是红色,或者灯是绿色。等待,直到车辆到达目的地,通过有聚类算法的基础设施,最后经过监测车的监测。 我们对自己的聚类算法模型和其它使用绿灯模拟器的系统做了比较。绿灯模拟器是一个交通模拟器,监控交通流量统计,如平均等待时间,并测试不同的交通灯控制器。结果表明,在拥挤的交通条件下,聚类控制器性能优于其它所有测试的非自适应控制器,我们也测试理论上的平均等待时间,用以选择车辆通过市区的道路,并表明,道路使用者采用合作学习的方法可避免交通瓶颈。 本文安排如下:第2部分叙述如何建立交通模型,预测交通情况和控制交通。第3部分是就相关问题得出结论。第4部分说明了现在正在进一步研究的事实,并介绍了我们的新思想。
建筑类外文文献及中文翻译
forced concrete structure reinforced with an overviewRein Since the reform and opening up, with the national economy's rapid and sustained development of a reinforced concrete structure built, reinforced with the development of technology has been great. Therefore, to promote the use of advanced technology reinforced connecting to improve project quality and speed up the pace of construction, improve labor productivity, reduce costs, and is of great significance. Reinforced steel bars connecting technologies can be divided into two broad categories linking welding machinery and steel. There are six types of welding steel welding methods, and some apply to the prefabricated plant, and some apply to the construction site, some of both apply. There are three types of machinery commonly used reinforcement linking method primarily applicable to the construction site. Ways has its own characteristics and different application, and in the continuous development and improvement. In actual production, should be based on specific conditions of work, working environment and technical requirements, the choice of suitable methods to achieve the best overall efficiency. 1、steel mechanical link 1.1 radial squeeze link Will be a steel sleeve in two sets to the highly-reinforced Department with superhigh pressure hydraulic equipment (squeeze tongs) along steel sleeve radial squeeze steel casing, in squeezing out tongs squeeze pressure role of a steel sleeve plasticity deformation closely integrated with reinforced through reinforced steel sleeve and Wang Liang's Position will be two solid steel bars linked Characteristic: Connect intensity to be high, performance reliable, can bear high stress draw and pigeonhole the load and tired load repeatedly.
外文翻译
Journal of Industrial Textiles https://www.360docs.net/doc/629542508.html,/ Optimization of Parameters for the Production of Needlepunched Nonwoven Geotextiles Amit Rawal, Subhash Anand and Tahir Shah 2008 37: 341Journal of Industrial Textiles DOI: 10.1177/1528083707081594 The online version of this article can be found at: https://www.360docs.net/doc/629542508.html,/content/37/4/341 Published by: https://www.360docs.net/doc/629542508.html, can be found at:Journal of Industrial TextilesAdditional services and information for https://www.360docs.net/doc/629542508.html,/cgi/alertsEmail Alerts: https://www.360docs.net/doc/629542508.html,/subscriptionsSubscriptions: https://www.360docs.net/doc/629542508.html,/journalsReprints.navReprints: https://www.360docs.net/doc/629542508.html,/journalsPermissions.navPermissions: https://www.360docs.net/doc/629542508.html,/content/37/4/341.refs.htmlCitations: - Mar 28, 2008Version of Record >>
建筑-外文翻译
外文文献: Risk Analysis of the International Construction Project By: Paul Stanford Kupakuwana Cost Engineering Vol. 51/No. 9 September 2009 ABSTRACT This analysis used a case study methodology to analyse the issues surrounding the partial collapse of the roof of a building housing the headquarters of the Standards Association of Zimbabwe (SAZ). In particular, it examined the prior roles played by the team of construction professionals. The analysis revealed that the SAZ’s traditional construction project was generally characterized by high risk. There was a clear indication of the failure of a contractor and architects in preventing and/or mitigating potential construction problems as alleged by the plaintiff. It was reasonable to conclude that between them the defects should have been detected earlier and rectified in good time before the partial roof failure. It appeared justified for the plaintiff to have brought a negligence claim against both the contractor and the architects. The risk analysis facilitated, through its multi-dimensional approach to a critical examination of a construction problem, the identification of an effective risk management strategy for future construction projects. It further served to emphasize the point that clients are becoming more demanding, more discerning, and less willing to accept risk without recompense. Clients do not want surprise, and are more likely to engage in litigation when things go wrong. KEY WORDS:Arbitration, claims, construction, contracts, litigation, project and risk The structural design of the reinforced concrete elements was done by consulting engineers Knight Piesold (KP). Quantity surveying services were provided by Hawkins, Leshnick & Bath (HLB). The contract was awarded to Central African Building Corporation (CABCO) who was also responsible for the provision of a specialist roof structure using patented “gang nail” roof
外文翻译中文版(完整版)
毕业论文外文文献翻译 毕业设计(论文)题目关于企业内部环境绩效审计的研究翻译题目最高审计机关的环境审计活动 学院会计学院 专业会计学 姓名张军芳 班级09020615 学号09027927 指导教师何瑞雄
最高审计机关的环境审计活动 1最高审计机关越来越多的活跃在环境审计领域。特别是1993-1996年期间,工作组已检测到环境审计活动坚定的数量增长。首先,越来越多的最高审计机关已经活跃在这个领域。其次是积极的最高审计机关,甚至变得更加活跃:他们分配较大部分的审计资源给这类工作,同时出版更多环保审计报告。表1显示了平均数字。然而,这里是机构间差异较大。例如,环境报告的数量变化,每个审计机关从1到36份报告不等。 1996-1999年期间,结果是不那么容易诠释。第一,活跃在环境审计领域的最高审计机关数量并没有太大变化。“活性基团”的组成没有保持相同的:一些最高审计机关进入,而其他最高审计机关离开了团队。环境审计花费的时间量略有增加。二,但是,审计报告数量略有下降,1996年和1999年之间。这些数字可能反映了从量到质的转变。这个信号解释了在过去三年从规律性审计到绩效审计的转变(1994-1996年,20%的规律性审计和44%绩效审计;1997-1999:16%规律性审计和绩效审计54%)。在一般情况下,绩效审计需要更多的资源。我们必须认识到审计的范围可能急剧变化。在将来,再将来开发一些其他方式去测算人们工作量而不是计算通过花费的时间和发表的报告会是很有趣的。 在2000年,有62个响应了最高审计机关并向工作组提供了更详细的关于他们自1997年以来公布的工作信息。在1997-1999年,这62个最高审计机关公布的560个环境审计报告。当然,这些报告反映了一个庞大的身躯,可用于其他机构的经验。环境审计报告的参考书目可在网站上的最高审计机关国际组织的工作组看到。这里这个信息是用来给最高审计机关的审计工作的内容更多一些洞察。 自1997年以来,少数环境审计是规律性审计(560篇报告中有87篇,占16%)。大多数审计绩效审计(560篇报告中有304篇,占54%),或组合的规律性和绩效审计(560篇报告中有169篇,占30%)。如前文所述,绩效审计是一个广泛的概念。在实践中,绩效审计往往集中于环保计划的实施(560篇报告中有264篇,占47%),符合国家环保法律,法规的,由政府部门,部委和/或其他机构的任务给访问(560篇报告中有212篇,占38%)。此外,审计经常被列入政府的环境管理系统(560篇报告中有156篇,占28%)。下面的元素得到了关注审计报告:影响或影响现有的国家环境计划非环保项目对环境的影响;环境政策;由政府遵守国际义务和承诺的10%至20%。许多绩效审计包括以上提到的要素之一。 1本文译自:S. Van Leeuwen.(2004).’’Developments in Environmental Auditing by Supreme Audit Institutions’’ Environmental Management Vol. 33, No. 2, pp. 163–1721
营销-外文翻译
外文翻译 原文 Marketing Material Source:Marketing Management Author:Philip Kotler Marketing Channels To reach a target market, the marketer uses three kinds of marketing channels. Communication channels deliver messages to and receive messages from target buyers. They include newspapers, magazines, radio, television, mail, telephone, billboards, posters, fliers, CDs, audiotapes, and the Internet. Beyond these, communications are conveyed by facial expressions and clothing, the look of retail stores, and many other media. Marketers are increasingly adding dialogue channels (e-mail and toll-free numbers) to counterbalance the more normal monologue channels (such as ads). The marketer uses distribution channels to display or deliver the physical product or service to the buyer or user. There are physical distribution channels and service distribution channels, which include warehouses, transportation vehicles, and various trade channels such as distributors, wholesalers, and retailers. The marketer also uses selling channels to effect transactions with potential buyers. Selling channels include not only the distributors and retailers but also the banks and insurance companies that facilitate transactions. Marketers clearly face a design problem in choosing the best mix of communication, distribution, and selling channels for their offerings. Supply Chain Whereas marketing channels connect the marketer to the target buyers, the supply chain describes a longer channel stretching from raw materials to components to final products that are carried to final buyers. For example, the supply chain for women’s purses starts with hides, tanning operations, cutting operations, manufacturing, and the marketing channels that bring products to customers. This supply chain represents a value delivery system. Each company captures only a certain percentage of the total value generated by the supply chain. When a company acquires competitors or moves upstream or downstream, its aim is
智能交通灯控制系统_英文翻译
英文 Because of the rapid development of our economy resulting in the car number of large and medium-sized cities surged and the urban traffic, is facing serious test, leading to the traffic problem increasingly serious, its basically are behaved as follows: traffic accident frequency, to the human life safety enormous threat, Traffic congestion, resulting in serious travel time increases, energy consumption increase; Air pollution and noise pollution degree of deepening, etc. Daily traffic jams become people commonplace and had to endure. In this context, in combination with the actual situation of urban road traffic, develop truly suitable for our own characteristics of intelligent signal control system has become the main task. Preface In practical application at home and abroad, according to the actual traffic signal control application inspection, planar independent intersection signal control basic using set cycle, much time set cycle, half induction, whole sensor etc in several ways. The former two control mode is completely based on planar intersection always traffic flow data of statistical investigation, due to traffic flow the existence of variable sex and randomicity, the two methods have traffic efficiency is low, the scheme, the defects of aging and half inductive and all the inductive the two methods are in the former two ways based on increased vehicle detector and according to the information provided to adjust cycle is long and green letter of vehicle, it than random arrived adaptability bigger, can make vehicles in the parking cord before as few parking, achieve traffic flowing effect In modern industrial production,current,voltage,temperature, pressure, and flow rate, velocity, and switch quantity are common mainly controlled parameter. For example: in metallurgical industry, chemical production, power engineering, the papermaking industry, machinery and food processing and so on many domains, people need to transport the orderly control. By single chip microcomputer to control of traffic, not only has the convenient control, configuration simple and flexible wait for an advantage, but also can greatly improve the technical index by control quantity, thus greatly improve product quality and quantity. Therefore, the monolithic integrated circuit to the traffic light control problem is an industrial production we often encounter problems. In the course of industrial production, there are many industries have lots of traffic equipment, in the current system, most of the traffic control signal is accomplished by relays, but relays response time is long, sensitivity low, long-term after use, fault opportunity increases greatly, and adopts single-chip microcomputer control, the accuracy of far greater than relays, short response time, software reliability, not because working time reduced its performance sake, compared with, this solution has the high feasibility. About AT89C51 (1)function characteristics description: AT89C51 is a low power consumption, high performance CMOS8 bit micro-controller, has the 8K in system programmable Flash memory. Use high-density Atmel company the beltpassword nonvolatile storage technology and manufacturing, and industrial 80S51 product instructions and pin fully compatible. Chip Flash allow program memory in system programmable, also suitable for conventional programmer. In a single chip, have dexterous 8 bits CPU and in system programmable Flash, make AT89C51 for many embedded control application system provides the high flexible, super efficient solution. AT89C51 has the following standard function: 8k bytes Flash, 256 bytes RAM, 32-bit I/O mouth line, the watchdog timer, two data pointer, three 16 timer/counter, a 6 vector level 2 interrupt structure, full-duplex serial port, piece inside crystals timely clock circuit. In addition, AT89C51 can drop to 0Hz static logic operation, support two software can choose power saving mode. Idle mode, the CPU to stop working, allowing the RAM, timer/counter, serial ports, interruption continue to work. Power lost protection mode, RAM content being saved, has been frozen, microcontroller all work stop, until the next interruption or hardware reset so far. As shown in