外文翻译1
The Design of LDF Data Acquisition System Based on LabVIEW
Abstract
In the formation of liquid drops, different kinds of liquids may have different outer profiles; the change of volume and shape in the process of drop formation can indirectly reflect liqui d’s physical and chemical properties, such as surface tension and viscosity, etc. Real-time detection the size of drops in the forming process is on the basis of drop analysis technique. Previous researchers have studied that optic fiber and capacitance drop sensor fusion technology can indirectly gain drop’s form and the volume. This article is based on the optic fiber and capacitance drop sensor theory, designing the system based on the LabVIEW software to realize the LDF (Liquid Drop Fingerprint) data acquisition function. The experiment results show that the system can well realize the acquisition, compared with the traditional VC programming technology, this data acquisition system is high efficiency.
Keywords: LDF, Data Acquisition System, LabVIEW, Optic fiber-capacitance Liquid Sensor
1. Introduction
DAT (Drop Analysis Technology) means that under certain test system conditions, during the process of drops formation, it is needed to use various means to obtain the physical and chemical characteristic parameters of the measured liquid, to realize the liquid identification via qualitative and quantitative analysis(Song
Qing,2005).
From the above, it can be known that in the process of drop forming, it is very crucial to analyze its size and the outline which reflect the chemical and physical properties of the liquid. So how to test its size and outline is the focus of our research. Predecessors had made some theory research in this field, Dr Z.R.Qiu in Tianjin University mentioned the optic fiber and capacitance sensor fusion technology in his doctoral dissertation(Qiu Zurong,2000), demonstrating that through testing the drop capacitance sensor changing and light intensity we can indirectly measure the drop
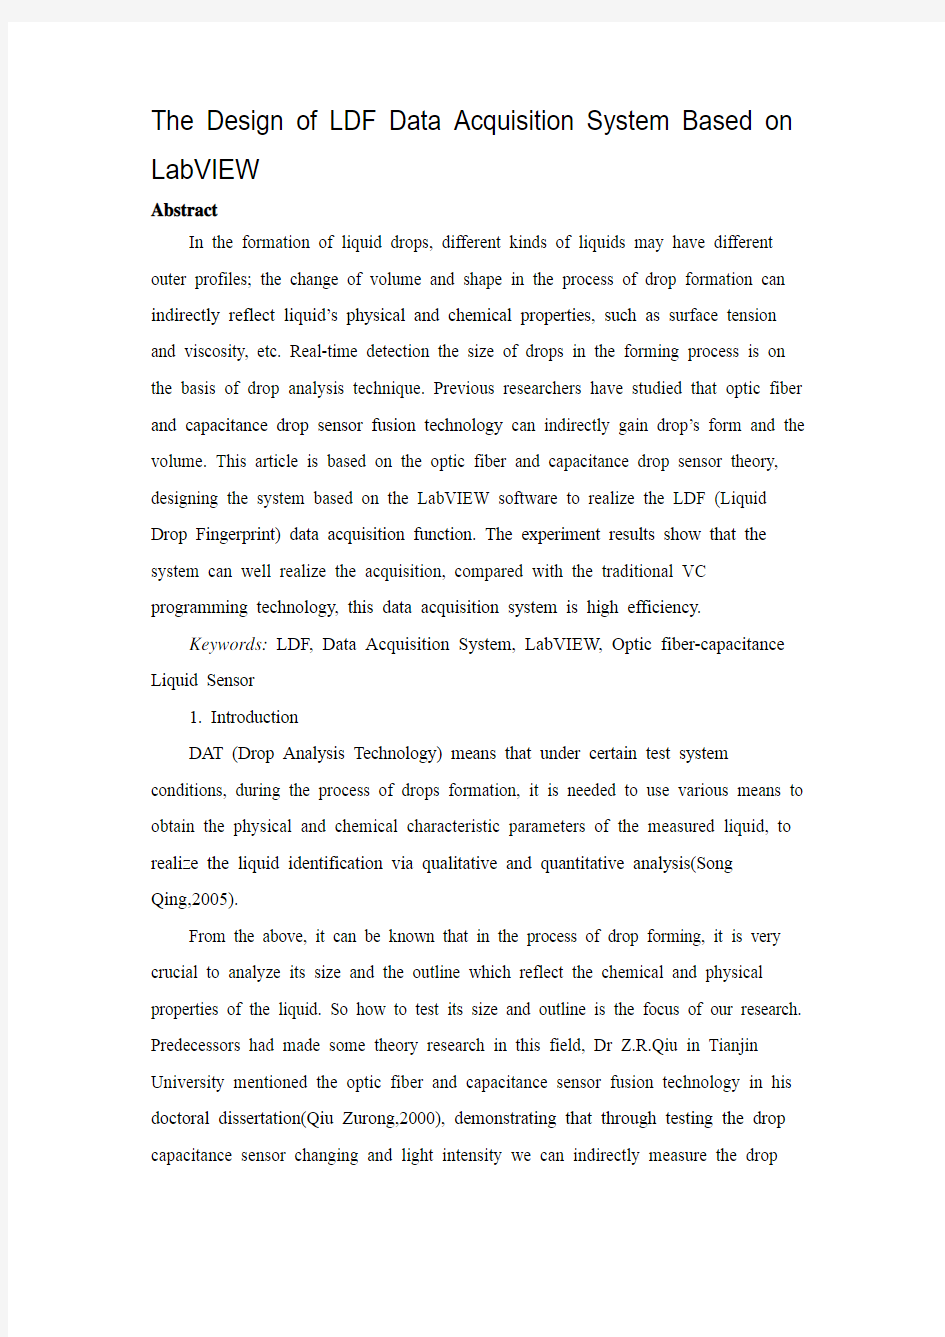
size and outline. This article is built on the optical fiber-capacitance sensor fusion technology and its principle diagram is as shown in Figure 1.
Selection and/or peer-review under responsibility of Conference ESIAT2011 Organization Committee.
As shown in Figure 1, one signal is light, the light from the light source by input optical fiber importing into drop. The light is reflected and absorbed in the internal of drop, then derived by output optic fiber. It is changed into analog signals after being transferred through photoelectric model. This signal is sent to one channel of data acquisition card, according to the setting parameters acquisition card completing
acquisition and processing tasks. At last, the results are uploaded to the computer. The other signal is electrical signals, which is f orming between the head drop’s bottom with cone annular plate and circular plate. This change of capacitance indirectly reflects the drop’s size change. After frequency voltage transforming circuit, capacitance signal is converted into voltage signal, by subsequent DAQ processing circuit with algorithm processor, then results uploaded to the computer, realizing the computing, display and storing functions.
So, how to get optic fiber and capacitance sensor output voltage signal and
real-time displaying and storing are the experimental keys. The traditional data acquisition systems are designed according to data
acquisition characteristics, combining hardware circuit with VC programming to realize (Sun Xin,etal,2009). However, hardware circuit design with high speed data acquisition is complex, with so many disturbances, big noise, cumbersome software, much costing(Zhao Yibin,etal,2005). While LabVIEW is a language based on the graphic programming technology (Lin Jing,etal,2005), in data acquisition, it has prominent superiority, briefness and modifying conveniently, and changing
parameters by software easily. This paper is an application of LabVIEW in drops analysis of high-speed data acquisition.
2. Design of Hardware
During the forming of drops, optic fiber signal and capacitance signal changes in a small range, considering the magnification matching, channel numbers, AD transforming precision, etc. In the trial, we used type
PCI-9113A(https://www.360docs.net/doc/7012822031.html,) data acquisition board which is developed by ADlink Company, as shown in Figure 2. PCI-9113A has 32 bit PCI bus; plug and play; 32 one-port input channels or 16 differential input channels; on board with
low-pass filter used in signal disposal or attenuation; 2500Vrms segregation voltage; with 12 bit successive approximation type A/D converter; three optional programmable gain1, 10 and 100; sampling frequency can achieve 100KHz (single channel model); dual polarity input range:±5V, ±0.5 V, ±0.05 V, single polarity input range: 0 ~10V, 0 ~ 1V, 0 ~ 0.1 V; two trigger mode, software trigger and timer trigger; with the FIFO storage of 1,024 data on board; automatic scanning function with channel choosing; standard half long card structure, standard DB-37 hole type connector.
This data acquisition board’s perfor mance is basically accord with the requirement, price ratio is high.It can complete the experiment task well.
Combining the design with our research background, the change of the capacitance is about 0.5uF between drop in completely full state and completely fallen state, and parasitic capacitance itself 1uF.(Song Qing,2005). So the value of capacitance change comparing with stray capacitance value is very small. This makes the capacitance signal processing circuits more demanding. In order to derivate DB37 interface for convenient measuring, and also for actual situation and task, making the acquisition card to better achieve our function and goal, we design the data acquisition interface board, as shown in Figure2-(b). And according to the actual application, we select the mode of 2 channels one-port input model.And for the sake of the subsequent convenient debugging, in the design of circuit board, we put some test
points for key signals. The main structure parts of the interface board are DB37 interface, the power modules, filtering and amplification analog parts. Hardware part has been designed well and then we can
start software implementation.
a) PCI-9113A b) the Interface board
Figure 2 Data acquisition card and interface board
3. Data Acquisition based on LabVIEW
According to the actual need, the software is designed as shown in Figure 3. The whole process of data acquisition and processing is: first calling data acquisition program that showing data acquisition procedures will start next; Then, determining the corresponding parameters of optic fiber, capacitance signal acquisition program, such as the sampling rate, the channel, input methods one-port input or differential input, sampling points, etc. The setting of these several specific parameters should correspond to the hardware structure and the board which is been wired subsequently, etc. Backup acquisition program diagram is shown in Figure 4
Figure 3 Front panel diagram
Figure 4 Backstage diagram and program flow chart
In the process of data acquisition, according to the different type of interface card, buffer size, while buffer is full of data, it can real-time display through the waveform chart. In order to freely control optic fiber signal and capacitance signal displaying, we designed three button related with display, which is convenient for observation and analysis in the experimental process. After acquisition has been completed,we can choose freely whether to store it or empty it according to experimental effect. Preserving data button can store the optic fiber, capacitance data documents in electronic format file to the appointed place according to the pattern setting. Front panel diagram is showed in Figure 3.
4. Experimental Results
The data acquisition system about liquid drop is built according to principle diagram in Figure1. The LDF of the ethanol with concentration of 100% is as shown in Figure 5 based on LabVIEW acquisition system.
By measuring results, the system can well realize data acquisition function. It is capacitance signal of ethanol for 100% in Figure 5-(a). Capacitance signal is linear growth, which is consistent with theory analysis (Song Qing,2005). In turndown of drop, capacitance signal mutate which is tally with the actual situation. And in the measurement of liquid drops, the cyclical change matches the number of the drops, showing that our system can be well tracking signal changes and realizing data acquisition function.Figure 5-(b) is the ethanol optic fiber signal figure. Optical signal curve is smooth, presenting the good cyclical change trend, and is equivalent to capacitor signal cycle. Theoretical analysis and experimental results confirm each other, showing the correctness in theory and designing experiment. Figure 5-(c) is
optical optic fiber capacitance signal with two channels acquisition and both displaying. And comparing with separately collecting, the cycle is consistent, and signal with good repeatability.
Based on the graphic programming language, data acquisition function implementation is simple (Zhou ShaoLei,etal,2004). It is easy to operate and modify, making the researcher can concentrate more energy on system designing, reducing time on writing foundation of code. Especially in data acquisition, it shows big advantages, which is worth advocating and recommending.
a) Displaying capacitance signals b) Displaying optical signals
c) Displaying both optic fiber and capacitance signals
Figure 5 Data acquisition results
5. Conclusions
This experiment using data acquisition card based on LabVIEW software realized the optic fiber capacitance signal high-speed data acquisition function. Known from the experimental results, the scheme can be efficiently, quickly, low costly to realize high speed data acquisition function. And experimental results are congruent with the theoretical analysis, meeting the demand of precision, realizing the research goal. The scheme is worth advocating and promotion.
Reference
[1] Song Qing, Research of Liquid Identification Method based on the Liquid Drops Technology and LDF, [D], Tianjin:Tianjin University, 2005
[2] Qiu Zurong, Research of Drop Analysis Technology, [D], Tianjin: Tianjin University,2000
[3] Sun Xin, Yu Anping, the Vc++ In-depth Explanation, [M], Electronics Industry Press:2009,20-25
[4] Zhao Yibin, Zhou Yilin, the Data Acquisition System based on LabVIEW, [J], Journal of Qingdao University of Science and Technology, 2005, 10, 26 (5), 452-454
[5] Lin Jing, Lin Zhenyu, Zheng Furen etc, LabVIEW Virtual Instrument Designed from the Approaching to Master, [M],The People's Posts and Telecommunications Press: 2010 (7), 65-80
[6] https://www.360docs.net/doc/7012822031.html,/PD/cn/PD_detail.php?cKind=&pid=30&seq=&id=&sid
[7] Wei wei, Hu Wei, Wang Yongqing etc, Embedded Hardware System Interface Circuit Design, [M], Chemical Industry Press: 2010,280-300
[8] Zhou ShaoLei, Yang Xiuxia etc, Virtual Instrument Technology Analysis and Application, [M], Mechanical Industry Press:2004 (2), 50-76
The Design of LDF Data Acquisition System Based on LabVIEW
Abstract
In the formation of liquid drops, different kinds of liquids may have different outer profiles; the change of volume and shape in the process of drop formation can indirectly reflect liquid’s physical and chemical properties, such as surface tension and viscosity, etc. Real-time detection the size of drops in the forming process is on the basis of drop analysis technique. Previous researchers have studied that optic fiber and capacitance drop sensor fusion technology can indirectly gain drop’s form and the volume. This article is based on the optic fiber and capacitance drop sensor theory, designing the system based on the LabVIEW software to realize the LDF (Liquid Drop Fingerprint) data acquisition function. The experiment results show that the system can well realize the acquisition, compared with the traditional VC programming technology, this data acquisition system is high efficiency.
译文:
基于光纤电容液滴传感器的设计数据采集系统虚拟仪器
在液滴的形成,不同种类的液体可能有不同的外轮廓;在下降过程中形成的体积和形状的变化可以间接反映液体的物理化学性质,如表面张力、粘度等,实时检测在成形过程中液滴的大小,在液滴分析技术的基础上。以往的研究者们研究了光纤、电容液滴传感器融合技术可以间接的增益下降的形式和体积。本文是基于光纤、电容液滴传感器理论,基于LabVIEW软件实现过程的系统设计(液滴指纹)的数据采集功能。实验结果表明,该系统能很好地实现采集,与传统的编程技术相比,该数据采集系统效率高。
外文翻译
Load and Ultimate Moment of Prestressed Concrete Action Under Overload-Cracking Load It has been shown that a variation in the external load acting on a prestressed beam results in a change in the location of the pressure line for beams in the elastic range.This is a fundamental principle of prestressed construction.In a normal prestressed beam,this shift in the location of the pressure line continues at a relatively uniform rate,as the external load is increased,to the point where cracks develop in the tension fiber.After the cracking load has been exceeded,the rate of movement in the pressure line decreases as additional load is applied,and a significant increase in the stress in the prestressing tendon and the resultant concrete force begins to take place.This change in the action of the internal moment continues until all movement of the pressure line ceases.The moment caused by loads that are applied thereafter is offset entirely by a corresponding and proportional change in the internal forces,just as in reinforced-concrete construction.This fact,that the load in the elastic range and the plastic range is carried by actions that are fundamentally different,is very significant and renders strength computations essential for all designs in order to ensure that adequate safety factors exist.This is true even though the stresses in the elastic range may conform to a recognized elastic design criterion. It should be noted that the load deflection curve is close to a straight line up to the cracking load and that the curve becomes progressively more curved as the load is increased above the cracking load.The curvature of the load-deflection curve for loads over the cracking load is due to the change in the basic internal resisting moment action that counteracts the applied loads,as described above,as well as to plastic strains that begin to take place in the steel and the concrete when stressed to high levels. In some structures it may be essential that the flexural members remain crack free even under significant overloads.This may be due to the structures’being exposed to exceptionally corrosive atmospheres during their useful life.In designing prestressed members to be used in special structures of this type,it may be necessary to compute the load that causes cracking of the tensile flange,in order to ensure that adequate safety against cracking is provided by the design.The computation of the moment that will cause cracking is also necessary to ensure compliance with some design criteria. Many tests have demonstrated that the load-deflection curves of prestressed beams are approximately linear up to and slightly in excess of the load that causes the first cracks in the tensile flange.(The linearity is a function of the rate at which the load is applied.)For this reason,normal elastic-design relationships can be used in computing the cracking load by simply determining the load that results in a net tensile stress in the tensile flange(prestress minus the effects of the applied loads)that is equal to the tensile strength of the concrete.It is customary to assume that the flexural tensile strength of the concrete is equal to the modulus of rupture of the
毕设外文资料翻译.
理工学院 毕业设计外文资料翻译 专业:计算机科学与技术 姓名:马艳丽 学号: 12L0752218 外文出处:The Design and Implementation of 3D Electronic Map of Campus Based on WEBGIS 附件: 1.外文资料翻译译文;2.外文原文。
附件1:外文资料翻译译文 基于WebGIS的校园三维电子地图的设计与实现 一.导言 如今,数字化和信息化是当今时代的主题。随着信息革命和计算机科学的发展,计算机技术已经渗透到科学的各个领域,并引起了许多革命性的变化,在这些科目,古代制图学也不例外。随着技术和文化的不断进步,地图变化的形式和内容也随之更新。在计算机图形学中,地理信息系统(GIS)不断应用到Web,制作和演示的传统方式经历了巨大的变化,由于先进的信息技术的发展,地图的应用已经大大延长。在这些情况下,绘图将面临广阔的发展前景。电子地图是随之应运而生的产品之一。随着计算机技术,计算机图形学理论,遥感技术,航空摄影测量技术和其他相关技术的飞速发展。用户需要的三维可视化,动态的交互性和展示自己的各种地理相关的数据处理和分析,如此多的关注应支付的研究三维地图。东北石油大学及其周边地区的基础上本文设计并建立三维电子地图。 二.系统设计 基于WebGIS的校园三维电子地图系统的具有普通地图的一般特性。通过按键盘上的箭头键(上,下,左,右),可以使地图向相应的方向移动。通过拖动鼠标,可以查看感兴趣的任何一个地方。使用鼠标滚轮,可以控制地图的大小,根据用户的需求来查看不同缩放级别的地图。在地图的左下角会显示当前鼠标的坐标。在一个div层,我们描绘了一个新建筑物的热点,这层可以根据不同的地图图层的显示,它也可以自动调整。通过点击热点,它可以显示热点的具体信息。也可以输入到查询的信息,根据自己的需要,并得到一些相关的信息。此外,通过点击鼠标,人们可以选择检查的三维地图和卫星地图。 主要功能包括: ?用户信息管理:检查用户名和密码,根据权限设置级别的认证,允许不同权限的用户通过互联网登录系统。 ?位置信息查询:系统可以为用户提供模糊查询和快速定位。
网络营销外文翻译
E---MARKETING (From:E--Marketing by Judy Strauss,Adel El--Ansary,Raymond Frost---3rd ed.1999 by Pearson Education pp .G4-G25.) As the growth of https://www.360docs.net/doc/7012822031.html, shows, some marketing principles never change.Markets always welcome an innovative new product, even in a crowded field of competitors ,as long as it provides customer value.Also,Google`s success shows that customers trust good brands and that well-crafted marketing mix strategies can be effective in helping newcomers enter crowded markets. Nevertheless, organizations are scrambling to determine how they can use information technology profitably and to understand what technology means for their business strategies. Marketers want to know which of their time-ested concepts will be enhanced by the Internet, databases,wireless mobile devices, and other technologies. The rapid growth of the Internet and subsequent bursting of the dot-com bubble has marketers wondering,"What next?" This article attempts to answer these questions through careful and systematic examination of successful e-mar-keting strategies in light of proven traditional marketing practices. (Sales Promotion;E--Marketing;Internet;Strategic Planning ) 1.What is E--Marketing E--Marketing is the application of a broad range of information technologies for: Transforming marketing strategies to create more customer value through more effective segmentation ,and positioning strategies;More efficiently planning and executing the conception, distribution promotion,and pricing of goods,services,and ideas;andCreating exchanges that satisfy individual consumer and organizational customers` objectives. This definition sounds a lot like the definition of traditional marketing. Another way to view it is that e-marketing is the result of information technology applied to traditional marketing. E-marketing affects traditional marketing in two ways. First,it increases efficiency in traditional marketing strategies.The transformation results in new business models that add customer value and/or increase company profitability.
毕业设计外文翻译资料
外文出处: 《Exploiting Software How to Break Code》By Greg Hoglund, Gary McGraw Publisher : Addison Wesley Pub Date : February 17, 2004 ISBN : 0-201-78695-8 译文标题: JDBC接口技术 译文: JDBC是一种可用于执行SQL语句的JavaAPI(ApplicationProgrammingInterface应用程序设计接口)。它由一些Java语言编写的类和界面组成。JDBC为数据库应用开发人员、数据库前台工具开发人员提供了一种标准的应用程序设计接口,使开发人员可以用纯Java语言编写完整的数据库应用程序。 一、ODBC到JDBC的发展历程 说到JDBC,很容易让人联想到另一个十分熟悉的字眼“ODBC”。它们之间有没有联系呢?如果有,那么它们之间又是怎样的关系呢? ODBC是OpenDatabaseConnectivity的英文简写。它是一种用来在相关或不相关的数据库管理系统(DBMS)中存取数据的,用C语言实现的,标准应用程序数据接口。通过ODBCAPI,应用程序可以存取保存在多种不同数据库管理系统(DBMS)中的数据,而不论每个DBMS使用了何种数据存储格式和编程接口。 1.ODBC的结构模型 ODBC的结构包括四个主要部分:应用程序接口、驱动器管理器、数据库驱动器和数据源。应用程序接口:屏蔽不同的ODBC数据库驱动器之间函数调用的差别,为用户提供统一的SQL编程接口。 驱动器管理器:为应用程序装载数据库驱动器。 数据库驱动器:实现ODBC的函数调用,提供对特定数据源的SQL请求。如果需要,数据库驱动器将修改应用程序的请求,使得请求符合相关的DBMS所支持的文法。 数据源:由用户想要存取的数据以及与它相关的操作系统、DBMS和用于访问DBMS的网络平台组成。 虽然ODBC驱动器管理器的主要目的是加载数据库驱动器,以便ODBC函数调用,但是数据库驱动器本身也执行ODBC函数调用,并与数据库相互配合。因此当应用系统发出调用与数据源进行连接时,数据库驱动器能管理通信协议。当建立起与数据源的连接时,数据库驱动器便能处理应用系统向DBMS发出的请求,对分析或发自数据源的设计进行必要的翻译,并将结果返回给应用系统。 2.JDBC的诞生 自从Java语言于1995年5月正式公布以来,Java风靡全球。出现大量的用java语言编写的程序,其中也包括数据库应用程序。由于没有一个Java语言的API,编程人员不得不在Java程序中加入C语言的ODBC函数调用。这就使很多Java的优秀特性无法充分发挥,比如平台无关性、面向对象特性等。随着越来越多的编程人员对Java语言的日益喜爱,越来越多的公司在Java程序开发上投入的精力日益增加,对java语言接口的访问数据库的API 的要求越来越强烈。也由于ODBC的有其不足之处,比如它并不容易使用,没有面向对象的特性等等,SUN公司决定开发一Java语言为接口的数据库应用程序开发接口。在JDK1.x 版本中,JDBC只是一个可选部件,到了JDK1.1公布时,SQL类包(也就是JDBCAPI)
1外文文献翻译原文及译文汇总
华北电力大学科技学院 毕业设计(论文)附件 外文文献翻译 学号:121912020115姓名:彭钰钊 所在系别:动力工程系专业班级:测控技术与仪器12K1指导教师:李冰 原文标题:Infrared Remote Control System Abstract 2016 年 4 月 19 日
红外遥控系统 摘要 红外数据通信技术是目前在世界范围内被广泛使用的一种无线连接技术,被众多的硬件和软件平台所支持。红外收发器产品具有成本低,小型化,传输速率快,点对点安全传输,不受电磁干扰等特点,可以实现信息在不同产品之间快速、方便、安全地交换与传送,在短距离无线传输方面拥有十分明显的优势。红外遥控收发系统的设计在具有很高的实用价值,目前红外收发器产品在可携式产品中的应用潜力很大。全世界约有1亿5千万台设备采用红外技术,在电子产品和工业设备、医疗设备等领域广泛使用。绝大多数笔记本电脑和手机都配置红外收发器接口。随着红外数据传输技术更加成熟、成本下降,红外收发器在短距离通讯领域必将得到更广泛的应用。 本系统的设计目的是用红外线作为传输媒质来传输用户的操作信息并由接收电路解调出原始信号,主要用到编码芯片和解码芯片对信号进行调制与解调,其中编码芯片用的是台湾生产的PT2262,解码芯片是PT2272。主要工作原理是:利用编码键盘可以为PT2262提供的输入信息,PT2262对输入的信息进行编码并加载到38KHZ的载波上并调制红外发射二极管并辐射到空间,然后再由接收系统接收到发射的信号并解调出原始信息,由PT2272对原信号进行解码以驱动相应的电路完成用户的操作要求。 关键字:红外线;编码;解码;LM386;红外收发器。 1 绪论
外文翻译
Journal of Industrial Textiles https://www.360docs.net/doc/7012822031.html,/ Optimization of Parameters for the Production of Needlepunched Nonwoven Geotextiles Amit Rawal, Subhash Anand and Tahir Shah 2008 37: 341Journal of Industrial Textiles DOI: 10.1177/1528083707081594 The online version of this article can be found at: https://www.360docs.net/doc/7012822031.html,/content/37/4/341 Published by: https://www.360docs.net/doc/7012822031.html, can be found at:Journal of Industrial TextilesAdditional services and information for https://www.360docs.net/doc/7012822031.html,/cgi/alertsEmail Alerts: https://www.360docs.net/doc/7012822031.html,/subscriptionsSubscriptions: https://www.360docs.net/doc/7012822031.html,/journalsReprints.navReprints: https://www.360docs.net/doc/7012822031.html,/journalsPermissions.navPermissions: https://www.360docs.net/doc/7012822031.html,/content/37/4/341.refs.htmlCitations: - Mar 28, 2008Version of Record >>
毕业设计外文翻译附原文
外文翻译 专业机械设计制造及其自动化学生姓名刘链柱 班级机制111 学号1110101102 指导教师葛友华
外文资料名称: Design and performance evaluation of vacuum cleaners using cyclone technology 外文资料出处:Korean J. Chem. Eng., 23(6), (用外文写) 925-930 (2006) 附件: 1.外文资料翻译译文 2.外文原文
应用旋风技术真空吸尘器的设计和性能介绍 吉尔泰金,洪城铱昌,宰瑾李, 刘链柱译 摘要:旋风型分离器技术用于真空吸尘器 - 轴向进流旋风和切向进气道流旋风有效地收集粉尘和降低压力降已被实验研究。优化设计等因素作为集尘效率,压降,并切成尺寸被粒度对应于分级收集的50%的效率进行了研究。颗粒切成大小降低入口面积,体直径,减小涡取景器直径的旋风。切向入口的双流量气旋具有良好的性能考虑的350毫米汞柱的低压降和为1.5μm的质量中位直径在1米3的流量的截止尺寸。一使用切向入口的双流量旋风吸尘器示出了势是一种有效的方法,用于收集在家庭中产生的粉尘。 摘要及关键词:吸尘器; 粉尘; 旋风分离器 引言 我们这个时代的很大一部分都花在了房子,工作场所,或其他建筑,因此,室内空间应该是既舒适情绪和卫生。但室内空气中含有超过室外空气因气密性的二次污染物,毒物,食品气味。这是通过使用产生在建筑中的新材料和设备。真空吸尘器为代表的家电去除有害物质从地板到地毯所用的商用真空吸尘器房子由纸过滤,预过滤器和排气过滤器通过洁净的空气排放到大气中。虽然真空吸尘器是方便在使用中,吸入压力下降说唱空转成比例地清洗的时间,以及纸过滤器也应定期更换,由于压力下降,气味和细菌通过纸过滤器内的残留粉尘。 图1示出了大气气溶胶的粒度分布通常是双峰形,在粗颗粒(>2.0微米)模式为主要的外部来源,如风吹尘,海盐喷雾,火山,从工厂直接排放和车辆废气排放,以及那些在细颗粒模式包括燃烧或光化学反应。表1显示模式,典型的大气航空的直径和质量浓度溶胶被许多研究者测量。精细模式在0.18?0.36 在5.7到25微米尺寸范围微米尺寸范围。质量浓度为2?205微克,可直接在大气气溶胶和 3.85至36.3μg/m3柴油气溶胶。
外文翻译中文版(完整版)
毕业论文外文文献翻译 毕业设计(论文)题目关于企业内部环境绩效审计的研究翻译题目最高审计机关的环境审计活动 学院会计学院 专业会计学 姓名张军芳 班级09020615 学号09027927 指导教师何瑞雄
最高审计机关的环境审计活动 1最高审计机关越来越多的活跃在环境审计领域。特别是1993-1996年期间,工作组已检测到环境审计活动坚定的数量增长。首先,越来越多的最高审计机关已经活跃在这个领域。其次是积极的最高审计机关,甚至变得更加活跃:他们分配较大部分的审计资源给这类工作,同时出版更多环保审计报告。表1显示了平均数字。然而,这里是机构间差异较大。例如,环境报告的数量变化,每个审计机关从1到36份报告不等。 1996-1999年期间,结果是不那么容易诠释。第一,活跃在环境审计领域的最高审计机关数量并没有太大变化。“活性基团”的组成没有保持相同的:一些最高审计机关进入,而其他最高审计机关离开了团队。环境审计花费的时间量略有增加。二,但是,审计报告数量略有下降,1996年和1999年之间。这些数字可能反映了从量到质的转变。这个信号解释了在过去三年从规律性审计到绩效审计的转变(1994-1996年,20%的规律性审计和44%绩效审计;1997-1999:16%规律性审计和绩效审计54%)。在一般情况下,绩效审计需要更多的资源。我们必须认识到审计的范围可能急剧变化。在将来,再将来开发一些其他方式去测算人们工作量而不是计算通过花费的时间和发表的报告会是很有趣的。 在2000年,有62个响应了最高审计机关并向工作组提供了更详细的关于他们自1997年以来公布的工作信息。在1997-1999年,这62个最高审计机关公布的560个环境审计报告。当然,这些报告反映了一个庞大的身躯,可用于其他机构的经验。环境审计报告的参考书目可在网站上的最高审计机关国际组织的工作组看到。这里这个信息是用来给最高审计机关的审计工作的内容更多一些洞察。 自1997年以来,少数环境审计是规律性审计(560篇报告中有87篇,占16%)。大多数审计绩效审计(560篇报告中有304篇,占54%),或组合的规律性和绩效审计(560篇报告中有169篇,占30%)。如前文所述,绩效审计是一个广泛的概念。在实践中,绩效审计往往集中于环保计划的实施(560篇报告中有264篇,占47%),符合国家环保法律,法规的,由政府部门,部委和/或其他机构的任务给访问(560篇报告中有212篇,占38%)。此外,审计经常被列入政府的环境管理系统(560篇报告中有156篇,占28%)。下面的元素得到了关注审计报告:影响或影响现有的国家环境计划非环保项目对环境的影响;环境政策;由政府遵守国际义务和承诺的10%至20%。许多绩效审计包括以上提到的要素之一。 1本文译自:S. Van Leeuwen.(2004).’’Developments in Environmental Auditing by Supreme Audit Institutions’’ Environmental Management Vol. 33, No. 2, pp. 163–1721
毕业设计外文翻译
毕业设计(论文) 外文翻译 题目西安市水源工程中的 水电站设计 专业水利水电工程 班级 学生 指导教师 2016年
研究钢弧形闸门的动态稳定性 牛志国 河海大学水利水电工程学院,中国南京,邮编210098 nzg_197901@https://www.360docs.net/doc/7012822031.html,,niuzhiguo@https://www.360docs.net/doc/7012822031.html, 李同春 河海大学水利水电工程学院,中国南京,邮编210098 ltchhu@https://www.360docs.net/doc/7012822031.html, 摘要 由于钢弧形闸门的结构特征和弹力,调查对参数共振的弧形闸门的臂一直是研究领域的热点话题弧形弧形闸门的动力稳定性。在这个论文中,简化空间框架作为分析模型,根据弹性体薄壁结构的扰动方程和梁单元模型和薄壁结构的梁单元模型,动态不稳定区域的弧形闸门可以通过有限元的方法,应用有限元的方法计算动态不稳定性的主要区域的弧形弧形闸门工作。此外,结合物理和数值模型,对识别新方法的参数共振钢弧形闸门提出了调查,本文不仅是重要的改进弧形闸门的参数振动的计算方法,但也为进一步研究弧形弧形闸门结构的动态稳定性打下了坚实的基础。 简介 低举升力,没有门槽,好流型,和操作方便等优点,使钢弧形闸门已经广泛应用于水工建筑物。弧形闸门的结构特点是液压完全作用于弧形闸门,通过门叶和主大梁,所以弧形闸门臂是主要的组件确保弧形闸门安全操作。如果周期性轴向载荷作用于手臂,手臂的不稳定是在一定条件下可能发生。调查指出:在弧形闸门的20次事故中,除了极特殊的破坏情况下,弧形闸门的破坏的原因是弧形闸门臂的不稳定;此外,明显的动态作用下发生破坏。例如:张山闸,位于中国的江苏省,包括36个弧形闸门。当一个弧形闸门打开放水时,门被破坏了,而其他弧形闸门则关闭,受到静态静水压力仍然是一样的,很明显,一个动态的加载是造成的弧形闸门破坏一个主要因素。因此弧形闸门臂的动态不稳定是造成弧形闸门(特别是低水头的弧形闸门)破坏的主要原是毫无疑问。
营销-外文翻译
外文翻译 原文 Marketing Material Source:Marketing Management Author:Philip Kotler Marketing Channels To reach a target market, the marketer uses three kinds of marketing channels. Communication channels deliver messages to and receive messages from target buyers. They include newspapers, magazines, radio, television, mail, telephone, billboards, posters, fliers, CDs, audiotapes, and the Internet. Beyond these, communications are conveyed by facial expressions and clothing, the look of retail stores, and many other media. Marketers are increasingly adding dialogue channels (e-mail and toll-free numbers) to counterbalance the more normal monologue channels (such as ads). The marketer uses distribution channels to display or deliver the physical product or service to the buyer or user. There are physical distribution channels and service distribution channels, which include warehouses, transportation vehicles, and various trade channels such as distributors, wholesalers, and retailers. The marketer also uses selling channels to effect transactions with potential buyers. Selling channels include not only the distributors and retailers but also the banks and insurance companies that facilitate transactions. Marketers clearly face a design problem in choosing the best mix of communication, distribution, and selling channels for their offerings. Supply Chain Whereas marketing channels connect the marketer to the target buyers, the supply chain describes a longer channel stretching from raw materials to components to final products that are carried to final buyers. For example, the supply chain for women’s purses starts with hides, tanning operations, cutting operations, manufacturing, and the marketing channels that bring products to customers. This supply chain represents a value delivery system. Each company captures only a certain percentage of the total value generated by the supply chain. When a company acquires competitors or moves upstream or downstream, its aim is
外文翻译
华南理工大学广州学院 本科毕业设计(论文)外文翻译 外文原文名Marketing Strategy Adjustment and Marketing Innovation in the Experience Economy Era 中文译名体验经济时代的营销战略调整与营销创新 学院管理学院 专业班级2013级工商管理1班 学生姓名潘嘉谊 学生学号201330090184 指导教师罗玲苑讲师李巍巍 填写日期2017年5月19日
外文原文版出处:.Marketing Strategy Adjustment and Marketing Innovation in the Experience Economy Era[J]. Contemporary Logistics,2012 (06) :230-267 译文成绩:指导教师(导师组长)签名: 译文: 体验经济时代的营销战略调整与营销创新 吴青学 摘要:从商品货物经济,到服务经济的的转移演化经历过程,经历了农业经济、工业经济,服务经济和体验经济。在服务经济时期,企业只是打包经验与传统的产品一起销售,而在促进经验经济的时期,企业要把最好产品为未来的潜在用户设计,让消费者心甘情愿支付购买产品。 关键词:体验经济;市场营销战略;营销创新 1 介绍 随着科学技术和信息行业的发展,人们的需要和欲望连同消费者支出模式开始发生转变,相应地对企业生产环境产生了一系列影响。经济社会发展由传统时期进入体验经济时期。从一个经济产品的转变,进而到经济体系经济模式的转变。由缓慢转变为激进经济模式。因此导致社会发展从一个经济时期到另一个经济时期,经济模式和经济体系的转变将不可避免地影响到交换关系的转化。这是关注体验的结果,是由人类社会的发展的规律所决定的生产水平的产物。一旦交流关系发生变化、营销模式必须做出相应的变化。 2 企业营销策略的选择方向 在体验经济时代,企业不仅要理性思考高瞻远瞩,从客户的角度实施营销活动,更要重视与沟通客户,发现在他们内心的期望。我们自己的产品和服务代表企业的形象,产品要指向指定的客户体验。在当今时代,体验营销已成为营销活动最强大的秘密武器因此,这是非常重要的。而传统的营销策略,包括调整经验营销都已经不适应当前发展需求,迟早要被时代所淘汰。 2.1 建立营销思想的观念要求提高客户体验 根据马斯洛需求层次理论,人的需要分为五个层次,分别是:生理的需要、安全的需要、归属于爱的需要、尊重的需要和自我实现的需要。随着经济的发展和消费者日益增强的购买能力变化,人们生理需求得到满足,个人需求将会上升心
毕设外文文献翻译
xxxxxxxxx 毕业设计(论文)外文文献翻译 (本科学生用) 题目:Poduct Line Engineering: The State of the Practice 生产线工程:实践的形态 学生姓名:学号: 学部(系): 专业年级: 指导教师:职称或学位: 2011年3月10日
外文文献翻译(译成中文1000字左右): 【主要阅读文献不少于5篇,译文后附注文献信息,包括:作者、书名(或论文题目)、出版社(或刊物名称)、出版时间(或刊号)、页码。提供所译外文资料附件(印刷类含封面、封底、目录、翻译部分的复印件等,网站类的请附网址及原文】 Requirements engineering practices A precise requirements engineering process— a main driver for successful software development —is even more important for product line engineering. Usually, the product line’s scope addresses various domains simultaneously. This makes requirements engineering more complex. Furthermore, SPL development involves more tasks than single-product development. Many product line requirements are complex, interlinked, and divided into common and product-specific requirements. So, several requirements engineering practices are important specifically in SPL development: ? Domain identification and modeling, as well as commonalities and variations across product instances Separate specification and verification for platform and product requirements ? Management of integrating future requirements into the platform and products ? Identification, modeling, and management of requirement dependencies The first two practices are specific to SPL engineering. The latter two are common to software development but have much higher importance for SPLs. Issues with performing these additional activities can severely affect the product line’s long-term success. During the investigation, we found that most organizations today apply organizational and procedural measures to master these challenges. The applicability of more formal requirements engineering techniques and tools appeared rather limited, partly because such techniques are not yet designed to cope with product line evelopment’s inherent complexities. The investigation determined that the following three SPL requirements engineering practices were most important to SPL success. Domain analysis and domain description. Before starting SPL development, organizations should perform a thorough domain analysis. A well-understood domain is a prerequisite for defining a suitable scope for the product line. It’s the foundation for efficiently identifying and distinguishing platform and product requirements. Among the five participants in our investigation, three explicitly modeled the product line requirements. The others used experienced architects and domain experts to develop the SPL core assets without extensive requirements elicitation. Two organizations from the first group established a continuous requirements management that maintained links between product line and product instance requirements. The three other organizations managed their core assets’ evolution using change management procedures and versioning concepts. Their business did not force them to maintain more detailed links between the requirements on core assets and product instances. The impact of architectural decisions on requirements negotiations. A stable but flexible architecture is important for SPL development. However, focusing SPL evolution too much on architectural issues will lead to shallow or even incorrect specifications. It can cause core assets to ignore important SPL requirements so that the core assets lose relevance for SPL development. Organizations can avoid this problem by establishing clear responsibilities for requirements management in addition to architectural roles. The work group participants reported that a suitable organizational tool for balancing requirements and architecture is roundtable meetings in which requirements engineers,