浪潮财务报表
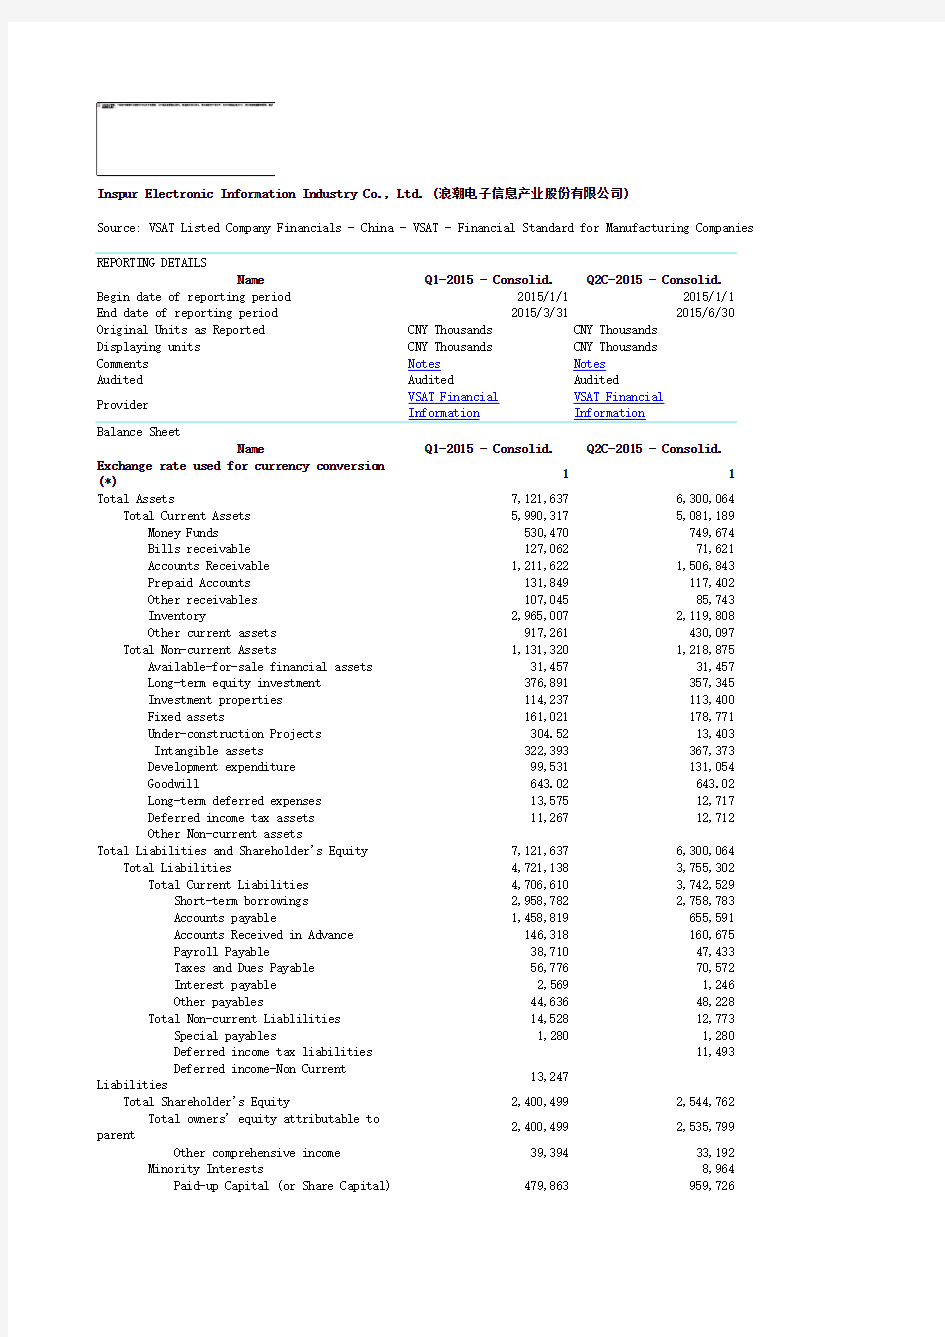

Inspur Electronic Information Industry Co., Ltd. (浪潮电子信息产业股份有限公司)
Source: VSAT Listed Company Financials - China - VSAT - Financial Standard for Manufacturing Companies
REPORTING DETAILS
Name Q1-2015 - Consolid.Q2C-2015 - Consolid. Begin date of reporting period2015/1/12015/1/1 End date of reporting period2015/3/312015/6/30 Original Units as Reported CNY Thousands CNY Thousands
Displaying units CNY Thousands CNY Thousands
Comments Notes Notes
Audited Audited Audited
Provider
VSAT Financial
Information
VSAT Financial
Information
Name Q1-2015 - Consolid.Q2C-2015 - Consolid.
Exchange rate used for currency conversion
(*)
11 Total Assets7,121,6376,300,064 Total Current Assets5,990,3175,081,189 Money Funds530,470749,674 Bills receivable127,06271,621 Accounts Receivable1,211,6221,506,843 Prepaid Accounts131,849117,402 Other receivables107,04585,743 Inventory2,965,0072,119,808 Other current assets917,261430,097 Total Non-current Assets1,131,3201,218,875 Available-for-sale financial assets31,45731,457 Long-term equity investment376,891357,345 Investment properties114,237113,400 Fixed assets161,021178,771 Under-construction Projects304.5213,403 Intangible assets322,393367,373 Development expenditure99,531131,054 Goodwill643.02643.02 Long-term deferred expenses13,57512,717 Deferred income tax assets11,26712,712 Other Non-current assets
Total Liabilities and Shareholder's Equity7,121,6376,300,064 Total Liabilities4,721,1383,755,302 Total Current Liabilities4,706,6103,742,529 Short-term borrowings2,958,7822,758,783 Accounts payable1,458,819655,591 Accounts Received in Advance146,318160,675 Payroll Payable38,71047,433 Taxes and Dues Payable56,77670,572 Interest payable2,5691,246 Other payables44,63648,228 Total Non-current Liablilities14,52812,773 Special payables1,2801,280 Deferred income tax liabilities11,493 Deferred income-Non Current
Liabilities
13,247
Total Shareholder's Equity2,400,4992,544,762 Total owners' equity attributable to
parent
2,400,4992,535,799 Other comprehensive income39,39433,192 Minority Interests8,964 Paid-up Capital (or Share Capital)479,863959,726
Additional Paid-In Capital954,389627,526 Earned Surplus96,84596,845 Undistributed Profits830,008818,511 Income Statement
Name Q1-2015 - Consolid.Q2C-2015 - Consolid.
Exchange rate used for currency conversion
11 (*)
Total operating income1,911,4184,164,812 Investment Income63,231223,594 Total operating cost1,906,9314,117,649 Operating Cost1,603,5553,535,562 Business Taxes and Surcharges1,2703,445 Selling Expenses / Marketing Costs131,945241,988 General and administrative expenses113,410221,424 Financial Cost34,53761,913 Impairment loss on assets22,21353,316 Operating Income1,911,4184,164,812
Share of profits in associates and joint
59,848214,448 ventures
Operating Profit67,718270,758 Non-operating income16,41123,043 Non-operating expenses 2.7324.14
Losses from disposal of non-current
2.73
3.14 assets
Total Profit84,127293,777
Income tax expenses15,07653,876
Net Profit69,051239,901
Owners' net profit attributable to parent69,051239,901
Minority Interest Income
Other Comprehensive Income-3,953-10,155
Total comprehensive income65,098229,746
Total comprehensive income attributable to
65,098229,746 shareholders of the parent company
Total comprehensive income attributable to
minority shareholders
Cash Flow Statement
Name Q1-2015 - Consolid.Q2C-2015 - Consolid.
Exchange rate used for currency conversion
11 (*)
Net Cash Flows Provided by Operating Activities-1,008,941-1,154,272 Total Cash Inflow from Operation Activities1,981,4994,345,241
Cash received from sales of goods and
1,899,1284,108,255 labor
Refund of tax and levies43,91890,708 Other cash related with operation38,453146,278
Total Cash Outflow from Operation
2,990,4405,499,513 Activities
Net Cash Flows Provided by Investment
-295,085357,283 Activities
Cash paid for goods and services2,572,5104,702,898
Cash paid to and on behalf of
104,443219,328 employees
Tax and fee Payment38,570108,530
Other cash paid relating to operating
274,916468,757 activities
Total Cash Inflow from Investment
969,1412,795,941 Activities
Cash received from disposal of
966,2712,780,683 investments
Cash received from returns on
2,86715,251 investments
Net cash received from disposal of
2.95 6.60 fixed assets, intangible assets and other
longterm assets
Total Cash Outflow from Investment
1,264,2272,438,658 Activities
Cash paid to acquire fixed assets,
94,163153,314 intangible assets and other longterm assets
Cash paid to investment1,170,0642,284,262
Net cash payments for acquisitions
1,082 of subsidiaries and other business units
Net Cash Flows from Financing Activities796,367528,737 Cash Inflow from Financing Activities1,516,4843,581,319 Cash received from investment
Cash received from borrowings1,516,4843,581,319 Cash Outflow in Financing Activities720,1173,052,583 Cash repayments of amounts borrowed708,1092,974,064
Cash payments for interest expenses and
12,00777,986 distribution of dividends or profit
Other cash payments relating to
531.85 financing activities
Net Increase in Cash or Cash Equivalents-506,758-269,904
Cash and Cash Equivalents at Beginning of
924,002837,105 Period
Cash and Cash Equivalents at Ending of
417,245567,201 Period
OTHER INFORMATION
Name Q1-2015 - Consolid.Q2C-2015 - Consolid. Reporting Type Non-Cumulative Cumulative
Audited Audited Audited
Financial Statement Type Consolid.Consolid.
Fiscal Year End December December
Any redistribution of this information is strictly prohibited.
Copyright ? 2016 EMIS, all rights reserved.
A Euromoney Institutional Investor company.
cturing Companies
Q3C-2015 - Consolid.Y-2015 - Consolid.
2015/1/12015/1/1
2015/9/302015/12/31 CNY Thousands CNY Thousands
CNY Thousands CNY Thousands
Notes Notes
Audited Audited
VSAT Financial Information VSAT Financial Information
Q3C-2015 - Consolid.Y-2015 - Consolid.
11
7,141,5557,819,355
5,841,1186,361,799
931,514988,525
117,168277,798
1,918,0071,681,158
216,818149,652
93,985109,159
2,143,2142,268,606
420,412886,901
1,300,4381,457,555
31,45731,457
362,109364,194
112,564111,727
228,126231,608
25,047124,446
351,061519,815
166,29035,849
643.02643.02
11,84615,702
11,29621,298
818.60
7,141,5557,819,355
4,504,6274,977,497
4,487,8754,927,851
2,923,5062,951,216
1,098,0911,269,411
338,797504,559
47,56952,528
33,07474,610
306.98108.06
46,52975,419
16,75249,645
1,2811,190
15,47148,456
2,636,9282,841,858
2,625,7032,832,005
34,00879,064
11,2259,853
959,726959,726
647,860668,560
96,845132,586
887,265992,069 Q3C-2015 - Consolid.Y-2015 - Consolid.
11
6,892,64310,123,000
231,930236,693
6,781,2929,893,989
5,902,2338,555,933
6,32310,080
365,913522,567
351,695575,473
88,795112,620
66,333117,315
6,892,64310,123,000
219,716221,210
343,281465,704
35,02483,667
27.9449.33
2.73 6.32
378,277549,321
70,417102,287
307,860447,034
308,655449,201
-795.10-2,167
-9,33935,717
298,521482,751
299,316484,918
-795.10-2,167
Q3C-2015 - Consolid.Y-2015 - Consolid.
11
-744,153-143,705
7,243,18211,136,095
6,914,79510,648,568
127,509161,667
200,879325,860
7,987,33511,279,800
151,448-393,175
7,041,63310,031,399
326,325459,421
164,091204,470
455,287584,510
3,507,9174,285,482
3,488,8354,263,876
19,07021,588
12.5817.51
3,356,4694,678,657
313,289445,435
3,043,1804,233,221
584,555629,879
5,273,6546,893,195
3,0563,056
5,270,5986,890,139
4,689,0996,263,317
4,585,6706,131,599
102,897129,935
531.851,782
-5,933100,998
837,105837,105
831,171938,102
Q3C-2015 - Consolid.Y-2015 - Consolid. Cumulative
Audited Audited
Consolid.Consolid.
December December