色坐标图
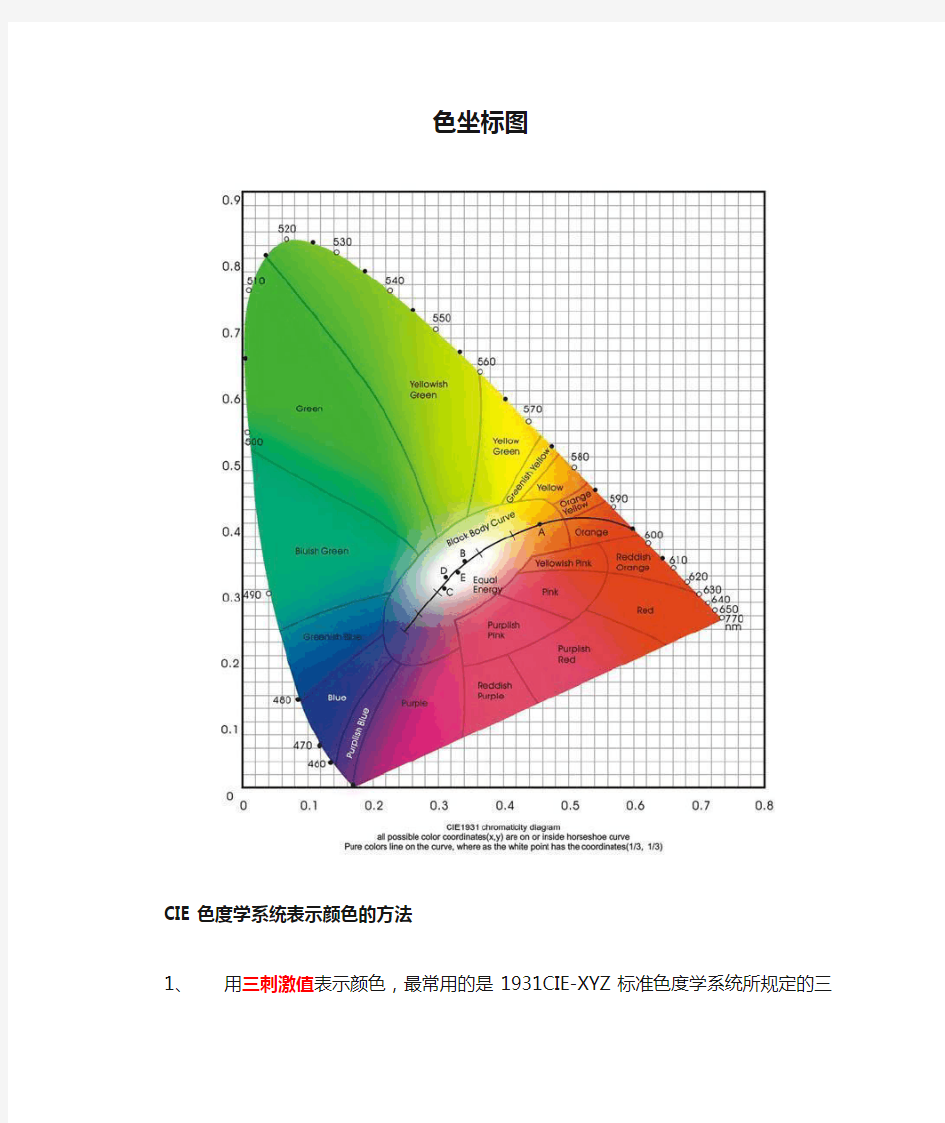

色坐标图
CIE色度学系统表示颜色的方法
1、用三刺激值表示颜色,最常用的是1931CIE-XYZ标准色度学系统所规定的三
刺激值X、Y和Z。
2、用色品坐标x、y及Y刺激值表示颜色,色品坐标是三刺激值fenbie对三刺
激值总量的比值,在测量中不需对三刺激值准确标定便可准确地确定色品坐标,故常用色品坐标x和y表示颜色,但是由于色品坐标是三刺激值各自对三刺激值总量的比值,从而失去了表示光亮度的因子,只表示了颜色的色调。
颜色匹配
从图上可以看出:
1、波长700~770nm的光谱色,色品点重合,表明他们有相同的色品坐标,在亮
度相同时,表观颜色相同
2、两点连线上的颜色都可以用两点的颜色以一定的比例配出来,波长
540~700nm光谱色轨迹是一段直线,所以这段直线上的任何光谱色都可以用540nm和700nm两种光谱色配出来。
主波长和补色波长
CIE 1931 color space from---Wiki Encyclopedia
In the study of color perception, the CIE 1931 RGB and CIE 1931 XYZ color spaces are the first mathematically defined color spaces. They were created by the International Commission on Illumination(CIE) in 1931.[1][2]
The CIE XYZ color space was derived from a series of experiments done in the late 1920s by William David Wright[3] and John Guild.[4] Their experimental results were combined into the specification of the CIE RGB color space, from which the CIE XYZ color space was derived.
Tristimulus values
The normalized spectral sensitivity of human cone cells of short-, middle- and long-wavelength types
The human eye has three kinds of cone cells, which sense light, with spectral sensitivity peaks in short (S, 420–440 nm), middle (M,
530–540 nm), and long (L, 560–580 nm) wavelengths. These cone cells underlie human color perception under medium- and high-brightness conditions (in very dim light, color vision diminishes, and the
low-brightness, monochromatic "night-vision" receptors, called rod cells, take over). Thus, three parameters, corresponding to levels of stimulus of the three types of cone cells, can in principle describe any color sensation. Weighting a total light power spectrum by the individual spectral sensitivities of the three types of cone cells gives three effective stimulus values; these three values make up a tristimulus specification of the objective color of the light spectrum. The three parameters, noted S, M, and L, can be indicated using a 3-dimension space,
called LMS color space, which is one of many color spaces which have been devised to help quantify human color vision.
A color space maps a range of physically produced colors (from mixed light, pigments, etc.) to an objective description of color sensations registered in the eye, typically in terms of tristimulus values, but not usually in the LMS space defined by the cone spectral sensitivities. The tristimulus values associated with a color space can be conceptualized as amounts of three primary colors in a tri-chromatic additive color model. In some color spaces, including LMS and XYZ spaces, the primary colors used are not real colors, in the sense that they cannot be generated with any light spectrum.
The CIE XYZ color space encompasses all color sensations that an average person can experience. It serves as a standard reference against which many other color spaces are defined. A set of color-matching functions, like the spectral sensitivity curves of the LMS space but not restricted to be nonnegative sensitivities, associates physically produced light spectra with specific tristimulus values.
Consider two light sources made up of different mixtures of various wavelengths. Such light sources may appear to be the same color; this effect is called metamerism. Such light sources have the same apparent color to an observer when they produce the same tristimulus values, no matter what are the spectral power distributions of the sources.
Most wavelengths will not stimulate only one type of cone cell, because the spectral sensitivity curves of the three types of cone cells overlap. Certain tristimulus values are thus physically impossible (for instance LMS tristimulus values that are non-zero for one component, and zeros for the others). And LMS tristimulus values for pure spectral colors would, in any normal trichromatic additive color space (e.g. RGB color spaces), imply negative values for at least one of the three primaries, since the chromaticity would be outside the color triangle defined by the primary colors. To avoid these negative RGB values, and to have one component that describes the perceived brightness, "imaginary" primary colors and corresponding color-matching functions have been formulated. The resulting tristimulus values are defined by the CIE 1931 color space, in which they are denoted X, Y, and Z.[5]
Meaning of X, Y, and Z
A comparison between a typical normalised M cone's spectral sensitivity and the CIE 1931 luminosity function for a standard observer in photopic vision
When judging the relative luminance (brightness) of different colors in well-lit situations, humans tend to perceive light within the green parts of the spectrum as brighter than red or blue light of equal power. The luminosity function that describes the perceived brightnesses of different wavelengths is thus roughly analogous to the spectral sensitivity of M cones.
The CIE model capitalises on this fact by defining Y as luminance. Z is quasi-equal to blue stimulation, or the S cone response, and X is a mix (a linear combination) of cone response curves chosen to be nonnegative. The XYZ tristimulus values are thus analogous to, but not equal to, the LMS cone responses of the human eye. Defining Y as luminance has the useful result that for any given Y value, the XZ plane will contain all possible chromaticities at that luminance.
CIE standard observer
Due to the distribution of cones in the eye, the tristimulus values depend on the observer's field of view. To eliminate this variable, the CIE defined a color-mapping function called the standard (colorimetric) observer, to represent an average human's chromatic response within a 2° arc inside the fovea. This angle was chosen owing to the belief that the color-sensitive cones resided within a 2° arc of the fovea. Thus the CIE 1931 Standard Observer function is also known as the CIE 1931 2° Standard
Observer. A more modern but less-used alternative is the CIE 1964 10° Standard Observer, which is derived from the work of Stiles and Burch,[6] and Speranskaya.[7]
For the 10° experiments, the observers were instructed to ignore the central 2° spot. The 1964 Supplementary Standard Observer function is recommended when dealing with more than about a 4° field of view. Both standard observer functions are discretized at 5 nm wavelength intervals from 380 nm to 780 nm and distributed by the CIE.[8]The standard observer is characterized by three color matching functions.
The derivation of the CIE standard observer from color matching experiments is given below, after the description of the CIE RGB space.
Color matching functions
The CIE standard observer color matching functions
The CIE's color matching functions, and are the numerical
description of the chromatic response of the observer(described above). They can be thought of as the spectral sensitivity curves of three linear light detectors yielding the CIE tristimulus values X, Y and Z. Collectively, these three functions are known as the CIE standard observer.[9]
The tristimulus values for a color with a spectral power distribution
are given in terms of the standard observer by:
where is the wavelength of the equivalent monochromatic light (measured in nanometers).
Other observers, such as for the CIE RGB space or other RGB color spaces, are defined by other sets of three color-matching functions, and lead to tristimulus values in those other spaces.
The values of X, Y, and Z are bounded if the intensity spectrum is bounded.
CIE xy chromaticity diagram and the CIE xyY color space
The CIE 1931 color space chromaticity diagram. The outer curved boundary is the spectral (or monochromatic) locus, with wavelengths shown in nanometers. Note that the colors your screen displays in this image are specified using sRGB, so the colors
outside the sRGB gamut are not displayed properly. Depending on the color space and calibration of your display device, the sRGB colors may not be displayed properly either. This diagram displays the maximally saturated bright colors that can be produced by a computer monitor or television set.
The CIE 1931 color space chromaticity diagram rendered in terms of the colors of lower saturation and value than those displayed in the diagram above that can be produced by pigments, such as those used in printing. The color names are from the Munsell color system.
Since the human eye has three types of color sensors that respond to different ranges of wavelengths, a full plot of all visible colors is a three-dimensional figure. However, the concept of color can be divided into two parts: brightness and chromaticity. For example, the color white is a bright color, while the color grey is considered to be a less bright version of that same white. In other words, the chromaticity of white and grey are the same while their brightness differs.
The CIE XYZ color space was deliberately designed so that the Y parameter was a measure of the brightness or luminance of a color. The chromaticity of a color was then specified by the two derived parameters x and y, two of the three normalized values which are functions of all three tristimulus values X, Y, and Z:
The derived color space specified by x, y, and Y is known as the CIE xyY color space and is widely used to specify colors in practice.
The X and Z tristimulus values can be calculated back from the chromaticity values x and y and the Y tristimulus value:
The figure on the right shows the related chromaticity diagram. The outer curved boundary is the spectral locus, with wavelengths shown in nanometers. Note that the chromaticity diagram is a tool to specify how the human eye will experience light with a given spectrum. It cannot specify colors of objects (or printing inks), since the chromaticity observed while looking at an object depends on the light source as well.
Mathematically, x and y are projective coordinates and the colors of the chromaticity diagram occupy a region of the real projective plane.
The chromaticity diagram illustrates a number of interesting properties of the CIE XYZ color space:
The diagram represents all of the chromaticities visible to the average person.
These are shown in color and this region is called the gamut of human vision.
The gamut of all visible chromaticities on the CIE plot is the tongue-shaped or horseshoe-shaped figure shown in color. The curved edge of the gamut is
called the spectral locus and corresponds to monochromatic light (each point
representing a pure hue of a single wavelength), with wavelengths listed in
nanometers. The straight edge on the lower part of the gamut is called the line
of purples. These colors, although they are on the border of the gamut, have no
counterpart in monochromatic light. Less saturated colors appear in the
interior of the figure with white at the center.
?It is seen that all visible chromaticities correspond to non-negative values of x, y, and z (and therefore to non-negative values of X, Y, and Z).
?If one chooses any two points of color on the chromaticity diagram, then all the colors that lie in a straight line between the two points can be formed by
mixing these two colors. It follows that the gamut of colors must be convex in
shape. All colors that can be formed by mixing three sources are found inside
the triangle formed by the source points on the chromaticity diagram (and so
on for multiple sources).
?An equal mixture of two equally bright colors will not generally lie on the midpoint of that line segment. In more general terms, a distance on the xy
chromaticity diagram does not correspond to the degree of difference between
two colors. In the early 1940s, David MacAdam studied the nature of visual
sensitivity to color differences, and summarized his results in the concept of a
MacAdam ellipse. Based on the work of MacAdam, the CIE 1960, CIE 1964,
and CIE 1976 color spaces were developed, with the goal of achieving
perceptual uniformity (have an equal distance in the color space correspond to
equal differences in color). Although they were a distinct improvement over
the CIE 1931 system, they were not completely free of distortion.
?It can be seen that, given three real sources, these sources cannot cover the gamut of human vision. Geometrically stated, there are no three points within
the gamut that form a triangle that includes the entire gamut; or more simply,
the gamut of human vision is not a triangle.
?Light with a flat power spectrum in terms of wavelength (equal power in every
1 nm interval) corresponds to the point (x,y) = (1/3,1/3).
Definition of the CIE XYZ color space
CIE RGB color space
The CIE RGB color space is one of many RGB color spaces, distinguished by a particular set of monochromatic (single-wavelength) primary colors.
In the 1920s, W. David Wright[3] and John Guild[4] independently conducted a series of experiments on human sight which laid the foundation for the specification of the CIE XYZ color space.
Gamut of the CIE RGB primaries and location of primaries on the CIE 1931 xy chromaticity diagram
The experiments were conducted by using a circular split screen (a bipartite field) 2 degrees in diameter, which is the angular size of the human fovea. On one side of the field a test color was projected and on the other side, an observer-adjustable color was projected. The adjustable color was a mixture of three primary colors, each with fixed chromaticity, but with adjustable brightness.
The observer would alter the brightness of each of the three primary beams until a match to the test color was observed. Not all test colors could be matched using this technique. When this was the case, a variable amount of one of the primaries could be added to the test color, and a match with the remaining two primaries was carried out with the variable color spot. For these cases, the amount of the primary added to the test color was considered to be a negative value. In this way, the entire range of human color perception could be covered. When the test colors were monochromatic, a plot could be made of the amount of each primary used as a function of the wavelength of the test color. These three functions are called the color matching functions for that particular experiment.
The CIE 1931 RGB Color matching functions. The color matching functions are the amounts of primaries needed to match the monochromatic test primary at the wavelength shown on the horizontal scale.
Although Wright and Guild's experiments were carried out using various primaries at various intensities, and although they used a number of different observers, all of their results were summarized by the
standardized CIE RGB color matching functions , , and ,
obtained using three monochromatic primaries at standardized wavelengths of 700 nm (red), 546.1 nm (green) and 435.8 nm (blue). The color matching functions are the amounts of primaries needed to match the monochromatic test primary. These functions are shown in the plot on the right (CIE 1931).
Note that and are zero at 435.8, and are zero at 546.1
and and are zero at 700 nm, since in these cases the test color
is one of the primaries. The primaries with wavelengths 546.1 nm and 435.8 nm were chosen because they are easily reproducible monochromatic lines of a mercury vapor discharge. The 700 nm wavelength, which in 1931 was difficult to reproduce as a monochromatic beam, was chosen because the eye's perception of color is rather unchanging at this wavelength, and therefore small errors in wavelength of this primary would have little effect on the results.
The color matching functions and primaries were settled upon by a CIE special commission after considerable deliberation.[10]The cut-offs at the short- and long-wavelength side of the diagram are chosen somewhat arbitrarily; the human eye can actually see light with wavelengths up to
about 810 nm, but with a sensitivity that is many thousand times lower than for green light. These color matching functions define what is known as the "1931 CIE standard observer". Note that rather than specify the brightness of each primary, the curves are normalized to have constant area beneath them. This area is fixed to a particular value by specifying that
The resulting normalized color matching functions are then scaled in the r:g:b ratio of 1:4.5907:0.0601 for source luminance and 72.0962:1.3791:1 for source radiant power to reproduce the true color matching functions. By proposing that the primaries be standardized, the CIE established an international system of objective color notation.
Given these scaled color matching functions, the RGB tristimulus values
for a color with a spectral power distribution would then be given by:
These are all inner products and can be thought of as a projection of an infinite-dimensional spectrum to a three-dimensional color. (See also: Hilbert space)
Grassmann's law
One might ask: "Why is it possible that Wright and Guild's results can be summarized using different primaries and different intensities from those actually used?" One might also ask: "What about the case when the test colors being matched are not monochromatic?" The answer to both of
these questions lies in the (near) linearity of human color perception. This linearity is expressed in Grassmann's law.
The CIE RGB space can be used to define chromaticity in the usual way: The chromaticity coordinates are r and g where:
Construction of the CIE XYZ color space from the
Wright–Guild data
Having developed an RGB model of human vision using the CIE RGB matching functions, the members of the special commission wished to develop another color space that would relate to the CIE RGB color space. It was assumed that Grassmann's law held, and the new space would be related to the CIE RGB space by a linear transformation. The new space would be defined in
terms of three new color matching functions , , and as
described above. The new color space would be chosen to have the following desirable properties:
Diagram in CIE rg chromaticity space showing the construction of the triangle specifying the CIE XYZ color space. The triangle C b-C g-C r is just the
xy=(0,0),(0,1),(1,0) triangle in CIE xy chromaticity space. The line connecting C b and C r is the alychne. Notice that the spectral locus passes through rg=(0,0) at 435.8 nm, through rg=(0,1) at 546.1 nm and through rg=(1,0) at 700 nm. Also, the equal energy point (E) is at rg=xy=(1/3,1/3).
1.The new color matching functions were to be everywhere greater than or equal
to zero. In 1931, computations were done by hand or slide rule, and the
specification of positive values was a useful computational simplification.
2.The color matching function would be exactly equal to the photopic
luminous efficiency function V(λ) for the "CIE standard photopic observer".[11] The luminance function describes the variation of perceived brightness with
wavelength. The fact that the luminance function could be constructed by a
linear combination of the RGB color matching functions was not guaranteed
by any means but might be expected to be nearly true due to the near-linear
nature of human sight. Again, the main reason for this requirement was
computational simplification.
3.For the constant energy white point, it was required that x = y = z = 1/3.
4.By virtue of the definition of chromaticity and the requirement of positive
values of x and y, it can be seen that the gamut of all colors will lie inside the
triangle [1,0], [0,0], [0,1]. It was required that the gamut fill this space
practically completely.
5.It was found that the color matching function could be set to zero above
650 nm while remaining within the bounds of experimental error. For
computational simplicity, it was specified that this would be so.
In geometrical terms, choosing the new color space amounts to choosing a new triangle in rg chromaticity space. In the figure above-right, the rg chromaticity coordinates are shown on the two axes in black, along with the gamut of the 1931 standard observer. Shown in red are the CIE xy chromaticity axes which were determined by the above requirements. The requirement that the XYZ coordinates be non-negative means that the
triangle formed by C
r , C
g
, C
b
must encompass the entire gamut of the standard
observer. The line connecting C
r and C
b
is fixed by the requirement that
the function be equal to the luminance function. This line is the line of zero luminance, and is called the alychne. The requirement that
the function be zero above 650 nm means that the line connecting C
g
and C
r must be tangent to the gamut in the region of K
r
. This defines the
location of point C
r
. The requirement that the equal energy point be defined by x = y = 1/3 puts a restriction on the line joining C b and C g, and finally, the requirement that the gamut fill the space puts a second restriction on this line to be very close to the gamut in the green region,
which specifies the location of C
g and C
b
. The above described
transformation is a linear transformation from the CIE RGB space to XYZ space. The standardized transformation settled upon by the CIE special commission was as follows:
The numbers in the conversion matrix below are exact, with the number of digits specified in CIE standards.[10]
While the above matrix is exactly specified in standards, going the other direction uses an inverse matrix that is not exactly specified, but is approximately:
The integrals of the XYZ color matching functions must all be equal by requirement 3 above, and this is set by the integral of the photopic luminous efficiency function by requirement 2 above. The tabulated sensitivity curves have a certain amount of arbitrariness in them. The shapes of the individual X, Y and Z sensitivity curves can be measured with a reasonable accuracy. However, the overall luminosity curve (which in fact is a weighted sum of these three curves) is subjective, since it
involves asking a test person whether two light sources have the same brightness, even if they are in completely different colors. Along the same lines, the relative magnitudes of the X, Y, and Z curves are arbitrary. Furthermore, one could define a valid color space with an X sensitivity curve that has twice the amplitude. This new color space would have a different shape. The sensitivity curves in the CIE 1931 and 1964 XYZ color spaces are scaled to have equal areas under the curves.
See also
?Trichromacy
?Imaginary color
?Lab color space
?Standard illuminant, the definition of white point used by CIE and commonly shown in color space diagrams as E, D50 or D65
References
1.Jump up ^CIE (1932). Commission internationale de l'Eclairage
proceedings, 1931. Cambridge: Cambridge University Press.
2.Jump up ^ Smith, Thomas; Guild, John (1931–32). "The C.I.E.
colorimetric standards and their use". Transactions of the Optical
Society33 (3): 73–134. doi:10.1088/1475-4878/33/3/301.
3.^ Jump up to: a b Wright, William David (1928). "A re-determination
of the trichromatic coefficients of the spectral colours". Transactions of the Optical Society30(4): 141–164. doi:10.1088/1475-4878/30/4/301.
4.^ Jump up to: a b Guild, J. (1932). "The colorimetric properties
of the spectrum". Philosophical Transactions of the Royal Society of
London. Series A, Containing Papers of a Mathematical or Physical
Character230: 149–187. doi:10.1098/rsta.1932.0005. JSTOR91229.
5.Jump up ^Hunt, R. W. (1998). Measuring Colour(3rd ed.). England:
Fountain Press. ISBN0-86343-387-1.. See pgs. 39–46 for the basis in human eye physiology of three-component color models, and 54–57 for
chromaticity coordinates.
6.Jump up ^ Stiles, W. S.; Birch, J. M. (1959). "N.P.L.
Colour-matching Investigation: Final Report (1958)". Optica Acta6(1): 1–26. doi:10.1080/713826267.
7.Jump up ^ Speranskaya, N. I. (1959). "Determination of spectrum
color co-ordinates for twenty seven normal observers". Optics and
Spectroscopy7: 424–428.
8.Jump up ^"CIE Free Documents for Download".
9.Jump up ^ Harris, A. C.; Weatherall, I. L. (September 1990).
"Objective evaluation of colour variation in the sand-burrowing beetle Chaerodes trachyscelides White (Coleoptera: Tenebrionidae) by
instrumental determination of CIE LAB values". Journal of the Royal
Society of New Zealand(The Royal Society of New Zealand) 20(3): 253–259.
doi:10.1080/03036758.1990.10416819.
10.^ Jump up to: a b Fairman, H. S.; Brill, M. H.; Hemmendinger, H.
(February 1997). "How the CIE 1931 Color-Matching Functions Were Derived from the Wright–Guild Data". Color Research and Application22 (1):
11–23.
doi:10.1002/(SICI)1520-6378(199702)22:1<11::AID-COL4>3.0.CO;2-7. and
Fairman, H. S.; Brill, M. H.; Hemmendinger, H. (August 1998). "Erratum: How the CIE 1931 Color-Matching Functions Were Derived from the
Wright–Guild Data". Color Research and Application23 (4): 259–259.
doi:10.1002/(SICI)1520-6378(199808)23:4<259::AID-COL18>3.0.CO;2-7.
11.Jump up ^CIE (1926). Commission internationale de l'Eclairage
proceedings, 1924. Cambridge: Cambridge University Press. Note that the 1924 luminous efficiency function seriously underestimates sensitivity at wavelengths below 460 nm, and has been supplemented with newer and more accurate luminosity curves; see Luminosity function#Improvements to the standard.
Further reading
Broadbent, Arthur D. (August 2004). "A critical review of the development of the CIE1931 RGB color-matching functions". Color Research & Applications29 (4): 267–272. doi:10.1002/col.20020.
"This article describes the development of the CIE1931 chromaticity coordinates and color-matching functions starting from the initial experimental data of W. D. Wright and J. Guild. Sufficient
information is given to allow the reader to reproduce and verify
the results obtained at each stage of the calculations and to
analyze critically the procedures used. Unfortunately, some of the information required for the coordinate transformations was never published and the appended tables provide likely versions of that missing data."
?Trezona, Pat W. (2001). "Derivation of the 1964 CIE 10° XYZ Colour-Matching Functions and Their Applicability in Photometry".
Color Research and Application26 (1): 67–75.
doi:10.1002/1520-6378(200102)26:1<67::AID-COL7>3.0.CO;2-4.
?Wright, William David (2007). "Golden Jubilee of Colour in the CIE—The Historical and Experimental Background to the 1931 CIE System of Colorimetry". In Schanda, János. Colorimetry. Wiley
Interscience. pp. 9–24. doi:10.1002/9780470175637.ch2.
ISBN978-0-470-04904-4. (originally published by the Society of Dyers and Colourists, Bradford, 1981.)
External links
?Introduction to Colour Science, William Andrew Steer.
?efg's Color Chromaticity Diagrams Lab Report and Delphi source ?CIE Color Space, Gernot Hoffman
?Annotated downloadable data tables, Andrew Stockman and Lindsay T.
Sharpe.
?Calculation from the original experimental data of the CIE 1931 RGB standard observer spectral chromaticity co-ordinates and color
matching functions
?Colorimetric data useful for calculation, in various file formats ?COLORLAB MATLAB toolbox for color science computation and accurate color reproduction. It includes CIE standard tristimulus
colorimetry and transformations to a number of non-linear color appearance models (CIE Lab, CIE CAM, etc.).
?Precise Color Communication Konica Minolta Sensing
色温 (CCT) 和色度坐标 (x, y 值)
一、关于led灯具SSL规范的概述 今年 5 月份,LED 灯具的能源之星的规范,美洲已公开草案;估计今年的 8 至9 月份,会上升为最终版本,并于9 个月后,即08 年6 月份,授理ENERGY STAR申请;本规范是由 美国能源部DOE 负责组织, Lighting Research Center 技术负责; 二、重要流行词 1、SSL (Solid-State Lighting 固态照明) vs. Semi-conductor Lighting (半导体照明) vs. LED Lighting (LED 照明) SSL:(在Internet 网络上,SSL 在90 年代即有, 是Internet 传输加密协议缩略词SSL =Secure Socket Layer; )如今,在国外,有关研究 LED 的政府机构,公司和机构,很流行用 SSL 代替LED; 然而,目前,SSL 还没有给出正式定义,在美国的LRC 网站上,“What is SSL?”,只是解释为: SSL 是区别于传统的灯丝白帜发光和气体放电发光原理,由半导体的电子发光,包括LED,OLED,Laser Diode (LD),light-emitting polymers. 2、半导体照明 (Semi-conductor Lighting), 在中国政府机构,沿用过去的称谓“半导体照明”较多;但是,LED 产品,技术和标准,美国领先其他国家许多;中国也会随美国技术潮流使用SSL 称谓,尤其在DOE 公开本规范后; 三、我们的目的 1、本规范是第一部LED 照明的性能参数标准,指明了LED 照明的基本要求; 2、LED 灯具的ENERGY STAR认证,要在08 年6 月前讨论;但是,我们可以提前借鉴此规范化的参数标准,应用到研发品质行销工作中,是有帮助的; 3、本规范是如何基于荧光灯,建立 SSL-LED 灯具的光效目标和特性参数要求:
色坐标分档
能源之星之色坐标分档 ANSI C78.377 - 2008 色温 2700K 色温范围 2725±145色坐标中心点 x y 色坐标 范围y x 0.43190.4813 0.45620.42600.39440.45930.43730.38930.4101 0.4578 0.38140.41470.43730.38930.41650.42990.4562 0.42600.40440.4006 0.37360.38740.37160.38980.36700.35780.36900.38890.41470.38140.40150.39960.4299 0.41650.37600.3551 0.33760.36160.34870.35150.33660.33690.32430.32220.33660.33690.34620.32070.33760.36160.35480.37360.35780.36700.35120.34650.34810.3205 0.30280.33040.3261 0.3221 0.30680.31133000K 3500K 4000K 5700K 6500K 5000K 4500K 0.43380.4030 3045±1750.38180.3797 3985±2753465±2450.40730.3917 0.3417 0.32870.3553 0.34470.36110.3658 4503±2435028±2835665±3556530±5100.31230.3282 0.3736 0.3874单位 K 单位 K 2580~2870 2870~3220 3710~4260 4260~4746 5310~6020 4745~53316020~7040 3220~3710
色坐标转换色温
首先,你要有一“黑体轨迹等温线的色品坐标”表。此表“色度学”书中有。 然后,运用内插法和三角形垂足法计算色温 在“黑体轨迹等温线的色品坐标”表中,每一行(每一色温)有“黑体轨迹上”x、y,设为x1、y1,“黑体轨迹外” x、y,设为x2、y2。用仪器测得色度坐标x、y设为x0、y0。 从最低色温起,取其x1、y1,x2、y2;代入D1 = (x0-x1)(y1-y2)-(x1-x2)(y0-y1),如果D1 = 0则(相关)色温得到。如果D1不等于0,取上一行x1、y1,x2、y2;代入D2 = (x0-x1)(y1-y2)-(x1-x2)(y0-y1),如果D2 = 0则(相关)色温得到。如果D2不等于0,判断D1*D2是否小于0。 如果D1*D2大于0,使D1 = D2,再取上一行x1、y1,x2、y2;代入D2 = (x0-x1)(y1-y2)-(x1-x2)(y0-y1),如果D2 = 0则(相关)色温得到。如果D2不等于0,判断D1*D2是否小于0。 如果D1*D2小于0,则找到“测得坐标在这两条等温线之间”。D1、D2取绝对值,相对应色温为T1、T2。 那么CCT ≈ T1 + D1 * (T1+T2) / (D1+D2) 如果一直找不到D1*D2小于0,那是测得坐标在∞(无穷大)等温线左下方,那片区域是没有(相关)色温的。 按理说,离开黑体轨迹一定距离,就没有(相关)色温概念了,可是现在给搞混淆了。
或者,你在附图中,把你坐标点上去,看左右两条等温线的色温,估算出。 特征点对应的色坐标值和色温 光源点X坐标Y坐标色温(K) A 0.4476 0.4074 2854 B 0.3484 0.3516 4800 C 0.3101 0.3162 6800 D 0.313 0.329 6500 E 0.3333 0.3333 5500
麦克亚当色区图讲解
麦克亚当色区RD1 2013-9-2
麦克亚当色区 色差 固态照明标准 麦克亚当理论 色容差定义 Contents 产出分布
色容差:是表征光色电检测系统的X,Y值与标准光源之间差别。数值越小,准确度越高。 相关色温:当光源发出光的颜色与黑体在某一温度下辐射的颜色接近时,该黑体温度就称为该光源的相关色温。 a.相关色温与色坐标转换公式: T=-437n3+3601n2-6861n+5514.31,n=(x-0.3320)/(y-0.1858) T:色温 n:系数 x,y:色坐标 小结:从公式和定义可知: 1、色坐标与色温是一对多的关系,相同 的色温有不同的XY值。 2、相同的色温能产生不同颜色的感官。 a. 如左图AB两点为同一色温,但表现 出完全不同的颜色。 a.色容差实际指测量值偏离目标值的距离。 b.色容差的量化一般用椭圆来表征。 疑问:同一色温的XY组合有很多,怎样的色温 及坐标才是符合固态照明及人眼舒适度感官? 色容差定义
人眼对颜色的敏感度 麦克亚当理论 麦克亚当椭圆 小结: 1、人眼对光谱颜色的差别感受性为非均匀性; 2、根据人眼对颜色的识别度不同,麦克亚当椭圆在不同区域大小也是不一致的。 麦克亚当椭圆理论: 为描述普通人眼的颜色视觉的精确度以及区分相似颜色的优良度提供了指导方法。椭圆内的颜色代表人眼感觉不出颜色太大变化的范围称为颜色的宽容量。
固态照明标准 行业标准水平: 1、能源之星ANSI C78.376 ,色容差≤7SDCM; 2、欧盟标准IEC60081 ,色容差≤7SDCM; 3、国标GB10682-2002,色容差≤5SDCM; 标准点X Y F65000.313 0.337 F50000.346 0.359 F40000.380 0.380 F35000.409 0.394 F30000.440 0.403 F27000.463 0.420 小结: 1、测试产品色容差时,需 以各自色温段的标准点为 基准,测试结果才准确。
色温对照表
色温对照表 拍摄时色温的设置(对照表) 烛 焰 1500 -1800* 日落前光色偏红,色温降至2200) 家用白灯 2500-3000 60瓦的充气钨丝灯 2800 100瓦的钨丝灯 2950 1000瓦的钨丝灯 3000(日出后40分钟光色较黄) 500瓦的投影灯 2865 500瓦钨丝灯 3175 3200K的泛光灯 3200
琥珀闪光信号灯 3200 R32反射镜泛光灯 3200 锆制的浓弧光灯 3200 反射镜泛光灯 3400 暖色的白荧光灯 3500 清晰闪光灯信号 3800 冷色的白荧光灯 4500 白昼的泛光灯 4800 (下午阳光雪白上升4800~5800) 白焰碳弧灯 5000 (阳光直射下) M2B闪光信号灯 5100 晴 天 5200* 正午的日光 5400 高强度的太阳弧光灯 5550 夏季的直射太阳光 5800 早上10点到下午3点的直射太阳光 6000*(摄影拍片黄金时间) 蓝闪光信号灯 6000 白昼的荧光灯6500(阴天下6500~9000) 正午晴空的太阳光 6500* (阴天正午时分约6500) 阴天的光线 6800-7000 * 高速电子闪光管 7000 来自灰蒙天空的光线 7500-8400 来自晴空蓝天的光线 10000-20000* 在水域上空的晴朗蓝天 20000-27000*
注:光源以 K (开尔文)为单位,(K数为高越偏蓝调)色温(Color Temperature),单位:开尔文[Kelvin]定义:当光源所发出的颜色与“黑体”在某一温度下辐射的颜色相同时,“黑体”的温度就称为该光源的色温。“黑体”的温度越高,光谱中蓝色的成份则越多,而红色的成份则越少。色温是衡量一种光源“有多么热”或者“有多么冷”的指标,也是表示一种光源“白得程度”、“黄得程度”或者“蓝得程度”的指标。 暖色<3300K;中间色3300至5000K;冷色>5000K。如:海洋、无云的天空、雪地阴影、晴天里的阴影、室内、雨天、阴天(色温在9000-20000K) 拍摄时色温的设置(对照表) 烛 焰 1500-1800* (日落前光色偏红,色温降至2200) 家用白灯2500-3000 60瓦的充气钨丝灯2800 100瓦的钨丝灯2950 1000瓦的钨丝灯3000(日出后40分钟光色较黄) 500瓦的投影灯2865 500瓦钨丝灯3175 3200K的泛光灯3200 琥珀闪光信号灯3200 R32反射镜泛光灯3200 锆制的浓弧光灯3200 反射镜泛光灯3400 暖色的白荧光灯3500 清晰闪光灯信号3800 冷色的白荧光灯4500 白昼的泛光灯4800
色品坐标
荧光灯生产中如何配粉供大家参考 为满足顾客对灯管的高光通、长寿命、色溶差、显色指数等参数的需要。所以有实力的制灯厂为了保证质量上高品质、己推行了单色粉自配各种色温灯管。或者单色粉的微调 。在生产中有时并不能得到理想的光电参数与制灯的工艺相关的有涂层的厚度及上下端厚簿差、灯内气体的种类及压力、汞的纯度、、、、、、等等。但假没工艺不变、对x、y值的调整<当燃是单色粉加入>有一个″最好"。在批量生产前测定粉浆是否符合要求。我称为"打点"。 通过打点就改变了以粉决定灯管的质量。色溶差、光电参数也能达到客户要求。把老粉、多余的粉充份利用、在市场上有更好的竞争力。 如何打点移动xy值呢? 1加红粉;色温降低x值增大、显色指数提高、光通量有所降低、y值变化很少、但也有点下降 2 加兰粉:色温升高、x值y值多减少<6500k粉基本相同值>显色指数略高、光通量降低。 3 加绿粉:原色温低于5000k色温增大、原色温高于5000k色温减少、光通量提高、显色指数降低。 4 混合粉点位在单色粉点位与原粉浆点位的莲线上。 5可根椐自己生产工艺、每2公斤粉的粉浆加入20克单色红粉计算降每克多少色温。加入20克兰粉计算每克升多少色温。加入20克绿粉计算上移多少。 红粉加大X值,绿粉加大Y值,兰粉同时缩小X、Y值,比较坐标点与中心点的位置差来调整就可以了 色品图 以不同位置的点表示各种色品的平面图。1931年由国际照明委员会(CIE)制定,故称CIE色品图。描述颜色品质的综合指标称为色品,色品用如下3个属性来描述: ①色调。色光中占优势的光的波长称主波长,由主波长的光决定的主观色觉称色调。 ②亮度。由色光的能量所决定的主观明亮程度。 ③饱和度。描述某颜色的组分中纯光谱色所占的比例,即颜色的纯度。 由单色光引起的光谱色认为是很纯的颜色,在视觉上称为高饱和度颜色。单色光中混有白光时纯度降低,相应地饱和度减小。 例如波长为650纳米的色光是很纯的红色,把一定量白光加入后,混合结果产生粉红色,加入的白光越多,混合色就越不纯,视觉上的饱和度就越小。 标注 附图为CIE色品图,图中x坐标是红原色的比例,y坐标是绿原色的比例,代表蓝原色的坐标z可由x+y+z=1推出。图中
晶知识扫盲系列6:色座标,色温与白平衡
液晶知识扫盲系列6:色座标,色温与白平衡 1,色座标,色温及白平衡的定义 (1)色座标(chromaticity coordinate):就是颜色的坐标。也叫表色系。 色坐标是色度学的重要内容之一,光源的色坐标测量是研究光源特性的重要方法之一,它具有广泛的使用意义。色坐标测量的基本原理是根据光源的光谱分布由色坐标的基本规定进行计算而得出的。 现在常用的颜色坐标,横轴为x ,纵轴为y 。有了色坐标,可以在色度图上确定一个点。这个点精确表示了发光颜色。即:色坐标精确表示了颜色。因为色坐标有两个数字,又不直观,所以大家喜欢用色温来大概表示照明光源的发光颜色。 (2)色温(color temperature): 是表示光源光色的尺寸,单位是开尔文。 光源的色温是通过对比它的色彩和理论的热黑体辐射体来确定的。热黑体辐射体与光源的色彩相匹配时的开尔文温度就是那个光源的色温,它直接和普朗克黑体辐射定律相联系。色温是按绝对黑体来定义的,光源的辐射在可见区和绝对黑体的辐射完全相同时,此时黑体的温度就称此光源的色温。 (3)白平衡(white balance):白平衡的基本概念是“不管在任何光源下,都能将白色物体还原为白色”,对在特定光源下拍摄时出现的偏色现象,通过加强对应的补色来进行补偿。白平衡是描述显示器中红、绿、蓝三基色混合生成后白色精确度的一项指标。白平衡是电视摄像领域一个非常重要的概念,通过它可以解决色彩还原和色调处理的一系列问题。 2,色座标,色温及白平衡的关系 如上所讲,色座标与色温是有对应关系的,色温可以由色座标计算出来。其中一个很直观的理解就是,色度图下上的某一点的颜色确定了,我们就可以由于坐标图确定了它的x轴及y 轴的点,在色度图的位置确定了,从而就可以确认它的色温了。 (1)色温在色度图中的位置如下图,从图中可以看出,色座标与色温是有一一对应的关系。 (2)通过计算软件计算色座对应色温的实例和他们的对应关系。(相关的计算公式及软件
LED色温图谱详解_1
---------------------------------------------------------------最新资料推荐------------------------------------------------------ LED色温图谱详解 LED 色温图谱详解 NOTE: 色温=实测色温-计算色温(根 据相对色温线) 结论: 1. 根据实际测试的色标可看出: 不在 色温线上面的色坐标点, 可以通过相对色温线的方式求出该点色温. 2. 向下延长各个相对色温线, 基本交汇在一点(X:0. 33 Y: 0. 20) . 依此点坐标: 2500K 相对色温线与X 轴的夹角约为30 度. 25000K 相对色温线与 2500K 相对色温线之间的夹角约为 90 度. 250000K 相对色温线与 2019K 相对色温线之间的夹角约为 100 度. 具体见上图所示. 3. 根据上图白光色坐标分布图与相对色温线 的关系, 现在许多分光参数表是根据色温方式划分各个 BIN 等级(色标分布图是参照早期日亚白光色标分布图制作) . 这样分当然具 有一定的好处。 4. 工厂色标分布图所对应的的色温范围为:4000K~16000K. 5. 采用白光计算机(T620) 测试出的色温值与根据相对色温线所计 算出的色温值有一定的差别, 机台测试出的色温值只能做一个参考值. 根据相对色温线所计算出的色温值与机台测试的色温值之间的 差别详见上表色温值. 相关色温 8000-4000K 的白光 LED 的 发射光谱和色品质特性摘要: 文章报告和分析了 8000K、 6400K、 5000K 和 4000K 四种色温 的白光 LED 的发射光谱、色品质和显色性等特性,它们与工作条 件密切相关。 1/ 22
每种颜色的光与波长的对应值
每种颜色的光与波长的对应值 紫光400~450 nm 蓝光450~480 nm 青光480~49 0 nm 蓝光绿490~500 nm 绿光500~560 nm 黄光绿560~58 0 nm 黄光580~595 nm 橙光595~605 nm 红光605~700 nm
根据光子能量公式:E=hυ 其中,h为普朗克常数,υ为光子频率 可见光的性质是由其频率决定的。 另外,在不同折射率的介质中,光的波长会改变而频率不变。
色温 色温(colo(u)r temperature)是表示光源光色的尺度,单位为K(开尔文)。色温在摄影、录象、出版等领域具有重要应用。光源的色温是通过对比它的色彩和理论的热黑体辐射体来确定的。热黑体辐射体与光源的色彩相匹配时的开尔文温度就是那个光源的色温,它直接和普朗克黑体辐射定律相联系。 一.概述 基本定义 色温是表示光源光谱质量最通用的指标。一般用Tc表示。色温是按绝对黑体来定义的,光源的辐射在可见区和绝对黑体的辐射完全相同时,此时黑体的温度就称此光源的色温。低色温光源的特征是能量分布中,红辐射相对说要多些,通常称为“暖光”;色温提高后,能量
分布中,蓝辐射的比例增加,通常称为“冷光”。一些常用光源的色温为:标准烛光为1930K (开尔文温度单位);钨丝灯为2760-2900K;荧光灯为3000K;闪光灯为3800K;中午阳光为5600K;电子闪光灯为6000K;蓝天为12000-18000K。 显示器指标 色温(ColorTemperature)是高档显示器一个性能指标。我们知道,光源发光时会产生一组光谱,用一个纯黑体产生出同样的光谱时所需要达到的某一温度,这个温度就是该光源的色温。15英寸以上数控显示器肯定带有色温调节功能,通过该功能(一般有9300K、6500K、5000K三个选择)可以使显示器的色彩能够满足高标准工作要求。高档产品中有些还支持色温线性调整功能。 光源颜色 光源的颜色常用色温这一概念来表示。光源发射光的颜色与黑体在某一温度下辐射光色相同时,黑体的温度称为该光源的色温。在黑体辐射中,随着温度不同,光的颜色各不相同,黑体呈现由红——橙红——黄——黄白——白——蓝白的渐变过程。某个光源所发射的光的颜色,看起来与黑体在某一个温度下所发射的光颜色相同时,黑体的这个温度称为该光源的色温。“黑体”的温度越高,光谱中蓝色的成份则越多,而红色的成份则越少。例如,白炽灯的光色是暖白色,其色温表示为2700K,而日光色荧光灯的色温表示方法则是6000K。 某些放电光源,它发射光的颜色与黑体在各种温度下所发射的光颜色都不完全相同。所以在这种情况下用“相关色温”的概念。光源所发射的光的颜色与黑体在某一温度下发射的光的颜色最接近时,黑体的温度就称为该光源的相关色温。
色温对应的颜色
什么是色温(CT)? 色温是度量颜色温度的标准,并不是度量灯的亮度。卤素灯的色温可以由2300K到7000K;HID灯的色温由4200K到超过10000K;灯的色温越高,它对雾和雨的穿透力越差。以下是不同色温的表现: 3000K 黄色光,强穿透力 4200K 白中带黄 5000K 光全白,欧规最高色温 6000K 光全白,略带蓝色;阳光下的白天 7000—8000K 白中明显带蓝 10000K以上蓝光,穿透力差超过6000K的灯泡普遍所见的毛病除了穿透力差。非大厂生产的灯泡色温下降有些半年就可以下降50%,10000K变5000K,白光变黄光.这点在装灯半年后把其中的一边换上一颗新灯泡,就明显的发现另外一边的灯泡变黄了,一般来说都不会满意这种品质的灯泡。 什么是流明(lm)? 流明是"光学亮度"的科学术语,是指一个物体的视觉亮度。在外行人的术语中,它通常指的是"亮度"。流明(Lumens)是氙气灯主要的技术指标,流明是国际光流量单位。所谓的流明简单来说,就是指蜡烛一烛光在一公尺以外的所显现出的亮度。例如,一个蜡烛产生12流明,一个60瓦的白炽灯产生830流明。数值越大,光就越亮。 开氏温标(K)? 是热力学温度单位,用于衡量输出光的发白程度。数值越大,灯光越白。如果达到5000k,光就开始变为白天的颜色,有点蓝色。 请仔细对比下图 通过本图可以看出
3000K的一般用来改装雾灯,俗称黄金光,大家都知道黄色光对雨雾穿透力极强,4300K相当于原车卤素灯,但要比原车光的多,目前市面上一般都是安装6000K--8000K色温灯比较多,6000K比较接近太阳光色温,10000K以上只是用来装饰爱车罢了,对照明没有多大帮助,看过以上内容,相信大家知道怎么选择灯泡来装饰自己的爱车啦。
色温所对及应的RGB颜色表
色温所对及应的RGB颜色表 在进行CG设计时,特别是对场景进行渲染时,常涉及到照明布光,有时需要跟据光源的色温来调整光源颜色的RGB值,有了此表,就可以很方便地跟据光源的色温值查询到其所对应的颜色的RGB值了。 1000 K 2deg 0.6499 0.3474 2.472e+06 1.0000 0.0337 0.0000 255 51 0 #ff3300 1000 K 10deg 0.6472 0.3506 2.525e+06 1.0000 0.0401 0.0000 255 56 0 #ff3800 1100 K 2deg 0.6361 0.3594 2.112e+07 1.0000 0.0592 0.0000 255 69 0 #ff4500 1100 K 10deg 0.6348 0.3612 2.162e+07 1.0000 0.0631 0.0000 255 71 0 #ff4700 1200 K 2deg 0.6226 0.3703 1.282e+08 1.0000 0.0846 0.0000 255 82 0 #ff5200 1200 K 10deg 0.6225 0.3710 1.314e+08 1.0000 0.0860 0.0000 255 83 0 #ff5300 1300 K 2deg 0.6095 0.3801 5.959e+08 1.0000 0.1096 0.0000 255 93 0 #ff5d00 1300 K 10deg 0.6104 0.3797 6.118e+08 1.0000 0.1085 0.0000 255 93 0 #ff5d00 1400 K 2deg 0.5966 0.3887 2.243e+09 1.0000 0.1341 0.0000 255 102 0 #ff6600 1400 K 10deg 0.5983 0.3874 2.306e+09 1.0000 0.1303 0.0000 255 101 0 #ff6500 1500 K 2deg 0.5841 0.3962 7.121e+09 1.0000 0.1578 0.0000 255 111 0 #ff6f00 1500 K 10deg 0.5864 0.3940 7.333e+09 1.0000 0.1515 0.0000 255 109 0 #ff6d00 1600 K 2deg 0.5720 0.4025 1.967e+10 1.0000 0.1806 0.0000 255 118 0 #ff7600 1600 K 10deg 0.5747 0.3996 2.028e+10 1.0000 0.1718 0.0000 255 115 0 #ff7300 1700 K 2deg 0.5601 0.4076 4.839e+10 1.0000 0.2025 0.0000 255 124 0 #ff7c00 1700 K 10deg 0.5632 0.4041 4.999e+10 1.0000 0.1912 0.0000 255 121 0 #ff7900 1800 K 2deg 0.5486 0.4118 1.081e+11 1.0000 0.2235 0.0000 255 130 0 #ff8200 1800 K 10deg 0.5519 0.4077 1.118e+11 1.0000 0.2097 0.0000 255 126 0 #ff7e00 1900 K 2deg 0.5375 0.4150 2.224e+11 1.0000 0.2434 0.0000 255 135 0 #ff8700 1900 K 10deg 0.5408 0.4104 2.305e+11 1.0000 0.2272 0.0000 255 131 0 #ff8300 2000 K 2deg 0.5267 0.4173 4.268e+11 1.0000 0.2647 0.0033 255 141 11 #ff8d0b 2000 K 10deg 0.5300 0.4123 4.431e+11 1.0000 0.2484 0.0061 255 137 18 #ff8912 2100 K 2deg 0.5162 0.4188 7.710e+11 1.0000 0.2889 0.0120 255 146 29 #ff921d 2100 K 10deg 0.5195 0.4134 8.018e+11 1.0000 0.2709 0.0153 255 142 33 #ff8e21 2200 K 2deg 0.5062 0.4196 1.322e+12 1.0000 0.3126 0.0219 255 152 41 #ff9829 2200 K 10deg 0.5093 0.4139 1.377e+12 1.0000 0.2930 0.0257 255 147 44 #ff932c 2300 K 2deg 0.4965 0.4198 2.166e+12 1.0000 0.3360 0.0331 255 157 51 #ff9d33 2300 K 10deg 0.4995 0.4138 2.260e+12 1.0000 0.3149 0.0373 255 152 54 #ff9836 2400 K 2deg 0.4872 0.4194 3.408e+12 1.0000 0.3589 0.0454 255 162 60 #ffa23c
颜色基础知识——CIE 1931色度坐标图
CIE 1931色度坐标介绍 1. 意义 图中的颜色,包括了自然所能得到的颜色。这是个二维平面空间图,由x-y
直角标系统构成的平面。为了适应人们习惯于在平面坐标系中讨论变量关系,而设计出来的。在设计出该图的过程中,经过许多数学上的变换和演算。此图的意义和作用,可以总结成两句话:(1)表示颜色视觉的基本规律。(2)表示颜色混合与分解的一般规律。 2. 坐标系——x ,y直角坐标系。 x——表示与红色有关的相对量值。 y——表示与绿色有关的相对量值。 z——表示与蓝色有关的相对量值。并且z=1-(x+y) 3. 形状与外形轮廓线 形状——舌形,有时候也称“舌形曲线”图。由舌形外围曲线和底部直线包围起来的闭合区域。舌形外围曲线——是全部可见光单色光颜色轨迹线,每一点代表某个波长单色光的颜色,波长从390nm到760nm。在曲线的旁边。标注了一些特征颜色点的对应波长。例如图中510nm——520nm——530nm等。底部直线——连接390nm点到760nm点构成的直线,此线称为紫红线。 4. 色彩 这是一个彩色图,区域内的色彩,包括了一切物理上能实现的颜色。很遗憾的是,很难得真正标准的这种资料,经常由于转印而失真。 5. 应用价值——颜色的定量表示。 用(x,y)的坐标值来表示颜色。白色应该包含在“颜色”这个概念范围内。 6. 若干个特征点的意义 (1)E点—等能白光点的坐标点 E点是以三种基色光,以相同的刺激光能量混合而成的。但三者的光通量并不相等。E点的CCT=5400K。 (2)A点—CIE规定一种标准白光光源的色度坐标点这是一种纯钨丝灯,色温值CCT=2856。 (3)B点—CIE规定的一种标准光源坐标点B点的CCT=4874K,代表直射日光。 (4)C点—CIE确认的一种标准日光光源坐标点(昼光)C点的CCT=6774K。