估值模型
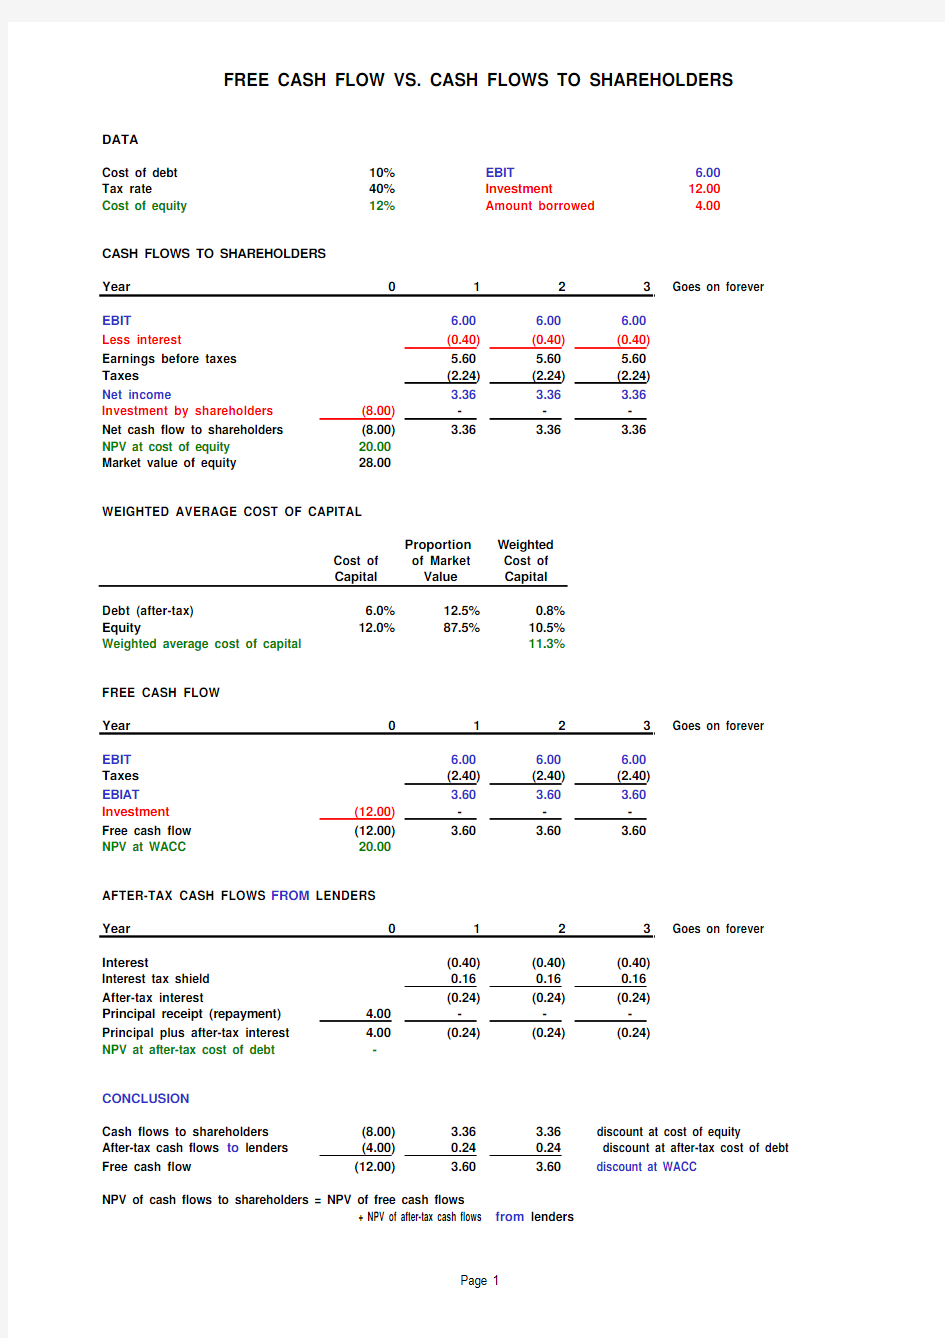
FREE CASH FLOW VS. CASH FLOWS TO SHAREHOLDERS
DATA
Cost of debt10%EBIT 6.00
Tax rate40%Investment12.00
Cost of equity12%Amount borrowed 4.00
CASH FLOWS TO SHAREHOLDERS
Year0123 Goes on forever
EBIT 6.00 6.00 6.00
Less interest(0.40)(0.40)(0.40)
Earnings before taxes 5.60 5.60 5.60
Taxes(2.24)(2.24)(2.24)
Net income 3.36 3.36 3.36
Investment by shareholders---
Net cash flow to shareholders 3.36 3.36 3.36
NPV at cost of equity20.00
Market value of equity28.00
WEIGHTED AVERAGE COST OF CAPITAL
Proportion Weighted
Cost of of Market Cost of
Capital Value Capital
Debt (after-tax) 6.0%12.5%0.8%
Equity12.0%87.5%10.5%
Weighted average cost of capital11.3%
FREE CASH FLOW
Year0123 Goes on forever EBIT 6.00 6.00 6.00
Taxes(2.40)(2.40)(2.40)
EBIAT 3.60 3.60 3.60
Investment(12.00)---
Free cash flow(12.00) 3.60 3.60 3.60
NPV at WACC20.00
AFTER-TAX CASH FLOWS FROM LENDERS
Year0123 Goes on forever Interest(0.40)(0.40)(0.40)
Interest tax shield0.160.160.16
After-tax interest(0.24)(0.24)(0.24)
Principal receipt (repayment) 4.00---
Principal plus after-tax interest 4.00(0.24)(0.24)(0.24)
NPV at after-tax cost of debt-
CONCLUSION
Cash flows to shareholders(8.00) 3.36 3.36 discount at cost of equity
After-tax cash flows to lenders(4.00)0.240.24 discount at after-tax cost of debt Free cash flow(12.00) 3.60 3.60 discount at WACC
NPV of cash flows to shareholders = NPV of free cash flows
+ NPV of after-tax cash flows from lenders
Page 1