图表作文句型

一图表作文和一般作文每多大的区别,只是把问题和现象用图表反映出来.要求你把图表看懂,并用文字叙述出来. 1. 熟悉各种图表的特点(line graph曲线图表示一种食物的上升或下降, bar chart比较不同事物在同一时期的上升或下降, pie chart表示各种事物所占的比例, table表示多种事物相互之间的关系)
图表作文不是简单的图表描写,要抓住图表所反映的问题讨论。
1. 借助于图表和指示里的要求
2. 看图表中哪些数字的前后变化最大。
3. 现把数据所反映的问题用一句话说出来
4. 把数据看成是说明问题的具体材料。
图表题文章写作逻辑结构:
Paragraph I:(1)描述图表:趋势描写;(2)描述图表:必要数据支持(细节性)。
Paragraph II:(1)提出自己理由和观点;(2)细节性分论点(支持自己观点)。
Paragraph III:(1)预测未来和提出解决方法;(2)总结全文和表达作者自己观点。
Example1 Changes in People's Diet
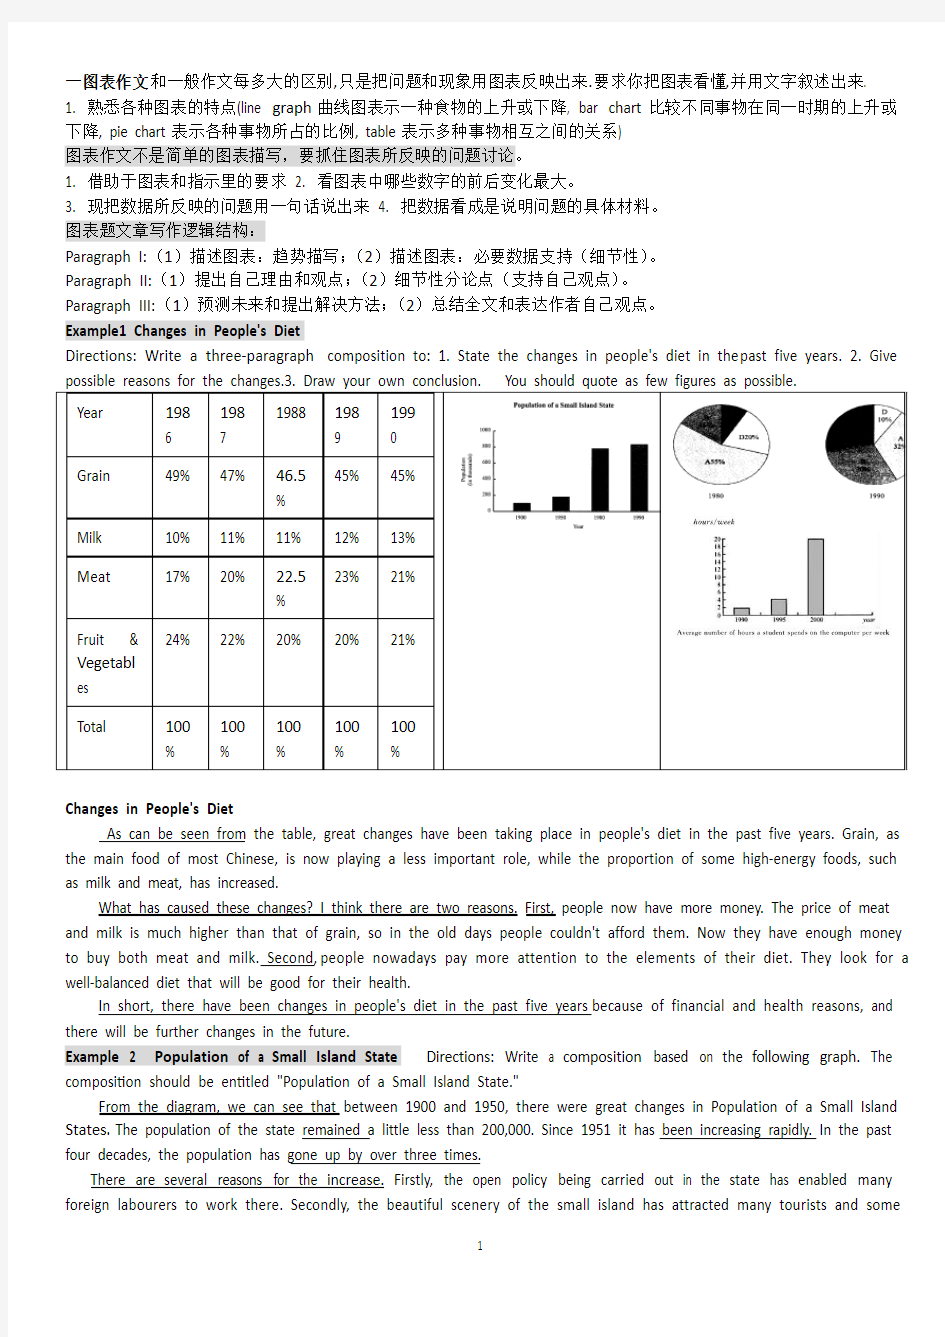
Directions: Write a three-paragraph composition to: 1. State the changes in people's diet in the past five years. 2. Give
Changes in People's Diet
As can be seen from the table, great changes have been taking place in people's diet in the past five years. Grain, as the main food of most Chinese, is now playing a less important role, while the proportion of some high-energy foods, such as milk and meat, has increased.
What has caused these changes? I think there are two reasons. First, people now have more money. The price of meat and milk is much higher than that of grain, so in the old days people couldn't afford them. Now they have enough money to buy both meat and milk. Second, people nowadays pay more attention to the elements of their diet. They look for a well-balanced diet that will be good for their health.
In short, there have been changes in people's diet in the past five years because of financial and health reasons, and there will be further changes in the future.
Example 2 Population of a Small Island State Directions: Write a composition based on the following graph. The composition should be entitled "Population of a Small Island State."
From the diagram, we can see that between 1900 and 1950, there were great changes in Population of a Small Island States. The population of the state remained a little less than 200,000. Since 1951 it has been increasing rapidly. In the past four decades, the population has gone up by over three times.
There are several reasons for the increase. Firstly, the open policy being carried out in the state has enabled many foreign labourers to work there. Secondly, the beautiful scenery of the small island has attracted many tourists and some
of them have been permitted to settle there. In addition, the government may not have realized the necessity of controlling population.
If this trend continues, it is no doubt that the small state will suffer from various kinds of problems caused by overpopulation, such as lack of land resources, food shortage and traffic congestion. Therefore, actions should be taken to control the increase of the population.
Example 3 Changes in College Students' Ways of Spending Summer Vacation
(1) state the changes briefly (2) give possible reasons for the changes(3) predict the trend of changes
From the two charts, we can see that in the past ten years the number of students who go travelling or do social investigation during summer vacation has increased greatly while that of those who stay at home has decreased a lot.
There are several reasons for the changes. Firstly, with the development of economy, many people have become rich. Students can get financial support from their parents for travelling. Secondly, tourism has greatly developed over the past ten years. Many new scenic spots have been built. In addition, the open policy has brought in from some other countries some harmful ideas on politics and thus aroused among college students some false opinions about China, so the government has been encouraging college students to do investigations on the rapid development in both urban and rural areas.
From the changes in the charts, we can predict that more and more college students will make their summer vacation interesting and meaningful by going to the outside world instead of staying at home.
Example 4 Student use of computer (写第一段)
1 According to the bar chart, there were great changes in the time students spend on computers in the past ten years. The time increased dramatically from
2 hours in 1990 to 4 in 1995 and then to 18 in 2000.// The figure increased twice in 1995 and nine times in 2000 compared with that in 1990.// In 1990, average students spent about 2 hours,while in 1995 the figures doubled; five years later, they spent nine times as much as time as that in 1990.
图表作文句型:
1 In 1999, it increased/rose/jumped/shot up from 5to 10 percent of the total/to 15 percent/ by 15 percent
2 By comparison with 1999, it decreased/dropped/fell ….
3 The figure/percentage/number/population has nearly/almost/more than doubled/tripled, compared with/as compared with/as against that of last year
4 It has dropped/increased about two and a half times/twice/six times, …
5 The number is twice/4 times/half as much as that of 1999.
常用词:
上升:increase,rise, ascend, soar, climb, go up, grow
下降:decrease, fall, descend, go down, decline, drop
程度副词:slightly, slowly, at a slow pace/rate, steadily, gradually (表示增加幅度不大)
Sharply, considerably, greatly, dramatically, steeply, substantially, surprisingly, alarmingly, rapidly, significantly, enormously, hugely, incredibly, by a large margin 增加幅度很大
起伏 1.…to go up and down/ wave/ fluctuate/ be unstable/ be in flexible …起伏不定
eg. The strike rate went up and down during the period from 1952 to 1967.
2.There be ups and downs …有起有伏eg. Between 1972 and 1979, there were several ups and downs in (某方面).
稳定 1.…to remain steady/level/unchanged …保持稳定,几乎不变
eg. The rate of …remained steady (fairly level/almost unchanged) during the four years from 1963 to 1967.
2.…to level off (vi.) eg. After a steady decline for a w hole decade, the …rate shows signs of leveling off.
成正比,反比1.…be in direct /(inverse) ratio(proportion) to/with 与…成正比/反比
eg. Male illustrations are in direct ratio to /with the advancement of grades, while female illustrations are in inverse ratio. 占百分之几,几分之几
1….to form/comprise/make up/constitute/ account for ….percent …占百分之…
eg. Women comprise more than 50% of the US.population.
eg. Females make up only 24% of the illustrations whereas males constitute 76%.
2.…to form/comprise/constitute a half/third/fourth of……占…的1/2,1/3,1/4
eg. Female illustrions form less than a fourth of the total.
3.…account for…percent 占百分之几eg. ……, accounting for approximately 20 percent of…
倍数 1.A be …times as much/many(adj) as B eg. The annual rainfall of Hunan is 5 time s as much as that of Sichuan.
2.A doubles/is half/triples B A是B的两倍,一半,三倍
eg. The annual rainfall of Jidda doubles that of Janta, but is only half the amount of rain Kuwait receives each year.
引用数据常用句型
the table/bar chart/pie/figures/statistics/
2.According to the table, there were great changes in …..
3. There was an increase/ a decrease from ….to…
4. The figure has nearly doubled, compared with that of last year.
5. It increased almost two and a half times, compared with….
6. It account for …..percentage of the total.
7.It has increased by three times as compared with that of ……同……相比,增长了3倍。
8.There are a lot of similarities/differences between…and …与..之间有许多相似(不同)之处
9.A has the highest sales figure in the three departments, followed by B and C.
10.The rise lasted for two weeks and then began to level off 平稳in August.
11.from this year on, there was a gradual declined reduction in the……, reaching a figure of……
12.The table shows the changes in the number of……over the period from……to……
13) The picture shows…14) The diagram represents/ indicates…15) The information represented in the graph indicates…16) As can be seen from the chart, …17) As is shown in the bar graph, there were…18) From the diagram it can be seen clearly that…19) From these f igures one can easily see that…20) According to the graph given above, we can see that…21) There was a great/slight increase/rise. 22)There has been a sudden/slow/rapid fall/drop…23) Take the above chart as an example
二写作常用句型
表原因
1. A number of factors are accountable for this situation.
2. A large number of factors might contribute to/lead to/account for/the issue.
3.This answer to this question involves many factors.
4.The factors that contribute to this situation include …
5.One of the most common factors is that…another contributing factor is that…perhaps the primary factor is that …
举例 1. A good case in point is that… 2 As an illustration, we may take … as an example 3.…is often cited as an example. 熟练掌握以下连接词与连接语1.表明事件发生的时间顺序:then, first, at once, next, after that, previously, while, when, the following day, etc. 2.表明文章的组织结构: 1)Listing列举: firstly, in the first place, secondly, thirdly, my next point is, last/finally, etc. 2)Illustrating举例: for example/ for instance, to illustrate, an example/ instance of this is, let’s take….., take…. for example, etc. 3)Re-stating重复说明: in other words, that is to say, to put it another way, let me put it this way, or rather, namely, etc. 4)Summarizing总结: to sum up, in short, it amounts to this, what I have been saying is this, etc. 7)Emphasizing强调: it is worth noting, I would like to direct your attention to, let us consider, we must now turn to, I shall begin by, etc.
3.表明作者的观点、态度1)Introducing( or emphasizing) further ev idence进一步说明: moreover, furthermore, in addition, what’s more, as well, etc. 2)Cause原因: because (of), since, owing to, on account of, due to, as a result of, etc. 3)Effect结果: as a result, hence, therefore, consequently, thus, so, etc. 4)Contrasting比较: in / by contrast, on the contrary, on the other hand, nevertheless, whereas, while, yet, however, but, etc. 5)Comparison 对照: in like manner, likewise, in the same way, similarly, in comparison with, etc. 6)Purpose目的: to this end, for this purpose, with this in mind, in order to, so that, etc. 7)Intensification : indeed, in fact, in any event / case, at no time, to tell the truth, etc
三起承转合连接词和连接句(再简单的分层次,也要用过渡词语,增加语言亮点)
起:启动观点引出话题
单词:first, firstly, now, recently, lately, nowadays, currently
短语:at first, first of all, in the first place, first and foremost, in the beginning, to begin with, at present, for one thing, on the one hand, generally speaking
句型: nowadays, there is a growing c oncern over the issue of …
Recently, the issue of …has been brought to public attention.
When it comes to… people’s notions may vary from one to another.
When asked about…, different people will hold different opinions.
With the development of …, the problems of… has become increasingly serious.
Nowadays …plays an increasingly important role in our everyday life.
承:承上启下
单词:second, secondly, next, besides, furthermore, moreover, likewise, similarly
短语:in the second place, in addition, for another, on the ot her hand, what’s more, for example, for instance, in the same manner, in particular, more importantly, for this purpose, for this reason, to be specific, to be honest, equally importantly, as a matter of fact, in other words
句型:to understand the point of …, it is necessary to discuss/analyze…
A close study of …will probably make this point clear.
Some people hole the view that …while other people argue that ,,,
转:语义转折,反面论述
单词:but however, nevertheless, while, whereas, unlike, conversely, otherwise, despite, though
短语:on the contrary, in spite of, instead of, by contrast
句型:Rather than….
Some other people have expressed opposite opinion.
合:合并总结,归纳全文
单词:finally, last, lastly, hence, therefore, consequently, obviously, accordingly
短语:in short, in brief, in a word, to sum up, briefly speaking, on the whole, in general, generally speaking, in summary, in conclusion, as a consequence, in my opinion, as far as I am concerned…
句型:on the basis of analyses above, we may confidently come to a conclusion that…
All th e evidence supports a sound conclusion that…
From what has been discussed above, we may safely concluded that …
Judging from all the evidence offered we may arrive at a conclusion that...
There is certain truth is both arguments, but I believe the advanta ges of …outweigh its disadvantages.
It is high time we try every means to put an end to …
It is obvious that effective measures must be immediately taken to solve the problem.
四句式变换
1. 适当用被动代替主动,这样能更客观的反映事实,句子开头不要总是用we / I (比如写结尾时不用we should pay attention to而用Attention should be paid to. ) 2004年六月六级作文的最后一段:It is, therefore, high time that some applicable approaches were implemented by the service industry like that. Thus,its competitive edge will be sharpened effectively.
2. 善于使用插入语,比如说把副词、连接词等,作插入语放在中间,一般放在主语、动词或者助动词后,两边分别加上逗号。如however / therefore /for example/I believe做插入语放在中间,一般放在动词,助动词后,两边分别加上逗号。比如说:Other individuals, however, take the attitude that…
3.一定要学会换词,换形象,具体的代替太宽泛的。(考试中一般不要出现good, bad , many, thing, think, people, opinion等等)比如上面例子中,applicable代替proper; approaches代替ways; implement代替carry out; sharpen one's competitive edge代替enhance one's competitiveness(提高某物竞争力)
4. 单词要有难度,尽量把简单的替换为复杂的书面语如:main—primary, essential, crucial, indispensable, fundamental
5. 短语和词组也是写作的亮点,使作文有书面语味道6特殊难句倒装句/强调句/虚拟句
英语图表作文常用句型
1 起伏不定go up and down / fluctuate/ be unstable/ be in flexible 2 The first point to note is the huge increase in the number of 需要注意的第一点就是…的急剧增 长 3 The statistics show that 这些数据表明 4 占百分之几 Form/comprise/make up/constitute/ account for ….percent 5 This graph describes the trend of 该图描述了…的趋势
6 The statistics lead us to the conclusion that 由这些数据,我们可以做出如下结论 8 增加:Increase / raise / rise / go up/ soar/ ascend/ mount/ climb 9 减少:Decrease / go down / drop / fall/ reduce/ descend/ shrink /decline/sink 10 稳定:Remain stable / stabilize / level off/ remain unchanged 11 It can be seen from the table that 由表格我们可以看出 12 The table shows the changes in the number of… over the period from…to… 该表格展示了从…到…数据的变化
IELTS套句式写作大全
IELTS套句式写作大全 第一部分:TASK1图表写作套句精选 1.the table shows the changes in the number of...over the period from...to... 该表格描述了在...年之...年间...数量的变化。 2.the bar chart illustrates that... 该柱状图展示了... 3.the graph provides some interesting data regarding... 该图为我们提供了有关...有趣数据。 4.the diagram shows (that)... 该图向我们展示了... 5.the pie graph depicts (that).... 该圆形图揭示了... 6.this is a cure graph which describes the trend of... 这个曲线图描述了...的趋势。 7.the figures/statistics show (that)... 数据(字)表明... 8.the tree diagram reveals how... 该树型图向我们揭示了如何... 9.the data/statistics show (that)... 该数据(字)可以这样理解... 10.the data/statistics/figures lead us to the conclusion that... 这些数据资料令我们得出结论... 11.as is shown/demonstrated/exhibited in the diagram/graph/chart/table... 如图所示... 12.according to the chart/figures... 根据这些表(数字)... 13.as is shown in the table... 如表格所示... 14.as can be seen from the diagram,great changes have taken place in... 从图中可以看出,...发生了巨大变化。 15.from the table/chart/diagram/figure,we can see clearly that...or it is clear/apparent from the chart that... 从图表我们可以很清楚(明显)看到... 16.this is a graph which illustrates... 这个图表向我们展示了... 17.this table shows the changing proportion of a & b from...to... 该表格描述了...年到...年间a与b的比例关系。 18.the graph,presented in a pie chart, shows the general trend in... 该图以圆形图形式描述了...总的趋势。 19.this is a column chart showing... 这是个柱型图,描述了... 20.as can be seen from the graph,the two curves show the flutuation of... 如图所示,两条曲线描述了...的波动情况。 21.over the period from...to...the...remained level. 在...至...期间,...基本不变。 22.in the year between...and... 在...年到...期间... 23.in the 3 years spanning from 1995 through 1998... 1995年至1998三年里... 24.from then on/from this time onwards... 从那时起... 25.the number of...remained steady/stable from (month/year) to (month/year). ...月(年)至...月(年)...的数量基本不变。 26.the number sharply went up to... 数字急剧上升至...
新东方英语六级作文万能模板和常用句型
英语六级作文万能模板和常用句型 段首句 1. 关于……人们有不同的观点。一些人认为…… There are different opinions among people as to ____ .Some people suggest that ____. 2. 俗话说(常言道)……,它是我们前辈的经历,但是,即使在今天,它在许多场合仍然适用。 There is an old saying______. It"s the experience of our forefathers,however,it is correct in many cases even today. 3. 现在,……,它们给我们的日常生活带来了许多危害。首先,……;其次,……。更为糟糕的是……。 Today, ____, which have brought a lot of harms in our daily life. First, ____ Second,____. What makes things worse is that______. 4. 现在,……很普遍,许多人喜欢……,因为……,另外(而且)……。
Nowadays,it is common to ______. Many people like ______ because ______. Besides,______. 5. 任何事物都是有两面性,……也不例外。它既有有利的一面,也有不利的一面。 Everything has two sides and ______ is not an exception,it has both advantages and disadvantages. 6. 关于……人们的观点各不相同,一些人认为(说)……,在他们看来,…… People’s opinions about ______ vary from person to person. Some people say that them,_____. 7. 人类正面临着一个严重的问题……,这个问题变得越来越严重。 Man is now facing a big problem ______ which is becoming more and more serious. 8. ……已成为人的关注的热门话题,特别是在年青人当中,将引发激烈的辩论。 ______ has become a hot topic among people,especially among the young
英语图表常用句型词组
英语图表常用句型词组. 英语图表作文写作常识50例 一、图表作文写作常识 1、图形种类及概述法: 泛指一份数据图表:a data graph/chart/diagram/illustration/table 饼图:pie chart 直方图或柱形图:bar chart / histogram 趋势曲线图:line chart / curve diagram 表格图:table
流程图或过程图:flow chart / sequence diagram 程序图:processing/procedures diagram 2、常用的描述用法 The table/chart diagram/graph shows (that) According to the table/chart diagram/graph As (is) shown in the table/chart diagram/graph As can be seen from the table/chart/diagram/graph/figures,figures/statistics shows (that)…… It can be seen from the figures/statistics We can see from the figures/statistics It is clear from the figures/statistics It is apparent from the figures/statistics table/chart/diagram/graph figures (that) …… table/chart/diagram/graph shows/describes/illustrates
图表作文写作句型汇总
雅思基础班图表作文期末汇总卷 Part One 图表作文各部分句型总结: 开头段句型总结: 1. This is a diagram/ chart /figure which shows how people obtain water in the wild in order to survive. 2. This is a chart which shows the trend of oil supply and dema nd. 3. This is a colu mn chart show ing … 4. The diagram illustrates /describes/ depicts the cha nges in nu mber of male teachers from 1998 to 1999 5. The bar chart illustrates the nu mber of overseas stude nts from five develop ing coun tries. 6. The graph, prese nted in a pie form, shows the gen eral trend in … 基本句型: shows /show nu mber 定语从句 betwee n and . 过去分词 + over a spa n of years/ mon ths 现在分词 in the year and . (修饰语/定语) procedure 等 类似句型: The chart + is/are + the proporti on of + A/B + from to . Diagram reflects /reflect average in come Graph states /state sales volume bar chart illustrates/illustrate perce ntages table displays /display expe nse two pie charts compares /compare in come A and B reveals /reveal 等 cha nges/ freque ncy
考研英语图表类作文常用词汇及句型
考研英语图表类作文常用词汇及句型 2015-09-22屠屠英语 1、主章开头 图表类型:table、chart、diagram、graph、column chart、pie graph 描述:show、describe、illustrate、can be seen from、clear、apparent、reveal、represent 内容:figure、statistic、number、percentage、proportion 2、表示数据变化的单词或词组 rapid/rapidly 迅速的,飞快的,险峻的dramatic/dramatically 戏剧性的,生动的 significant/significantly 有意义的,重大的,重要的sharp/sharply 锐利的,明显的,急剧的steep/steeply 急剧升降的steady/steadily 稳固的,坚定不移的 gradual/gradually 渐进的,逐渐的 slow/slowly 缓慢的,不活跃的 slight/slightly 轻微的、略微地stable/stably 稳定的 3、图表中的数据(Data)具体表达法 数据(Data)在某一个时间段固定不变:fixed in time 在一系列的时间段中转变:changes over time 持续变化的data在不同情况下: 增加:increase / raise / rise / go up …… 减少:decrease / grow down / drop / fall …… 波动:fluctuate / rebound / undulate / wave …… 稳定:remain stable / stabilize / level off …… 最常用的两种表达法:动词+副词形式(Verb+Adverb form)形容词+名词形式(Adjective+Noun form) 4、其它在描述中的常用到的词 significant changes 图中一些较大变化noticeable trend 明显趋势during the same period 在同一时期 grow/grew 增长 distribute 分布,区别unequally 不相等地in the case of adv. 在……的情况下 in terms of / in respect of / regarding 在……方面 in contrast 相反,大不相同
英语漫画图表作文常用句型
英语作文漫画图表常用句型 1.The cartoon/picture briefs/depicts/shows... 例句:The cartoon briefs the history of commercial fishing in the 20th cent ury. 2.In the picture, ... 例句:In the picture, an American girl looks so pleased in the richly decora ted Chinese national costumes. 3.Looking at the picture, ... 例句:Looking at the picture, many people cannot help laughing. ... 4....。This is what the picture indicates. 例句:It is not unusual for Chinese children to get money from their paren ts, grandparents or relatives during the Spring Festival. ... This is what th e picture indicates. 5.The two pictures here illustrate... 例句:The two pictures here illustrate how a flower in a greenhouse is des troyed when exposed to a storm. 6.In the first picture, .... While in the second one, ... 例句:In the first picture, a lonely small boat, in spite of the good catch, d oes not disturb the fishes that are swimming leisurely. While in the secon d one, the sea is over-crowded with fishing boats, and a lonely fish, desp erately trying to escape, finds no place to hide. 7.As depicted in the picture/As we can see in the picture/As can been se en from the picture/As is shown by the drawing, ... 例句:As can be seen from the picture, the car breaks stops on the way a nd cannot move any further.
图表类英语四级作文常用句型
图表类英语四级作文常用句型 开篇句式 1)According to the figures given in the table,+ 主题句(the world population is increasing rapidly. 2)The table(pie chart, line graph, bar graph) shows( indicates, illustrates, makes it clear) that +主题句(One’s income is closely linked to one’s age and education) 3) It can be seen from (It is clear from, It is evident from, It is illustrated from the table that + 主题句(the better one is educated , the higher his income is) 4) As the bar chart shows, the number of people below poverty line decreased dramatically during the years of 1978 to 1998. 图表式作文模板 写作模板——图表式作文 It is obvious in the graphic/table that the rate/number/amount of Y has undergone dramatic changes. It has gone up/grown/fallen/dropped considerably in recent years (as X varies). At the point of X1, Y reaches its peak value of …(多少). What is the reason for this change? Mainly there are … (多少)reasons behind the situation reflected in the graphic/table. First of all, …(第一个原因). More importantly, …(第二个原因). Most important of all, …(第三个原因). From the above discussions, we have enough reason to predict what will happen in the near future. The trend described in the graphic/table will continue for quite a long time (if necessary measures are not taken括号里的使用于那些不太好的变化趋势). 1.the table sho ws the changes in the number of……over the period from……to…… 该表格描述了在……年之……年间……数量的变化。 2.the bar chart illustrates that…… 该柱状图展示了…… 3.the graph provides some interesting data regarding…… 该图为我们提供了有关……有趣数据。 4.the diagram shows (that)…… 该图向我们展示了…… 5.the pie graph depicts (that)…… 该圆形图揭示了…… 6.this is a cure graph which describes the trend of……
雅思A类图表作文常用句型
2 The first point to note is the huge increase in the number of 需要注意的第一点就是…的急剧增长 3 The statistics show that 这些数据表明 4 占百分之几Form/comprise/make up/constitute/ account for ….percen t 5 This cure graph describes the trend of 该曲线图描述了…的趋势 6 The statistics lead us to the conclusion that 由这些数据,我们可以做出如下结论 7 As can be seen from the line graph, 由线状图我们可以看出 8 增加:Increase / raise / rise / go up/ soar/ ascend/ mount/ climb 9 减少:Decrease / grow down / drop / fall/ reduce/ descend/ shrink to/decline 10 稳定:Remain stable / stabilize / level off/ remain unchanged 11 It can be seen from the table that 由表格我们可以看出 12 The table shows the changes in the number of… over the period from…to…该表格展示了从…到…数据的变化 13 The table provides some data of 该表格提供了有关…的数据 14 As can be seen clearly from the table, 从表格中我们可以清楚地看出, 15 As can be seen from the table, great changes have taken place in... 从表格中可以看出,...发生了巨大变化 16 This table illustrates the changing proportion of A and B from...to... 该表格描述了...年到...年间a与b的比例关系 17 急剧地sharply, steeply, dramatically, drastically, suddenly 18 显著地,considerably, significantly, noticeably, remarkably, rapidly 19 稳步地, 逐渐地steadily, moderately, gradually, smoothly 20 轻微地, 缓慢地slightly, slowly, mildly, moderately 21 The following diagram shows the structure of...... 以下的图展示了...的结构 22 The picture illustrates...... 该图展示了... 23 It mainly consists of following steps. 它主要包括以下步骤 24 The whole procedure can be divided into...stages. 整个的过程可以分为...步 25 The first step is to 第一步是...
考研英语图表作文写作方法和模板
图表作文(一) 第一节图表作文的类型 图表作文可分为两大类:表作文和图作文。 表作文 表格(Table)可以使大量数据系统化,便于阅读、比较。表格常由标题(Title)、表头(Boxhead)(表格的第一行)、侧目(Stub)(表格左边的第一列)和主体(Body)部分(表格的其余部分)等部分组成。如下表: 用表格表达的信息具体准确,而且表格中的各项均按一定规律排列。阅读表格时要注意找出表格中各个项目的相互关系,表格中各个项目的变化规律。例如,上面的表格中的数字说明,和1978年相比,1983年大学入学的人数在增加,而小学的入学人数在减少。搞清楚这些变化规律也就读懂了表格的内容。 图作文 图作文又可分为三种:圆形图作文、曲线图作文和条状图作文。 (1) 圆形图作文 圆形图(Pie chart)也称为饼状图或圆面分割图。圆形图因为比较形象和直观,各部分空间大小差别容易分辨,所以常用来表示总量和各分量之间的百分比关系。整个圆表示总量,楔形块表示分量。有时圆形图还有数值表,两者结合可把各分量表示得更准确、清楚。例如:This is a pie chart of the average weekly expenditure of a family in Great Britain. As can be see from the chart, the main expenditure of an average British family is spent on food, which accounts for 25% of its total expenditure. The next two significant expending items are transport and housing, which are 15% and 12% respectively. If we take into account clothing and footwear, which makes up 10%, the four essentials of life, that is, food, transport, housing, and clothing and footwear, amount to 62% of the total expenditure. (2) 曲线图作文 曲线图(Line graph)也称为线性图或坐标图。曲线图最适合表示两个变量之间关系的发展过程和趋势。一般来说,曲线所呈现的形状比某一点所代表的变量的值更有意义。曲线图有横轴和纵轴。一般先看横轴所代表的数量或时间等,然后再看纵轴所显示的意义。同时必须找出线条所反映的最高或最低的变化。例如: 这个曲线图的横轴代表1990年的不同的月份,纵轴代表交通事故的数量。从交通事故曲线图上可知,前八个月的交通事故的数量有升有降。曲线图在八月份升到了最高点(39),此后一直呈下降的趋势,十二月份降到了最低点(16)。可见,1990年的交通事故的数量总体上呈下降的趋势。 (3) 条形图作文 条形图(Bar graph)也称为立柱图或圆柱图。条形图由宽度相同但长度不同的条块代表不同的量。当要比较几个项目或量时,常用不同颜色来区分。条形图主要用来表示:1)同一项目在不同时间的量;2)同一时间不同项目的量。阅读条形图时,要先看图例,再看横轴、纵横各代表什么量,每一个刻度所代表的值是多少,最后找出图中各长条所表示的数据及各长条间的相互关系。例如: 左边的条形图的横轴代表时间,纵轴代表期望寿命(Life Expectancy),这一条形图想要体现的是同一项目(期望寿命)在不同时间的量。右边的条形图的横轴也是代表时间,纵轴是代表婴儿的死亡率(Infant Mortality),这一条形图想要体现的也是同一项目(婴儿的死亡率)在不同时间的量。左边的条形图表明1990年的人均期望寿命比1960年的人均期望寿命长20岁,而1990年的婴儿死亡率比1960年的婴儿死亡率下降了50%。
英语六级图表作文常用句型总结
英语六级图表作文常用句型总结 为了帮助考生们更好地复习六级考试, 网为各位考生整理了英语六级图表作文常用句型,供考生们参考使用。 以下是图表作文常用的表达法: 1. According to the figures shown in the table/graph we can see/conclude that... 例句:According to the figures shown in the table, we can see that great changes have been taking place in people's diet over the period from 1988 to 1998. 2. We can see/We have noted/It can be seen from the table/chart/graph that... 例句:We have noted from the graph that there is a wide gap between the top ten universities both of China and of the world. 3. The graph/table/chart shows/indicates/reveals/points out that... 例句:The chart reveals that the number of road accidents is spiraling upward every year as more and more highways are constructed all over China. 4. As is shown/can be seen in the chart/graph/diagram
英语作文万能模板及万能句型汇总
中考英语作文万能模板及万能句型汇总 作文万能模板 一、阐述主题题型 要求从一句话或一个主题出发,按照提纲的要求进行论述. 1.阐述名言或主题所蕴涵的意义.2.分析并举例使其更充实. 二、解决方法题型 要求考生列举出解决问题的多种途径 1.问题现状2.怎样解决(解决方案的优缺点) In recent days,we have to face a problem-----A,which is becoming more and more serious. First,------------(说明A的现状).Second,---------------(举例进一步说明现状)Confronted with A,we should take a series of effective measures to cope with the situation. For one thing,---------------(解决方法一)。For another -------------(解决方法二)。Finally,--------------(解决方法三)。 Personally,I believe that -------------(我的解决方法)。Consequently,I’m confident that a bright future isawaiting us because --------------(带来的好处)。 三、说明利弊题型 这种题型往往要求先说明一下现状,再对比事物本身的利弊,有时也会单从一个角度(利或弊)出发,最后往往要求考生表明自己的态度(或对事物前景提出预测) 1.说明事物现状2.事物本身的优缺点(或一方面)3.你对现状(或前景)的看法Nowadays many people prefer A because it has a significant role in our daily life. Generally,its advantages can be seen as follows. First ----------------(A的优点之一)。Besides -------------------(A的优点之二)。 But every coin has two sides. The negative aspects are also apparent. One of the important disadvantages is that ----------------(A的第一个缺点).To make matters worse,------------------(A的第二个缺点). Through the above analysis,I believe that the positive aspects overweigh the negative ones. Therefore,I would like to ---------------(我的看法).(From the comparison between these positive and negative effects of A,we should take it reasonably and do it according to the circumstances we are in. Only by this way,---------------(对前景的预测).)
图表作文常用句型
图表作文常用句型 ●表示“说明”的常用句式 在说明图表的时候,要使用下列表示“说明”的常用句式,它们可以帮助读者弄清楚所引信息的出处,有效地将你要说的话带出来。 1.As we can see from the chart/graph / table/diagram,…从图表中可以看出…… 2.The chart/graph / table/diagram shows/displays that,…如图所示…… 3.As can be shown in/According to the chart/graph / table/diagram,…如图所示……4.The figures/statistics in the chart reflect/show/reveal that… 图表中的数据表明…… 5.The chart/graph/table/diagram illustrates/describes…图表描述了…… 6.It is clear/apparent from the chart/graph / table/diagram that… 从图表我们可以清楚地看到…… ●表示“数据”的常用句式 1.…had the largest percentage/proportion of… ……在……方面具有很大的百分比。2.…account (s) for/take (s) up 10%.……占有10%。 3.Compared with A, B has a higher percentage. 与A相比,B有更高的比例。 4.On the top of the list is…, which accounts for 60%.占比重最高的是……,占60%。 5.At the b ottom is…, which takes up 20%.占最低比重的是……,占20%。 6.A is second to B. A仅次于B。 7.A is ranked/rated first, followed by B at 30%and C at 25%. A占最高比重,紧随其后的是占30%的B和占25%的C。 ●表示“数据变化”的常用句式 在描述图表的过程中,考生有必要对图表的数据进行描述,因此,掌握相应地表示变化的句式也是相当重要的。 a.表示增加、减少和波动的常用结构 1.The number of (private cars) increased/rose suddenly/rapidly/dramatically/substantially /considerably/sharply/steeply from…to…从……到……期间,(私家车)的数量有了急剧的增长。 2.There was a sudden/rapid/dramatic/substantial/considerable/sharp/steep increase/rise in the number of (pr ivate cars) from…to…从……到……期间,(私家车)的数量有了急剧的增长。 3.There was a boom in the number of (private cars) from…to… 从……到……期间,(私家车)的数量有了急剧的增长。 4.The number of (private cars) climbed/jumped/rose suddenly/went sharply up/soared to…in…在……(时间),(私家车)的数量猛增到……(辆)。 5.There was an evident/apparent/obvious increase in…from…to….从……到……期间,在……方面有明显的增长。 6.The number of (private cars) increased/rose steadily/gradually from…to…从……到……期间,(私家车)的数量有了稳定持续的增长。 7.There was a steady/gradual increase/rise in the number of (private cars) from…to… 从……到……期间,(私家车)的数量有了稳定持续的增长。 8.There was a slight/slow increase/rise in the number of (private cars) from…to…从……到……期间,’ (私家车)的数量有了稍微/缓慢的增长。 9.The number of (private cars)increased/rose slightly/slowly from…to… 从……到……期间,(私家车)的数量有了稍微/缓慢的增长。 10.The number of (private cars) decreased/fell/dropped suddenly/rapidly/dramatically/
图表式作文写作模板
图表式作文 It is obvious in the graph/table that the rate/number/amount of Y has undergone dramatic changes. It has gone up/grown/fallen/dropped considerably in recent years (as X varies). At the point of (接近)X1, Y reaches its peak value of …(多少). Wh at is the reason for this change? Mainly there are … (多少) reasons behind the situation reflected in the graphic/table. First of all, …(第一个原因). More importantly, …(第二个原因). Most important of all, …(第三个原因). From the above discussions, we have enough reason to predict what will happen in the near future. The trend described in the graph/table will continue for quite a long time (if necessary measures are not taken括号里的使用于那些不太好的变化趋势). (1)常用的开篇句型(即概述图表内容时常用的表达法)①According to the table/pie chart/line graph/bar graph, we can see/conclude that … 根据该表/图,我们可知…… ②The table/graph reveals (shows/indicates/illustrates/ represents/points out)
图表作文常用句型
图表作文常用句型 1. 在说明示意图、曲线图、表格时,要使用下列表示“说明”的句子结构,它们可以帮助读者弄清楚所引信息的出处,有效地将你要说的话带出来。 The table/chart diagram graph shows (that)... The figures statistics show (that)... The diagram shows describes illustrates how... According to the As (is) shown in the As can be seen from the table/chart,diagram, graph,figures, ... It can be seen from the We can see from the It is clear apparent from the table/chart diagram graph figures (that)... 除了上述动词show, describe和illustrate以外,常用在图表报告导言部分中表示说明的动词 还有:display, exhibit, indicate, reflect, represent, reveal, unfold etc. 在图表报告的导言部分,考生经常会用到表示“说明”的句子结构,有效使用下列结构,可 The table/chart diagram graph shows (that)... 其中动词show, describe, display, exhibit, indicate, illustrate, reflect, represent, reveal, summarize, unfold; ②用“it” It can be seen from the table/chart graph diagram that... It is apparent clear obvious evident from the table graph figure that 这种结构在英语中常用来表示一个事实,语 We can see conclude find from the table/chart diagram graph figure that... ④用关系代词“as As (is) shown in the As can be seen from the chart graph diagram table that... 使用这一结构可以 2 ①在数据统计时,表示“有”“占”“是”“适到”等意义时,常用的动词和结构有 have/be/reach/hit/etc. take up/account for/peak at/bottom at etc. Examples are as follows: Australia and UK both had 10%. 澳大利亚和英国都占10% The Chinese had the largest percentage of market share. 中国人所占市场份额最大。Altogether 50% of the candidates were from the New Oriental School. 总共有百分之五十的考