2012美联储资产负债表
FEDERAL RESERVE statistical release
H.4.1
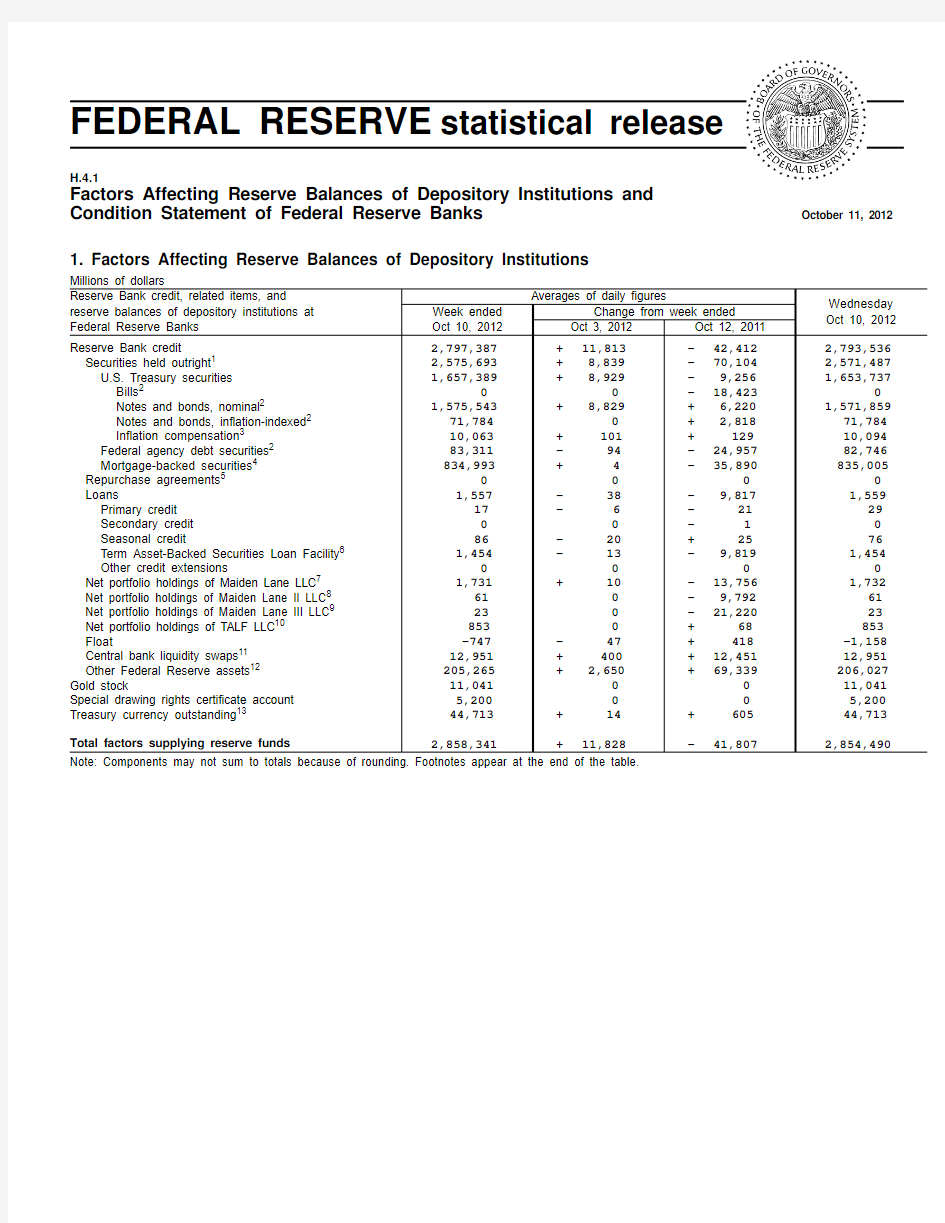
Factors Affecting Reserve Balances of Depository Institutions and Condition Statement of Federal Reserve Banks
October 11, 2012
1. Factors Affecting Reserve Balances of Depository Institutions
Millions of dollars
Averages of daily figures
Wednesday Oct 10, 2012Week ended Oct 10, 2012Change from week ended Oct 3, 2012Oct 12, 2011
Reserve Bank credit, related items, and
reserve balances of depository institutions at Federal Reserve Banks
Reserve Bank credit
2,797,387+ 11,813- 42,412 2,793,536Securities held outright 1
2,575,693+ 8,839- 70,104 2,571,487U.S. Treasury securities 1,657,389+ 8,929- 9,256 1,653,737Bills 2
0 0- 18,423 0Notes and bonds, nominal 2
1,575,543+ 8,829+ 6,220 1,571,859Notes and bonds, inflation-indexed 2 71,784 0+ 2,818 71,784Inflation compensation 3
10,063+ 101+ 129 10,094Federal agency debt securities 2 83,311- 94- 24,957 82,746Mortgage-backed securities 4 834,993+ 4- 35,890 835,005Repurchase agreements 5 0 0 0 0Loans
1,557- 38- 9,817 1,559Primary credit 17- 6- 21 29Secondary credit 0 0- 1 0Seasonal credit
86- 20+ 25 76Term Asset-Backed Securities Loan Facility 6 1,454- 13- 9,819 1,454Other credit extensions
0 0 0 0Net portfolio holdings of Maiden Lane LLC 7 1,731+ 10- 13,756 1,732Net portfolio holdings of Maiden Lane II LLC 8 61 0- 9,792 61Net portfolio holdings of Maiden Lane III LLC 9 23 0- 21,220 23Net portfolio holdings of TALF LLC 10 853 0+ 68 853Float
-747- 47+ 418 -1,158Central bank liquidity swaps 11 12,951+ 400+ 12,451 12,951Other Federal Reserve assets 12 205,265+ 2,650+ 69,339 206,027Gold stock
11,041 0 0 11,041Special drawing rights certificate account 5,200 0 0 5,200Treasury currency outstanding 13
44,713
+ 14
+ 605 44,713Total factors supplying reserve funds 2,858,341+ 11,828- 41,807
2,854,490
Note: Components may not sum to totals because of rounding. Footnotes appear at the end of the table.
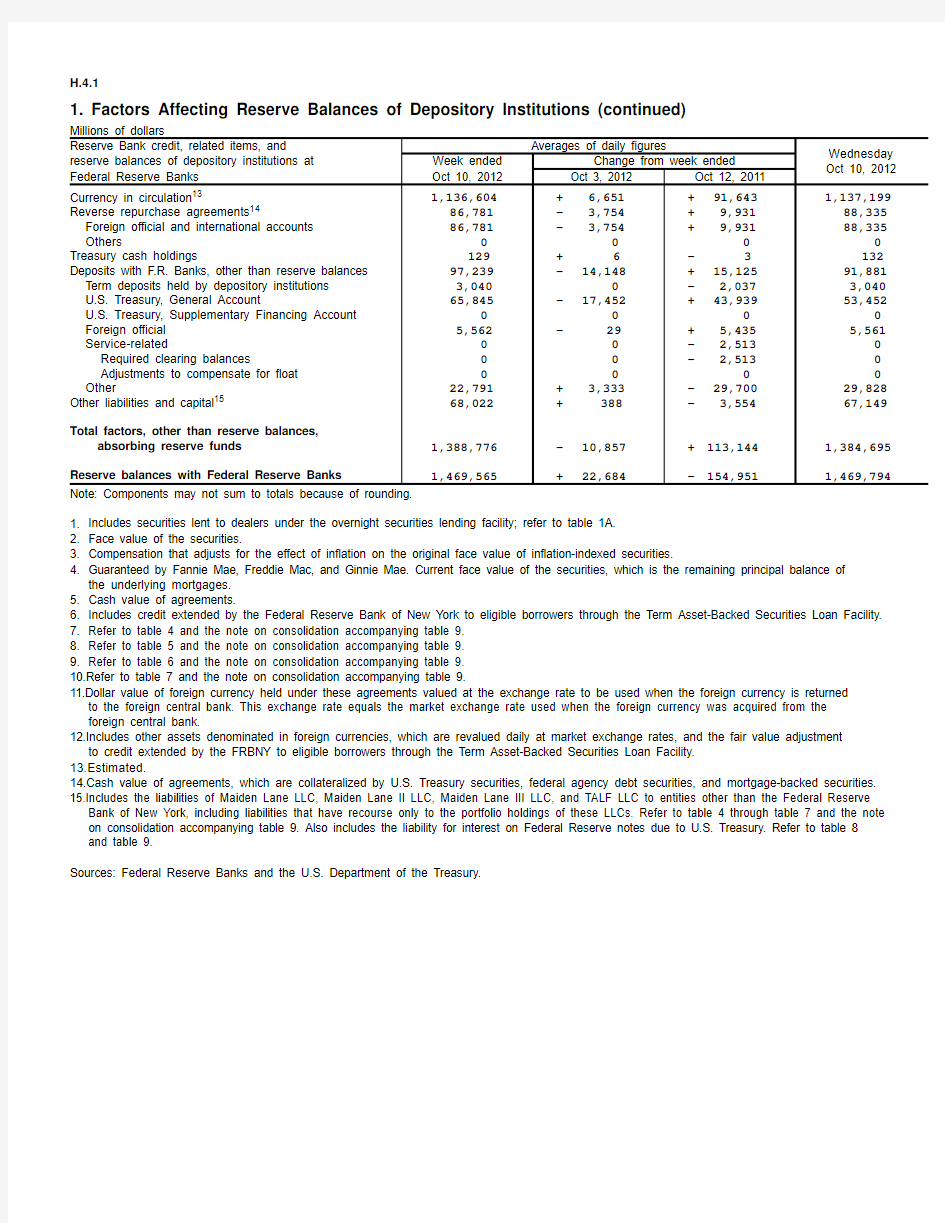
1. Factors Affecting Reserve Balances of Depository Institutions (continued)
Millions of dollars
Averages of daily figures
Wednesday Oct 10, 2012Week ended Oct 10, 2012Change from week ended Oct 3, 2012Oct 12, 2011
Reserve Bank credit, related items, and
reserve balances of depository institutions at Federal Reserve Banks
Currency in circulation 13
1,136,604+ 6,651+ 91,643 1,137,199Reverse repurchase agreements 14
86,781- 3,754+ 9,931 88,335Foreign official and international accounts 86,781- 3,754+ 9,931 88,335Others
0 0 0 0Treasury cash holdings
129+ 6- 3 132Deposits with F.R. Banks, other than reserve balances 97,239- 14,148+ 15,125 91,881Term deposits held by depository institutions 3,040 0- 2,037 3,040U.S. Treasury, General Account
65,845- 17,452+ 43,939 53,452U.S. Treasury, Supplementary Financing Account 0 0 0 0Foreign official 5,562- 29+ 5,435 5,561Service-related
0 0- 2,513 0Required clearing balances
0 0- 2,513 0Adjustments to compensate for float 0 0 0 0Other
22,791+ 3,333- 29,700 29,828Other liabilities and capital 15
68,022
+ 388
- 3,554
67,149
Total factors, other than reserve balances,
absorbing reserve funds
1,388,776- 10,857+ 113,144 1,384,695Reserve balances with Federal Reserve Banks
1,469,565
+ 22,684
- 154,951
1,469,794
Note: Components may not sum to totals because of rounding.1.Includes securities lent to dealers under the overnight securities lending facility; refer to table 1A.2.Face value of the securities.
https://www.360docs.net/doc/4113925624.html,pensation that adjusts for the effect of inflation on the original face value of inflation-indexed securities.
4.
Guaranteed by Fannie Mae, Freddie Mac, and Ginnie Mae. Current face value of the securities, which is the remaining principal balance of the underlying mortgages.5.Cash value of agreements.
6.Includes credit extended by the Federal Reserve Bank of New York to eligible borrowers through the Term Asset-Backed Securities Loan Facility.
7.Refer to table 4 and the note on consolidation accompanying table 9.
8.Refer to table 5 and the note on consolidation accompanying table
9.9.Refer to table 6 and the note on consolidation accompanying table 9.10.Refer to table 7 and the note on consolidation accompanying table 9.
11.Dollar value of foreign currency held under these agreements valued at the exchange rate to be used when the foreign currency is returned
to the foreign central bank. This exchange rate equals the market exchange rate used when the foreign currency was acquired from the foreign central bank.
12.Includes other assets denominated in foreign currencies, which are revalued daily at market exchange rates, and the fair value adjustment
to credit extended by the FRBNY to eligible borrowers through the Term Asset-Backed Securities Loan Facility.13.Estimated.
14.Cash value of agreements, which are collateralized by U.S. Treasury securities, federal agency debt securities, and mortgage-backed securities.15.Includes the liabilities of Maiden Lane LLC, Maiden Lane II LLC, Maiden Lane III LLC, and TALF LLC to entities other than the Federal Reserve
Bank of New York, including liabilities that have recourse only to the portfolio holdings of these LLCs. Refer to table 4 through table 7 and the note on consolidation accompanying table 9. Also includes the liability for interest on Federal Reserve notes due to U.S. Treasury. Refer to table 8and table 9.Sources: Federal Reserve Banks and the U.S. Department of the Treasury.
1A. Memorandum Items
Millions of dollars Averages of daily figures
Wednesday Oct 10, 2012Week ended Oct 10, 2012Change from week ended Oct 3, 2012Oct 12, 2011
Memorandum item
Marketable securities held in custody for foreign
official and international accounts 1 3,587,395- 5,911+ 183,744 3,595,004U.S. Treasury securities 2,883,199- 6,192+ 202,777 2,891,489Federal agency securities 2 704,196+ 282- 19,033 703,515Securities lent to dealers 7,509- 2,818- 2,282 6,866Overnight facility 3
7,509- 2,818- 2,282 6,866U.S. Treasury securities
7,036- 2,725- 1,604 6,420Federal agency debt securities
473
- 93
- 679
446
Note: Components may not sum to totals because of rounding.
1.Face value of the securities. Includes U.S. Treasury STRIPS and other zero-coupon bonds at face value and mortgage-backed securities at original
face value.
2.Includes debt and mortgage-backed securities.
3.Fully collateralized by U.S. Treasury securities.
2. Maturity Distribution of Securities, Loans, and Selected Other Assets and Liabilities, October 10, 2012
Millions of dollars Within 15days 16 days to 90 days 91 days to 1 year Over 1 year to 5 years Over 5 years to 10 years Over 10years All Remaining maturity
Loans 1
53 217 363 927 0 ... 1,559U.S. Treasury securities 2
Holdings
0 485 17 454,182 814,098 384,955 1,653,737Weekly changes
0 0- 594- 7,195+ 4,740+ 3,843+ 793Federal agency debt securities 3
Holdings
844 5,119 16,131 53,895 4,410 2,347 82,746Weekly changes
+ 185- 844 0 0 0 0- 659Mortgage-backed securities 4
Holdings
0 0 4 2 306 834,693 835,005Weekly changes
0 0 0 0 0+ 13+ 13Asset-backed securities held by
TALF LLC 5
0 0 0 0 0 0 0Repurchase agreements 6 0 0 ... ... ... ... 0Central bank liquidity swaps 7
4,775
8,175
0 0 0 0 12,951Reverse repurchase agreements 6 88,335 0 ... ... ... ... 88,335Term deposits 3,040 0 0
...
...
...
3,040
Note: Components may not sum to totals because of rounding.. . . Not applicable.
1.Excludes the loans from the Federal Reserve Bank of New York (FRBNY) to Maiden Lane LLC, Maiden Lane II LLC, Maiden
Lane III LLC, and TALF LLC. The loans were eliminated when preparing the FRBNY’s statement of condition consistent with consolidation under generally accepted accounting principles.
2.Face value. For inflation-indexed securities, includes the original face value and compensation that adjusts for the effect of inflation on the
original face value of such securities.3.Face value.
4.Guaranteed by Fannie Mae, Freddie Mac, and Ginnie Mae. Current face value of the securities, which is the remaining principal balance of the
underlying mortgages.
5.Face value of asset-backed securities held by TALF LLC, which is the remaining principal balance of the underlying assets.
6.Cash value of agreements.
7.Dollar value of foreign currency held under these agreements valued at the exchange rate to be used when the foreign currency is returned to
the foreign central bank. This exchange rate equals the market exchange rate used when the foreign currency was acquired from the foreign central bank.
3. Supplemental Information on Mortgage-Backed Securities
Millions of dollars
Wednesday
Account name
Oct 10, 2012
Mortgage-backed securities held outright1 835,005 Commitments to buy mortgage-backed securities2 109,089 Commitments to sell mortgage-backed securities2 2,750
Cash and cash equivalents3 6
1.Guaranteed by Fannie Mae, Freddie Mac, and Ginnie Mae. Current face value of the securities, which is the remaining principal balance of the
underlying mortgages.
2.Current face value. Generally settle within 180 days and include commitments associated with outright transactions, dollar rolls, and coupon swaps.
3.This amount is included in other Federal Reserve assets in table 1 and in other assets in table 8 and table 9.
4. Information on Principal Accounts of Maiden Lane LLC
Millions of dollars
Wednesday
Account name
Oct 10, 2012
Net portfolio holdings of Maiden Lane LLC1 1,732
Outstanding principal amount of loan extended by the Federal Reserve Bank of New York2 0
Accrued interest payable to the Federal Reserve Bank of New York2 0
Outstanding principal amount and accrued interest on loan payable to JPMorgan Chase & Co.3 308
1.Fair value. Fair value reflects an estimate of the price that would be received upon selling an asset if the transaction were to be conducted in an
orderly market on the measurement date. Revalued quarterly. This table reflects valuations as of June 30, 2012. Any assets purchased after this valuation date are initially recorded at cost until their estimated fair value as of the purchase date becomes available.
2.Book value. This amount was eliminated when preparing the Federal Reserve Bank of New York’s statement of condition consistent with
consolidation under generally accepted accounting principles. Refer to the note on consolidation accompanying table 9.
3.Book value. The fair value of these obligations is included in other liabilities and capital in table 1 and in other liabilities and accrued dividends in
table 8 and table 9.
Note: On June 26, 2008, the Federal Reserve Bank of New York (FRBNY) extended credit to Maiden Lane LLC under the authority of section 13(3)
of the Federal Reserve Act. This limited liability company was formed to acquire certain assets of Bear Stearns and to manage those assets
through time to maximize repayment of the credit extended and to minimize disruption to financial markets. Payments by Maiden Lane LLC from
the proceeds of the net portfolio holdings will be made in the following order: operating expenses of the LLC, principal due to the FRBNY, interest
due to the FRBNY, principal due to JPMorgan Chase & Co., and interest due to JPMorgan Chase & Co. Any remaining funds will be paid to the FRBNY.
5. Information on Principal Accounts of Maiden Lane II LLC
Millions of dollars
Wednesday
Account name
Oct 10, 2012
Net portfolio holdings of Maiden Lane II LLC1 61
Outstanding principal amount of loan extended by the Federal Reserve Bank of New York2 0
Accrued interest payable to the Federal Reserve Bank of New York2 0
Deferred payment and accrued interest payable to subsidiaries of American International Group, Inc.3 0
1.Fair value. Fair value reflects an estimate of the price that would be received upon selling an asset if the transaction were to be conducted in an
orderly market on the measurement date. Revalued quarterly. This table reflects valuations as of June 30, 2012. Any assets purchased after this valuation date are initially recorded at cost until their estimated fair value as of the purchase date becomes available.
2.Book value. This amount was eliminated when preparing the Federal Reserve Bank of New York’s statement of condition consistent with
consolidation under generally accepted accounting principles. Refer to the note on consolidation accompanying table 9.
3.Book value. The deferred payment represents the portion of the proceeds of the net portfolio holdings due to subsidiaries of American
International Group, Inc. in accordance with the asset purchase agreement. The fair value of this payment and accrued interest payable are included in other liabilities and capital in table 1 and in other liabilities and accrued dividends in table 8 and table 9.
Note: On December 12, 2008, the Federal Reserve Bank of New York (FRBNY) began extending credit to Maiden Lane II LLC under the authority
of section 13(3) of the Federal Reserve Act. This limited liability company was formed to purchase residential mortgage-backed securities from the U.S. securities lending reinvestment portfolio of subsidiaries of American International Group, Inc. (AIG subsidiaries). Payments by Maiden Lane II LLC from the proceeds of the net portfolio holdings will be made in the following order: operating expenses of Maiden Lane II LLC, principal due to
the FRBNY, interest due to the FRBNY, and deferred payment and interest due to AIG subsidiaries. Any remaining funds will be shared by the FRBNY and AIG subsidiaries.
6. Information on Principal Accounts of Maiden Lane III LLC
Millions of dollars
Wednesday
Account name
Oct 10, 2012
Net portfolio holdings of Maiden Lane III LLC1 23
Outstanding principal amount of loan extended by the Federal Reserve Bank of New York2 0
Accrued interest payable to the Federal Reserve Bank of New York2 0
Outstanding principal amount and accrued interest on loan payable to American International Group, Inc.3 0
1.Fair value. Fair value reflects an estimate of the price that would be received upon selling an asset if the transaction were to be conducted in an
orderly market on the measurement date. Revalued quarterly. This table reflects valuations as of June 30, 2012. Any assets purchased after this valuation date are initially recorded at cost until their estimated fair value as of the purchase date becomes available.
2.Book value. This amount was eliminated when preparing the Federal Reserve Bank of New York’s statement of condition consistent with
consolidation under generally accepted accounting principles. Refer to the note on consolidation accompanying table 9.
3.Book value. The fair value of these obligations is included in other liabilities and capital in table 1 and in other liabilities and accrued dividends in
table 8 and table 9.
Note: On November 25, 2008, the Federal Reserve Bank of New York (FRBNY) began extending credit to Maiden Lane III LLC under the authority
of section 13(3) of the Federal Reserve Act. This limited liability company was formed to purchase multi-sector collateralized debt obligations
(CDOs) on which the Financial Products group of American International Group, Inc. (AIG) has written credit default swap (CDS) contracts. In
connection with the purchase of CDOs, the CDS counterparties will concurrently unwind the related CDS transactions. Payments by Maiden Lane
III LLC from the proceeds of the net portfolio holdings will be made in the following order: operating expenses of Maiden Lane III LLC, principal due
to the FRBNY, interest due to the FRBNY, principal due to AIG, and interest due to AIG. Any remaining funds will be shared by the FRBNY and
AIG.
7. Information on Principal Accounts of TALF LLC
Millions of dollars
Wednesday
Account name
Oct 10, 2012
Asset-backed securities holdings1 0
Other investments, net 853
Net portfolio holdings of TALF LLC 853
Outstanding principal amount of loan extended by the Federal Reserve Bank of New York2 0
Accrued interest payable to the Federal Reserve Bank of New York2 0
Funding provided by U.S. Treasury to TALF LLC, including accrued interest payable3 112
1.Fair value. Fair value reflects an estimate of the price that would be received upon selling an asset if the transaction were to be conducted in an orderly
market on the measurement date.
2.Book value. This amount was eliminated when preparing the Federal Reserve Bank of New York’s statement of condition consistent with consolidation
under generally accepted accounting principles. Refer to the note on consolidation accompanying table 9.
3.Book value. The fair value of these obligations is included in other liabilities and capital in table 1 and in other liabilities and accrued dividends in table 8
and table 9.
Note: On November 25, 2008, the Federal Reserve announced the creation of the Term Asset-Backed Securities Loan Facility (TALF) under the authority of section 13(3) of the Federal Reserve Act. The TALF is a facility under which the Federal Reserve Bank of New York (FRBNY) extends loans with a term of up to five years to holders of eligible asset-backed securities. The TALF is intended to assist financial markets in accommodating the credit needs of consumers and businesses by facilitating the issuance of asset-backed securities collateralized by a variety of consumer and business loans. The loans provided through the TALF to eligible borrowers are non-recourse, meaning that the obligation of the borrower can be discharged by surrendering the collateral to the FRBNY. The loans are extended for the market value of the security less an amount known as a haircut. As a result, the borrower bears the initial risk of a decline in the value of the security.
TALF LLC is a limited liability company formed to purchase and manage any asset-backed securities received by the FRBNY in connection with the decision of a borrower not to repay a TALF loan. TALF LLC has committed, for a fee, to purchase all asset-backed securities received by the FRBNY in conjunction with a TALF loan at a price equal to the TALF loan plus accrued but unpaid interest. Losses on asset-backed securities held by TALF LLC will be offset in the following order: by the commitment fees collected by TALF LLC, by the interest received on investments of TALF LLC, by up to $1.4 billion in subordinated debt funding provided by the U.S. Treasury, and finally, by senior debt funding provided by the FRBNY. Payments by TALF LLC from the proceeds of its net portfolio holdings will be made in the following order: operating expenses of TALF LLC, principal due to the FRBNY, principal due to the U.S. Treasury, interest due to the FRBNY, and interest due to the U.S. Treasury. Any remaining funds will be shared by the FRBNY and the U.S. Treasury.
8. Consolidated Statement of Condition of All Federal Reserve Banks Millions of dollars
Eliminations from consolidation Wednesday
Oct 10, 2012
Change since
Wednesday
Oct 3, 2012
Wednesday
Oct 12, 2011
Assets, liabilities, and capital
Assets
Gold certificate account 11,037 0 0 Special drawing rights certificate account 5,200 0 0 Coin 2,174- 6- 81 Securities, repurchase agreements, and loans 2,573,047+ 134- 86,264 Securities held outright1 2,571,487+ 146- 76,431 U.S. Treasury securities 1,653,737+ 793- 15,029 Bills2 0 0- 18,423 Notes and bonds, nominal2 1,571,859+ 690+ 430 Notes and bonds, inflation-indexed2 71,784 0+ 2,818 Inflation compensation3 10,094+ 103+ 145 Federal agency debt securities2 82,746- 659- 25,522 Mortgage-backed securities4 835,005+ 13- 35,878 Repurchase agreements5 0 0 0 Loans 1,559- 13- 9,834 Net portfolio holdings of Maiden Lane LLC6 1,732+ 1- 13,763 Net portfolio holdings of Maiden Lane II LLC7 61 0- 9,794 Net portfolio holdings of Maiden Lane III LLC8 23 0- 21,271 Net portfolio holdings of TALF LLC9 853 0+ 68 Items in process of collection (229) 201- 28- 81 Bank premises 2,345+ 1+ 163 Central bank liquidity swaps10 12,951+ 400+ 12,451 Other assets11 203,682+ 2,606+ 68,108 Total assets (229) 2,813,306+ 3,110- 50,464 Note: Components may not sum to totals because of rounding. Footnotes appear at the end of the table.
8. Consolidated Statement of Condition of All Federal Reserve Banks (continued) Millions of dollars
Eliminations from consolidation Wednesday
Oct 10, 2012
Change since
Wednesday
Oct 3, 2012
Wednesday
Oct 12, 2011
Assets, liabilities, and capital
Liabilities
Federal Reserve notes, net of F.R. Bank holdings 1,094,788+ 3,512+ 91,466 Reverse repurchase agreements12 88,335+ 1,072+ 14,851 Deposits (0) 1,561,675- 1,823- 151,745 Term deposits held by depository institutions 3,040 0- 2,037 Other deposits held by depository institutions 1,469,795+ 5,170- 165,593 U.S. Treasury, General Account 53,452- 20,036+ 35,771 U.S. Treasury, Supplementary Financing Account 0 0 0 Foreign official 5,561 0+ 5,435 Other (0) 29,828+ 13,044- 25,320 Deferred availability cash items (229) 1,359+ 460- 901 Other liabilities and accrued dividends13 12,413- 115- 6,834
Total liabilities (229) 2,758,570+ 3,106- 53,163
Capital accounts
Capital paid in 27,368+ 2+ 1,349 Surplus 27,368+ 2+ 1,349 Other capital accounts 0 0 0
Total capital 54,735+ 3+ 2,698 Note: Components may not sum to totals because of rounding.
1.Includes securities lent to dealers under the overnight securities lending facility; refer to table 1A.
2.Face value of the securities.
https://www.360docs.net/doc/4113925624.html,pensation that adjusts for the effect of inflation on the original face value of inflation-indexed securities.
4.Guaranteed by Fannie Mae, Freddie Mac, and Ginnie Mae. Current face value of the securities, which is the remaining principal balance of the
underlying mortgages.
5.Cash value of agreements, which are collateralized by U.S. Treasury and federal agency securities.
6.Refer to table 4 and the note on consolidation accompanying table 9.
7.Refer to table 5 and the note on consolidation accompanying table 9.
8.Refer to table 6 and the note on consolidation accompanying table 9.
9.Refer to table 7 and the note on consolidation accompanying table 9.
10.Dollar value of foreign currency held under these agreements valued at the exchange rate to be used when the foreign currency is returned to
the foreign central bank. This exchange rate equals the market exchange rate used when the foreign currency was acquired from the foreign central bank.
11.Includes other assets denominated in foreign currencies, which are revalued daily at market exchange rates and the fair value adjustment to
credit extended by the Federal Reserve Bank of New York (FRBNY) to eligible borrowers through the Term Asset-Backed Securities Loan Facility.
12.Cash value of agreements, which are collateralized by U.S. Treasury securities, federal agency debt securities, and mortgage-backed securities.
13.Includes the liabilities of Maiden Lane LLC, Maiden Lane II LLC, Maiden Lane III LLC, and TALF LLC to entities other than the Federal
Reserve Bank of New York, including liabilities that have recourse only to the portfolio holdings of these LLCs. Refer to table 4 through table 7 and the note on consolidation accompanying table 9. Also includes the liability for interest on Federal Reserve notes due to U.S. Treasury.
H.4.1
10. Collateral Held against Federal Reserve Notes: Federal Reserve Agents’ Accounts
Millions of dollars
Wednesday Federal Reserve notes and collateral
Oct 10, 2012 Federal Reserve notes outstanding 1,312,753 Less: Notes held by F.R. Banks not subject to collateralization 217,965 Federal Reserve notes to be collateralized 1,094,788 Collateral held against Federal Reserve notes 1,094,788 Gold certificate account 11,037 Special drawing rights certificate account 5,200 U.S. Treasury, agency debt, and mortgage-backed securities pledged1,2 1,078,551 Other assets pledged 0 Memo:
Total U.S. Treasury, agency debt, and mortgage-backed securities1,2 2,571,487 Less: Face value of securities under reverse repurchase agreements 75,387 U.S. Treasury, agency debt, and mortgage-backed securities eligible to be pledged 2,496,101 Note: Components may not sum to totals because of rounding.
1.Includes face value of U.S. Treasury, agency debt, and mortgage-backed securities held outright, compensation to
adjust for the effect of inflation on the original face value of inflation-indexed securities, and cash value of repurchase
agreements.
2.Includes securities lent to dealers under the overnight securities lending facility; refer to table 1A.
美联储资产负债表_20021226
Reserve Bank credit, related items, and reserve balances of depository institutions at Federal Reserve Banks Reserve Bank credit 703,676 + 11,023 + 69,903 708,472Securities held outright 629,410 + 2,931 + 73,535 629,412U.S. Treasury 1 629,400 + 2,931 + 73,535 629,402Bills 2 226,682 + 2,925 + 40,429 226,682Notes and bonds, nominal 2 389,219 0 + 30,765 389,219Notes and bonds, inflation-indexed 2 12,242 0 + 2,056 12,242Inflation compensation 3 1,256 + 6 + 284 1,258Federal agency 2 10 0 0 10Repurchase agreements 4 34,321 + 6,142 - 7,422 37,250Loans to depository institutions 59 + 4 - 13 59Adjustment credit 13 + 7 - 23 9Seasonal credit 46 - 3 + 10 50Extended credit 0 0 0 0Float 1,177 + 1,238 + 1,008 2,793Other Federal Reserve assets 38,708 + 705 + 2,793 38,958Gold stock 11,043 0 - 2 11,043Special drawing rights certificate account 2,200 0 0 2,200Treasury currency outstanding 5 34,483 + 14 + 1,476 34,483Total factors supplying reserve funds 751,401 + 11,036 + 71,376 756,197Currency in circulation 5 681,441 + 6,025 + 42,945 685,007Reverse repurchase agreements 6 20,908 + 2,706 + 20,908 20,396Foreign official and international accounts 20,908 + 2,706 + 20,908 20,396Dealers 0 0 0 0Treasury cash holdings 360 - 10 - 65 360Deposits with F.R. Banks, other than reserve balances 16,186 - 1,031 + 2,018 16,184U.S. Treasury, general account 4,678 - 1,281 + 33 4,662Foreign official 114 - 34 - 230 139Service-related 11,181 + 281 + 2,209 11,181Required clearing balances 10,452 + 2 + 1,870 10,452Adjustments to compensate for float 729 + 279 + 339 729Other 212 + 2 + 5 203Other liabilities and capital 20,441 + 238 + 2,685 20,670Total factors, other than reserve balances,absorbing reserve funds 739,334 + 7,925 + 68,489 742,617Reserve balances with Federal Reserve Banks 12,067 + 3,111 + 2,887 13,580 Memo (off-balance-sheet items): Marketable securities held in custody for foreign official and international accounts 2,7 848,867 + 2,568 . . . 848,468U.S. Treasury 685,997 + 704. . . 685,042Federal agency 162,870 + 1,865 . . . 163,426Securities lent to dealers 304 + 153 - 4,151 111 December 26, 2002 Factors Affecting Reserve Balances of Depository Institutions and Condition Statement of Federal Reserve Banks 1. Factors Affecting Reserve Balances of Depository Institutions Millions of dollars Averages of daily figures Note: Components may not sum to totals because of rounding.. . .not available.1.Includes securities lent to dealers, which are fully collateralized by other U.S. Treasury securities.2.Face value of the securities. https://www.360docs.net/doc/4113925624.html,pensation that adjusts for the effects of inflation on the original face value of inflation-indexed securities. 4.Cash value of agreements, which are collateralized by U.S. Treasury and federal agency securities. 5.Estimated. 6.Cash value of agreements, which are collateralized by U.S. Treasury securities. 7. Includes U.S. Treasury STRIPS and other zero coupon bonds at face value. Sources: Federal Reserve Banks and the U.S. Department of the Treasury. Change from week ended Wednesday Dec 25, 2002Week ended Dec 25, 2002 Dec 18, 2002 Dec 26, 2001
资产负债表结构分析及资产构成要素分析
资产负债表结构分析及资产构成要素分析 当你面对客户递交的财务报表时是否有一种无所适从的沉重感?迷茫和焦虑瞬间涌上你的大脑?好吧,是时候拯救你的脑细胞了。资料中给出的表格为公司2011年12月31日的合并资产负债表。本文从以下三个方面进行分析,并对企业的管理给出几点建议。 一、资产负债表结构分析 资产结构分析 子负债与权益结构分析
从表2中我们可以看出公司流动负债占资本总计的18.02%,长期负债占资本总计的18.44%,所有者权益占资本总计的63.54%。由此我们得出,公司的债务资本比例为36.46%,权益资本比例为63.54%,公司负债资本较低,权益资本较高。低负债资本、高权益资本可以降低企业财务风险,减少企业发生债务危机的比率,但是会增加企业资本成本,不能有效发挥债务资本的财务杠杆效益。 资产与负债匹配分析 二、资产构成要素分析 企业总资产为65089万元,其中流动性资产为44820万元,占资产总额的比例为68.86%;非流动资产为20269万元,占据的资产份额为31.14%。具体构成情况见表4
丢失、被盗的危险;其次,大量存货会占用过多资金,造成企业资金周转困难,增加利息,降低资金使用效率;再次,现代市场经济中,新材料、新产品层出不穷,更新换代非常迅速,拥有大量存货不便应对复杂多变的市场。 4.固定资产比率较低公司2011年包括在建工程在内的固定资产合计为10471万元,占资产总计的比例为16.09%。企业的固定资产比重与行业特征有关,但一般认为,工业企业固定资产比重为40%,商业企业固定资产比重为30%较为适宜,公司固定资产比重过低。 在进一步分析固定资产构成(见表5),我们可以得到以下两个结论: 第一,公司固定资产折旧程度较高。公司固定资产折旧总计为13721万元,占固定资产原值的比例为46.68%,折旧金额较大,这说明公司固定资产老化较为严重。 第二,公司固定资产减值较高。公司固定资产减值金额为15672万元,占公司固定资产原值的比例为23.39%,占固定资产净值比例为43.87%,这说明公司现有固定资产的公允价值或现值较低,固定资产已经落后,需要更新换代。在建工程在一定程度上可以反映企业固定资产更新换代的力度,公司20114年在建工程价值为1674万元,仅占固定资产净额
中美两国资产负债表的分析
中美两国货币当局资产负债表分析 09JR1 ALLICE 前言:下图为整理后的中美两国货币当局2010年9月的资产负 债表,对比发现,中美两国资产负债项目的划分设置还是有很大区别 的,我就下图所列项目中几个对总值影响比较大的作以分析。对于不 足或有误之处,恳请老师指正。 2010.09中国货币当局资产负债表(Balance Sh 报表项目Items 国外资产 Foreign Assets 外汇 Foreign Exchange 货币黄金 Monetary Gold 其他国外资产 Other Foreign Assets 对政府债权 Claims on Government 其中:中央政府 Of which: Central Government 对其他存款性公司债权 Claims on Other Depository Corporations 对其他金融性公司债权 Claims on Other Financial Corporations 对非金融性公司债权 Claims on Non-financial Corporations 其他资产 Other Assets 总资产 Total Assets 储备货币 Reserve Money 货币发行 Currency Issue 金融性公司存款 Deposits of Financial Corporations 其他存款性公司 Other Depository Corporations 其他金融性公司 Other Financial Corporations 不计入储备货币的金融性公司存款Deposits of financial corporations excluded fr 发行债券 Bond Issue 国外负债 Foreign Liabilities 政府存款 Deposits of Government 自有资金 Own Capital 其他负债 Other Liabilities 总负债 Total Liabilities
美联储资产负债表解读
美联储资产负债表解读 MILASS 我们都知道,一国(或地区)的法定货币是由该国(或地区)的货币发行机构发行,而这个发行机构通常是该国(或地区)的中央银行(非中央银行发行的情况,本文不累述)。狭义的法定货币是指中央银行发行的钞票。广义的法定货币又分基础货币和广义货币(M2或M3,各国定义的标准有一定差异)。基础货币的供应是由中央银行来实现的,而派生货币供应(广义货币除去基础货币)则是由商业银行来实现。 一般来讲,基础货币的发行是需要保证物背书的,这些保证物可以是贵金属、金融票据、外国货币以及实物等资产。也就是说,央行通过购买这些资产来发行基础货币。而在实际操作过程当中,我们发现央行充当了最后贷款人的角色,央行通过再贴现、再贷款等方式直接向金融机构、甚至是政府部门进行资金融通,发行基础货币。中央银行在履行货币发行、执行货币政策等职能时,这些业务活动所形成的债权债务,就构成了央行的资产负责表。 下面笔者就以美国联邦储备银行的资产负债表为例,来和大家探讨全球结算货币——美元的发行。在此之前,我们先来看看中央银行资产负债表的基本概念和内容。 一.定义 中央银行资产负债表的定义是:中央银行在履行职能时,业务活动所形成的债权债务存量表。中央银行资产负债业务的种类、规模和结构都综合地反映在资产负债表上。 二.内容 中央银行资产负债表的内容包括: 1.负债项目 (1)流通中的货币 作为发行的银行,发行货币是中央银行的基本职能,也是中央银行的主要资金来源,中央银行发行的货币通过再贴现、再贷款、购买有价证券和收购黄金、外汇投入市场,成为流通中的货币,成为中央银行对公众的负债。
(2)各项存款 包括政府和公共机构存款、商业银行等金融机构存款。作为国家的银行,政府通常会赋予中央银行代理国库的职责,政府和公共机构存款由中央银行办理。作为银行的银行,中央银行的金融机构存款包括了商业银行缴存准备金和用于票据清算的活期存款。 (3)其他负债 包括对国际金融机构的负债或中央银行发行债券。 2.资本项目 资本项目即央行的净资产(自有资本)。 3.资产项目 (1)贴现及放款 中央银行作为最后贷款者对商业银行提供资金融通,主要的方式包括再贴现和再贷款。还有财政部门的借款和在国外金融机构的资产。 (2)各种证券 主要指中央银行的证券买卖。中央银行持有的证券一般都是信用等级比较高的政府证券。中央银行持有证券和从事公开市场业务的目的不是为了盈利,而是通过证券买卖对货币供应量进行调节。 (3)黄金和外汇储备 黄金和外汇储备是稳定币值的重要手段,也是国际间支付的重要储备。中央银行承担为国家管理黄金和外汇储备的责任,也是中央银行的重要资金运用。 (4)其他资产 三.中央银行资产和负债的基本关系 在实际操作中,各国制作的资产负债表通常分为资产方和负债方,比如中国人民银行的资产负债表,是将自有资本列入负债方,以此表明这是资金来源。而有的国家则是把自有资本(资本项目)单列出来,使得
资产负债表整体结构分析
资产负债表整体结构分析 资产负债表由资产、负债和所有者权益三部分组成。资产负债表结构分析,就是通过对报表各个组成部分占总资产的比率分析,来评价和衡量企业的财务状况。 企业的资产和负债是从两个不同角度反映同一经营活动的两种记录。资产是反映企业可支配资金的多少,通过现金、存货、固定资产等形式反映资金存在的状况;而负债足企业资金取得的途径,反映的是资产筹集的来源,如短期借款、长期借款等。 资产负债表结构分析包括资产结构分析、负债结构分析等。 (一)资产负债表列示 为一直观、有效地分析企业资产负债表,我们需要先提供一个资产负债表,仍然以老母亲餐厅为例,假设餐厅持续发展,在**01年12月31日之后的一年里运转正常,且**01年12月31日的资产负债表以表2-3“老母亲餐厅”组织第一次聚餐后适当投融资后的资产负债表为标准对外报出,到** 02年12月31日时,餐厅对外报出的资产负债表如表8-1所示。 企业经营中的细节说明:在* *02年的全年,老母亲餐厅实现主营业务收人3 650元,购买了60元的固定资产,购买了经营“二毛酸菜”的品牌使用投花费20元,无其他大项支出,对应的利润表见本章表8—8。 表8-l经营1年后老母亲餐厅的资产负债表 编制单位:老母亲餐厅**02年12月31日单位:元 注:表数据对应表8-8利润表,表10-l现金流量表。在第8章、第9章和第10章中提到的资产负债表数据,都来来源于该表。 (二)资产结构分析 资产负债表的资产结构,指企业的流动资产、长期投资、固定资产、无形资产及其他资产占资产总额的比重。通过分析不同流动性的资产占总资产的比率,能了解企业的资产结构是否合理。 在分析资产结构时,报表使用者关注的指标主要有流动资产率,其计算公式为: 流动资产率=(流动资产额/资产总额)*100%。 具体到“老母亲餐厅”* *02年底报表数,其流动资产率=1164. 7/1528. 7*100%= 76. 19%。
美联储资产负债表
次贷危机以来美联储资产负债表的变化 作者:唐欣语发布时间:2009-05-04 09:33 来源:21世纪经济报道 2007年下半年以来,美国次贷危机愈演愈烈,美联储为应对金融危机采取了大量拯救措施,为市场提供流动性,恢复市场信心。这导致美联储资产负债表的规模与结构发生显著变化,本文欲予以分析。 危机发生前的2007年6月底,美联储资产负债表非常简洁:在资产方,联储持有的美国财政部证券占据大头(2007年6月底占比为87.9%);在负债方,流通中的货币占据大头(2007年6月底占比为90%),但金融危机改变了这一切。 联储资产负债表的规模迅速膨胀,总规模由2007年6月的8993亿美元上升到目前的21217亿美元,不到两年时间增长了1.36倍。 资产方的结构分析 首先,美联储在减持美国财政部债券。2007年6月底联储持有财政债券为7904亿美元,2009年4月8日为5055.2亿美元,减持了36%;相应地,财政债券在资产方的占比也从87.9%下降到目前的37.6%(???)。联储减持财政债券,主要是因为通过公开市场操作投放的货币不具有指向性,而救市必须“专款专用”,因此它通过减持国债回笼资金,再通过其它专项计划投放给特定机构。这可以理解为:联储一手通过多种创新工具向市场投放流动性,一手用卖出国债的方式回收流动性。 其次,新资产项目显著增多、数额巨大。 第一,在“证券”项目(附表1中1.1项)下,从2009年1月起开始设置“MBS(抵押贷款债券)”栏,用于反映联储收购的由房利美、房地美、吉利美担保的MBS。该收购计划于2008年11月宣布,计划收购总量将达到MBS市场的1/9,即5000亿美元,意在提高MBS市场的流动性,压低MBS的利率,从而压低长期住房抵押贷款利率,重整楼市,促进美国经济复苏。目前此项目余额为2364亿美元,占资产方余额的11.2%。 第二,新设“定期拍卖信贷”(Term Auction Credit)项目(附表1中1.3项),用于反映“定期拍卖便利”(Term Auction Facility,简称TAF)所投放的信贷。 2007年下半年次贷危机恶化时,美联储历次降低再贴现利率和联邦基金目标利率,并使二者的息差缩小到25个基点,旨在鼓励银行从贴现窗口(在资产负债表上表示为“一级信贷”、“次级信贷”和“季节性信贷”三者之和)融资。联储从贴现窗口投放的资金大大增加,由2007年6月的1.49亿美元增加到2008年10月的最高值1119亿美元。但从总量上看,传统的贴现窗口投放的信贷规模仍非常有限。金融机构到联储申请再贴现,容易让市场对其支付能力产生怀疑。为了减轻再贴现窗口的名誉影响,联储推出了TAF机制,该机制允许存款类金融机构使用更广泛的抵押品,通过拍卖机制获得联储的短期贷款。此项目余额已达
中美央行资产负债表对比
中美央行资产负债表分析及对比 在次贷危机向全球金融危机演变的过程中,在危机不断加深、变广的过程中,各国政府都在想尽办法通过各种政策措施来缓解或消除危机的影响。中央银行,作为负责金融体系稳定的货币政策当局,在危机中自然是首当其冲,展开了大规模的救市活动。作为美国货币政策当局的美联储首当其冲没在常规货币政策—降息效果不明显的情况下,采取超常规的“定量宽松”的货币政策,即通过创新金融工具,以及向具有系统重要性的实体企业提供融资等方式向市场注入大量流动性,用于救助陷入困境的金融机构,以期提振市场信心,刺激经济增长。“定量宽松”货币政策的实施客观上对金融市场和实体经济产生了积极影响,有效防止了市场崩溃和经济急速衰退。与此同时,由于金融市场的相对封闭,中国受危机影响相对有限,中国政府亦高度警惕,推出了4万亿刺激计划,中国人民银行也做出了降息等政策反应。两国货币政策的差异对金融市场产生了不同影响,彰显了不同的管理理念和价值取向,对各自央行资产负债表的影响也存在较大不同。 资产负债表项目构成不同,从资产项目来看,中美两国央行总资产大体可以分为:国内信贷、国外资产和其他资产,但具体构成却并不完全相同。首先来看中国人民银行的总资产构成,其国外资产包括外汇、货币性黄金和其他国外资产;国内信贷包括对政府(基本上是中央政府)、其他存款性公司、其他金融性和非金融性公司的债权。再来看美联储的情况。对其总资产作类似的分类,国外资产来自于其资产负债表中的其他资产和黄金账户;国内信贷包含的项目较多,包括证券、回购协议、对各种机构的贷款以及几家公司的债权;其他资产包括硬币、银行房产等余项。 从负债项目来看,中美两国央行总负债大致包括:国内债券、国外债券、其他负债和自有资金。主要不同体现在国内负债项目上,人民银行资产负债表中国内负债包括储备货币、发行货币、金融性公司存款、准备金存款、发行债券、政府存款,美联储资产负债表中的国内负债包括:流通中现金、存款机构的准备金、商业银行库存现金、支票存款与现金、联邦政府负债。 危机之后项目比重,结构变化不同。从资产规模上看,危机发生至2009年,人民银行资产负债表中资产总额增长了68%,而美联储资产负债表中总资产增幅则高达150% 从资产组成和贡献比重看,人民银行总资产中占比最大的是外汇储备,从2007年底的68%上升至2009年底的77%,而美联储总资产中比重最大的是国内信贷,从2007年的83%上升至2009年的90%。 从负债组成和比重上看,人民银行基础货币比重在60%左右,发行债券在20%左右,而美联储基础货币占比一直保持在90%以上 首先来看中国人民银行。人行总资产自2007 以来的增长相比之前数年并没有出现跳跃,实际上是以前年份里增长的延续。在国外资产中,货币性黄金是一个持续稳定的量;外汇和其他外国资产是国外资产增长的原
资产负债表的分析报告(案例分析)
For personal use only in study and research; not for commercial use 某服务性企业2008年的资产负债表分析 一、资产规模和资产结构分析
(一)资产规模分析: 从上表可以看出,该公司的非流动资产的比重56.09%远远高于流动资产比重43.58%,说明该企业非流动资产周转缓慢,变现能力低,增大了企业的经营风险,削弱了企业的应变能力。 流动资产的比重,由20.90%上升到43.58%,非流动资产的比重由78.58%下降到56.09%,说明企业的抗风险能力和变现能力提高了,企业创造利润和发展机会也增强了,加速资金周转的潜力较大。 (二)资产结构分析
从上表可以看出,非流动资产占总资产的比重为56.09%,说明企业的非流动资产比重较高,进一步说明了企业的非流动资产周转缓慢,变现能力较低,增大企业经营风险,削弱企业的应变能力 流动资产占总资产比重为43.58%,比重较低,说明该企业的底子较厚,但灵活性较差。 流动负债占总负债的比重为100%,说明企业对短期资金的依耐性很强,从而企业偿债的压力也就加大。 该企业的非流动资产的负债为0,说明该企业在经营过程中不借助外来长期资金。从而减轻的企业的偿债压力。 二、短期偿债能力指标分析 (一)营运资金分析 营运资金越多,说明偿债越有保障企业的短期偿债能力越强。债权人收回债权的机率就越高。因此,营运资金的多少可以反映偿还短期债务的能力。 应该注意,营运资本指标必须与过去期间的营运资本指标相比才能衡量指标的合理性,但要注意企业规模的扩大和缩小问题,如果营运资本显得不正常,过高或是过低,就必须逐项分析流动资产和流动负债。 对该企业而言,年初的营运资金为-558268.1000 ,年末营运资金为-713021.9600 ,金额都为负,表明企业不能偿债的风险较大,而且与年初数相比减少了154753.8600 ,表明营运资金状况继续下降,而且还增大了不能偿债的风险。 但是,营运资金是流动资产与流动负债之差,是个绝对数,相比的意义很有限,不便于不同企业的比较,因此在务实中很少直接使用。 (二)流动比率分析
资产负债表水平分析表-参考
中国石油天然气股份公司
总资产的变动状况: 可以看到,流动资产增加了亿元人民币,增长的幅度为%,而非流动资产增加了亿元,增长幅度仅 为%,本期中石油的资产流动性显着提高。 一、总资产变动情况 1、流动资产本期增加68257百万元,增长的幅度为%,使总资产规模增长了%。非流动资产本期增加了185523百万元,增长的幅度为%,使总资产规模增长了%,两者合计使总资产增长了253780百万元,增长幅度为%。 2、本期总资产的增长主要体现在非流动资产的增长上,原因是投资的增加。主要体现在三个方面:一是固定资产的增长。固定资产本期增长75,276百万元,增长幅度为%,对总资产的影响为%。固定资产的增加主要由在建工程转入所致,计提折旧主要导致了固定资产的减少,总体看该公司的生产能力有增加。二是在建工程的增长。在建工程本期增长52,243百万元,增长的幅度%,对总资产的影响为%。在建工程的增加一方面可加强企业的生产能力,一方面会增加企业的负债。三是油气资产的增长。油气资产本期增长46,369百万元,增长幅度为%,对总资产的影响为%。该项目的减少主要是因为计提的折耗,这部分的增长对中国石油的未来经营有积极作用。 3、流动资产的变动主要体现在三个方面:一是货币资金的增长。货币资金本期增长42,199百万元,增长幅度为%,对总资产的影响为%。二是存货的增长。该项目本期增长24,096百万元,增长幅度为%,对总资产的影响为%。由于固定资产的增长,提高了企业的生产能力,导致存货增加。三是应收账款的增加。应收账款本期增长11,975百万元,增长的幅度为%,对总资产的影响为%。在2008年度及2009年度,该企业未发生重大的应收账款坏账准备核销,说明该企业资金周转良好。可得出,流动资产增加主要是现金及现金等价物的增长。 二、权益总额的变动情况 1、负债本期增加194,108百万元,增长的幅度为%,使权益总额增长了%;股东权益本期增加了59,672百万元,增长的幅度为%,使权益总额增长了%,两者合计使权益总额本期增加了253,780百万元,增长幅度为%。
资产负债表分析案例
资产负债表分析案例 资料中给出的表格为公司2011年12月31日的合并资产负债表。本文从以下三个方面进行分析,并对企业的管理给出几点建议。 一、资产负债表结构分析 1.资产结构分析 表1:资产结构表 从表1我们可以看出,公司流动资产合计占资产总计的比例为68.86%,非流动资产总计占资产总计的比例为31.41%,公司流动资产比重较高,非流动资产比重较低。流动资产比重较高会占用大量资金,降低流动资产周转率,从而影响企业的资金利用效率。非流动资产比例过低会影响企业的获利能力,从而影响企业未来的发展。 2.负债与权益结构分析 表2:负债与权益结构表 单位:万元 从表2中我们可以看出公司流动负债占资本总计的18.02%,长期负债占资本总计的18.44%,所有者权益占资本总计的63.54%。由此我们得出,公司的债务资本比例为36.46%,权益资本比例为63.54%,公司负债资本较低,权益资本较高。低负债资本、高权益资本可以降低企业财务风险,减少企业发生债务危机的比率,但是会增加企业资本成本,不能有效发挥债务资本的财务杠杆效益。
3.资产与负债匹配分析 通过公司资产与负债匹配结构图我们可以看出,公司资产与负债的匹配方式为稳健型的匹配结构,在这一结构形式中,企业长期资产的资金需要依靠长期资金来解决,短期资产的资金需要则使用长期资金和短期资金共同解决(见表3)。在稳健型的匹配结构下,公司融资风险相对较小,融资成本较高,因此股东的收益水平也就不高。 二、资产构成要素分析 企业总资产为65089万元,其中流动性资产为44820万元,占资产总额的比例为68.86%;非流动资产为20269万元,占据的资产份额为31.14%。具体构成情况见表4: 表4:资产构成表 单位:万元 通过对企业资产各要素的数据仔细分析可以发现,企业的资产构成要素存在
美联储资产负债表继续扩张
The Federal Reserve's enormous balance sheet is growing, even after having accomplished some of its major goals. It isn't likely to stop soon, either. The Fed is due to provide its weekly balance-sheet update after the market closes on Thursday. Recently, the assets held by the Fed have crept up to $2.2 trillion, the highest since the depths of the financial crisis a year ago. The balance sheet has more than doubled since just before the crisis began. It swelled first thanks to the Fed's alphabet soup of lending programs and then to its massive purchases of Treasury bonds, mortgage-backed securities and the debt of government-backed mortgage agencies. This debt-gathering frenzy had two goals: rescue the financial system and ease the sting of a deep recession. With the financial system once again apparently in fine fettle, and economists declaring that the recession ended in June, it is reasonable to ask why the balance sheet is still growing. Some observers warn that the bulging balance sheet will lead to an eruption of hyperinflation, based on economist Milton Friedman's assertion that 'inflation is always and everywhere a monetary phenomenon.' The Fed's rising balance sheet has pushed the U.S. monetary base -- which includes bank reserves and hard cash -- to nearly $2 trillion. U.S. banks have excess reserves of more than $1 trillion. Both eye-watering figures are near records set earlier in November. The Fed is also due to update these numbers on Thursday afternoon. For better or worse, however, this money flood that worries inflation hawks hasn't been flowing into the real economy where it could alter the inflation outlook. The Fed's 'beige book' compilation of economic anecdotes, released Wednesday, described a credit market in which lenders are still reluctant to lend and few borrowers are demanding loans. 'The balance sheet hasn't directly helped the guy on street,' says David Ader, head of government-bond strategy at CRT Capital. 'The banks are a Hoover Dam on its liquidity.' That is in part why the recovery is still anemic, as evidenced by 10.2% unemployment and still-shaky housing -- giving the Fed room and reason to keep money easy. 尽 管美联储(Federal Reserve)已经实现了一些重要目标,但它的巨额资产负债表仍在扩张,也不太可能很快停下来。
央行资产负债表分析报告
报告课题: 比较中美两国央行资产负债表规模,解释我国央行资产的膨胀原因,并分析其利弊。 报告结构: 一、比较中美两国央行资产负债表数据 二、我国央行资产膨胀的原因 三、资产巨无霸的利与弊 四、“最大”如何变成“最强”——优化我国中央银行资产负债总量与结构的对策 五、附录:2016年4月中美两国央行资产负债表 一、) 二、比较中美两国央行资产负债表数据 1.中国人民银行资产负债表特点 中央银行资产主要分为贷款和投资两大类。其中,贷款又可分为对政府的贷款和对金融机构的贷款(主要是商业银行),投资可分为对政府的投资和对外国官方机构的投资。中央银行的主要负债项目有中央银行发行的通货(纸币和硬币)、存款(商业银行等金融机构、政府等)和借入资金(中央银行发行的债券,例如央行票据等)。 具体地,中国人民银行资产负债表具有以下特点: 1)2016年,中国人民银行的资产负债表的规模世界第一,截止4月末,人民银行总资产 规模为32万亿元,折合约5万亿美元;同期美联储总资产规模为万亿美元。 2)人民银行的资产规模持续处于扩张状态,但增速相比之前有所放缓。 3)外汇:人民银行国外资产持续增加,截至2016年4月末,国外资产规模为24万亿元, 占资产总额%。近四年来我国外汇占款的增长速度有所放缓,但外汇占款规模仍然较大。 后将细述。
4)对政府债权:2016年4月末对政府债权万亿元,占总资产的比重为%。 5)对其他存款性公司债权:对其他存款性公司债权为人民银行向商业银行发放的再贷款、 再贴现等融资形成的债权。2016年4月末对其他存款性公司债权万亿元,占总资产的比重为%。上世纪80年代到90年代,再贷款及再贴现是人民银行投放基础货币的重要渠道,因而人民银行对存款性公司的这类债权占总资产的比重非常高。近十多年来该比重大幅回落的原因与外汇占款项目的迅速上升有关,反映了基础货币供应结构的巨大变化。这些变化也反映了我国商业银行经营机制的转变,银行更多从市场融资,而非依赖于中央银行。“其他存款性公司债权”项目占比下降,反映了中央银行减少了通过再贷款、再贴现方式进行宏观调控。“其他金融公司债权”数额和比重均呈下行走势,说明中央银行运用资金方式对资产管理公司、信托公司等非存款金融机构调控力度在减弱。 6)) 7)其他存款性公司存款:人民银行负债项目中,最主要的是其他存款性公司存款。 1993-2014年6月末,其他存款性公司存款占总负债的比重从%提高到%。随着经济发展,存款类金融资产和银行体系资产规模持续稳定增长,带动了银行体系准备金存款的增长,其他存款性公司存款成为央行贯彻货币政策意图的重要工具。
美联储资产负债表分析
一、资产类项目分析 1.总资产增长率对比 通过对美联储和中国人民银行近八年来总资产增长速度的统计,我们发现,中国人民银行的总资产增长率大部分年份为正值,说明中国人民银行的总资产基本上呈现不断增长的趋势,相比而言,美联储在2008年以外的年份里,总资产增长率较低,且时正时负,说明美联储的总资产增长态势不是很明显。但是,值得注意的是,在2008年金融危机爆发之际,美联储总资产增长率在3、4季度迅速拉升,全年总资产增长率高于100%,相比而言,中国人民银行并没有表现出太大的变化来,依然保持以外的增长率在增长。由统计数据可知,金融危机对于美国的冲击迫使美联储大幅度增加流动性供给,而我国由于金融危机冲击较小,得以保持较低的增长率。
2.美联储各类资产总额分析
在金融危机之前,各项资产所占比例变化不大,但金融危机改变了这一切。2007年下半年以来,美国次贷危机愈演愈烈,为市场提供流动性,恢复市场信心美联储为应对金融危机采取了大量拯救措施,从图表中我们可以清晰地看出在次贷危机期间各项资产都有一个较大的变化。联储一手通过多种创新工具向市场投放流动性,一手用卖出国债的方式回收流动性。1.在金融危机之后可以从国内信贷的结构变化看出,直接持有债券的比例大幅下降。2.新资产项目显著增多、数额巨大。可以在其他资产的变化中看出自从09年央行流动性互换的新项目被提出,在金融危机之后的恢复阶段,几乎占了所有的其他资产,为恢复期做出了巨大的贡献。
3.国内信贷变化分析 从上图可以看出,美国资产的重头集中于国内信贷部分,自金融危机爆发至今,其国内信贷增长趋势与资产项目增长趋势极为相似,其中直接持有证劵部分的增长与国内信贷的增长有很大的相关性,分析原因如下: 1.美国政府持续推行QE量化宽松政策。扩大货币发行,减少银行压力,放松银根,来向市场注入大量的流动性以复苏经济。在金融危机全面爆发之后,美联储通过一系列救市政策增加相当规模的基础
教你分析资产负债表(案例)
教你分析资产负债表(案例) 当你面对客户递交的财务报表时是否有一种无所适从的沉重感?迷茫和焦虑瞬间涌上你的大脑?好吧,是时候拯救你的脑细胞了。 资料中给出的表格为公司2011年12月31日的合并资产负债表。本文从以下三个方面进行分析,并对企业的管理给出几点建议。 一、资产负债表结构分析 1.资产结构分析 从表1我们可以看出,公司流动资产合计占资产总计的比例为68.86%,非流动资产总计占资产总计的比例为31.41%,公司流动资产比重较高,非流动资产比重较低。流动资产比重较高会占用大量资金,降低流动资产周转率,从而影响企业的资金利用效率。非流动资产比例过低会影响企业的获利能力,从而影响企业未来的发展。 2.负债与权益结构分析 从表2中我们可以看出公司流动负债占资本总计的18.02%,长期负债占资本总计的18.44%,所有者权益占资本总计的63.54%。由此我们得出,公司的债务资本比例为36.46%,权益资本比例为63.54%,公司负债资本较低,权益资本较高。低负债资本、高权益资本可以降低企业财务风险,减少企业发生债务危机的比率,但是会增加企业资本成本,不能有效发挥债务资本的财务杠杆效益。 3.资产与负债匹配分析 通过公司资产与负债匹配结构图我们可以看出,公司资产与负债的匹配方式为稳健型的匹配结构,在这一结构形式中,企业长期资产的资金需要依靠长期资金来解决,短期资产的资金需要则使用长期资金和短期资金共同解决(见表3)。在稳健型的匹配结构下,公司融资风险相对较小,融资成本较高,因此股东的收益水平也就不高。 二、资产构成要素分析 企业总资产为65089万元,其中流动性资产为44820万元,占资产总额的比例为68.86%;非流动资产为20269万元,占据的资产份额为31.14%。具体构成情况见表4 通过对企业资产各要素的数据仔细分析可以发现,企业的资产构成要素存在以下问题: 1.现金金额较大企业货币资金的金额为8437万元,占资产总额的1 2.96%。这个表明企业的货币资金持有规模偏大。过高的货币资金持有量会浪费企业的投资机会,增加企业的筹资资
美联储缩表的影响分析
美联储缩表的影响分析 美联储未来资产规模和 构成的预估 关于美联储缩表最不确定、争议最大的是美联储未来计划维持的资产量。总的来看,它不可能缩减到金融危机以前的规模;目前包括美联储在内的各方意见更倾向于维持相对大的规模。 从美联储资产占GDP比值看,衡量美联储资产合理性的不仅有绝对量,还有占GDP比值。据哈佛大学教授弗格森等人对12家发达经济体央行资产负债表规模研究发现:这些央行资产占GDP比值通常在10%~20%。而美联储历史上发生过的缩表相对规模一般是回落并稳定在6%左右。目前美联储资产占GDP比值为25%,高于大萧条和第二次世界大战时的22%。因此预计本次缩表计划的目标是将该比值下降到10%以下。按此推算至少需缩减2.7万亿美元资产,包括1.7万亿美元的抵押支持债券和近1万亿美元的国债。 从美联储负债规模看,美联储负债包括流通中通货、银行储备金和其他非货币负债。前两者构成基础货币。其中通货的变化相对确定并且被动,因此决定资产负债表规模的主要且更不确定变量是银行储备金合理水平。
通货和银行储备金这两个项目在未来不可能缩减到危机前,至于规模大小则取决于以下因素:首先,未来十年随着名义GDP上升、低利率以及全球美元需求上升,通货规模可能在未来十年间升至2.5万亿美元以上。其次,随着美联储缩表,银行流动性减少,其在美联储的储备金也会减少。但在美联储持续对储备金付息情况下,银行储备金不可能大幅减少。此外银行储备金在一定程度上也受到监管,即银行必须维持一定比例流动性资产要求的影响。因此储备金估计至少在0.1万亿~1万亿美元。 从美联储实施货币政策和维持金融稳定看,维持相对大的资产负债表或许有助于实施货币政策和维持金融稳定。 其一,危机后随着储备金大幅上升,联邦基金市场萎缩,美联储的利率政策执行机制也相应地从公开市场操作转向综合利率框架,其中储备金利率成为联邦基金利率区间上端。美联储若打算完全回归公开市场模式,则在缩表完成后,超额储备金也随之回到0;美联储若继续采用现有机制,并且进一步向常规利率走廊模式过渡,则必须维持足够量的超额储备金和资产规模。这两种模式都被实践证明为合理有效。 其二,应对危机的实践显示美联储维持足够多的资产有助于维护金融市场特别是货币市场稳定。资产负债表在未来特别是在衰退期很可能更加频繁地作为货币政策工具使用,
资产负债表对宏观经济的影响分析
资产负债表对宏观经济的影响 分析 2017年,美联储公布3月份货币政策例会纪要显示,只要美国经济增长表现继续符合美联储预期,大多数美联储官员认为今年晚些时候可能适合开始缩减资产负债表。这是美联储首次就缩减资产负债表的时机作出明确表态。 如果首次听到“缩表”这个词儿,可能会感到莫名其妙。那么,缩表到底是什么?会对美国经济,全球经济造成什么样的影响? “表”是指中央银行的资产负债表,“缩表”意思是中央银行主动缩减资产负债表规模的行为。对于中央银行来说,有左侧资产的增进,才能有右侧负债的跟进,而资产的规模则决定着央行货币政策的空间与尺度。 2008年之后,为提振经济复苏,美联储开启三轮量化宽松,印钞购买债券,为实体经济注入流动性,同时资产负债表大幅膨胀,而资产负债表的规模,大致对应着基础货币的规模,货币成倍数放大,就得到广义货币供应量。“缩表”意味着要将资产与负债两端降下来,实现货币政策正常化,回收流动性,从国际上将美元抽回,加速新兴经济体资本外流,更重要的会对高杠杆高负债国家造成更大冲击。下图是2002年迄今美联储资产负债表规模变动情况。
图 1 美国GDP与美联储资产变动 从2009年到2014年,美联储进入市场大量购买国债和MBS,将其资产负债表规模从2007年的9000亿美元急剧扩张到2014年底的4.5万亿美元左右。 图 2 美国基础货币存量与环比增速
从基础货币的环比增速来看,自从08年量化以来,货币增速波动率明显增大。但近年随着国内经济转暖,就业上升,失业率稳定,美联储也希望尽早将货币政策回归正常,同时回收因QE而投放的过多流动性,强美元以引资本回流。 由于美元在全球货币体系中处于核心地位,各新兴经济体的汇率都主要盯住美元。无论是美联储加息抑或缩表,对新兴经济体的汇率会造成冲击。同时对于所有美元计价物来说,美元总量的变少会导致美元更贵,而资产价格更低。所以美联储缩表会导致所有资产的重估。 实际上,缩表要比加息的影响大得多,加息从狭义上来看只是通过刺激美元强势,引导资本回流的一个间接工具。但一旦缩表,意味着所有本国汇率盯住美元的经济体,外汇储备以美国各种债的经济体会受到实实在在的直接打击:或被动缩表——资产端的美债被回购,外汇储备下降压缩货币政策的空间;或汇率崩溃——资本外流加速,本币贬值预期自循环。货币空间压缩+外汇贬值持续,导致的是货币信用坍塌。叠加下行的经济周期与债务高杠杆的内部环境,货币政策无效,债务又无法有效转移消化,则很容易造成经济危机的出现。 为避免出现货币内外两难困境,央行也不得不先收紧流动性,控制资本外流,调整资产端资产结构。 再来看中国情况,央行资产端最大一项即是外汇储备。可以说外汇储备的多少可以直接影响到货币政策的空间与弹性。