关于谐波Load Pull技术的综述
116 June 2013
1527-3342/13/$31.00?2013IEEE Digital Object Identifier 10.1109/MMM.2013.2248631
Andrea Ferrero (andrea.ferrero@polito.it) and Marco Pirola are with the Electronic and
Telecommunication Department, Politecnico di Torino, Turin, Italy.
Date of publication: 7 May 2013
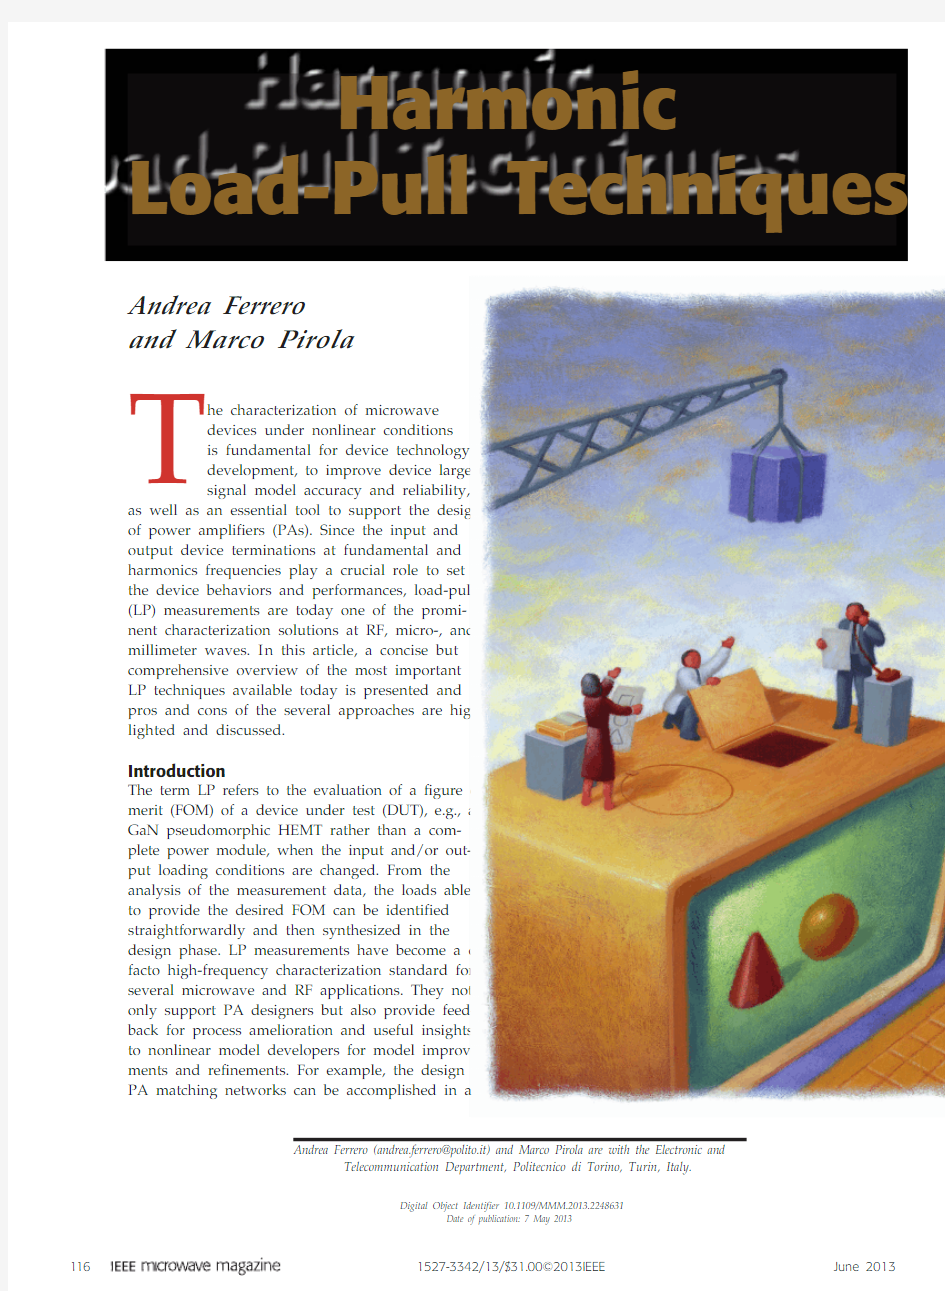
Harmonic
Load-Pull Techniques
T
he characterization of microwave devices under nonlinear conditions is fundamental for device technology development, to improve device large signal model accuracy and reliability,
as well as an essential tool to support the design of power amplifiers (PAs). Since the input and output device terminations at fundamental and harmonics frequencies play a crucial role to set the device behaviors and performances, load-pull (LP) measurements are today one of the promi-nent characterization solutions at RF, micro-, and millimeter waves. I n this article, a concise but comprehensive overview of the most important LP techniques available today is presented and pros and cons of the several approaches are high-lighted and discussed.
Introduction
The term LP refers to the evaluation of a figure of merit (FOM) of a device under test (DUT), e.g., a GaN pseudomorphic HEMT rather than a com-plete power module, when the input and/or out-put loading conditions are changed. From the analysis of the measurement data, the loads able to provide the desired FOM can be identified straightforwardly and then synthesized in the design phase. LP measurements have become a de facto high-frequency characterization standard for several microwave and RF applications. They not only support PA designers but also provide feed-back for process amelioration and useful insights to nonlinear model developers for model improve-ments and refinements. For example, the design of PA matching networks can be accomplished in a
Andrea Ferrero and Marco Pirola
June 2013 117
single round with a high degree of success if proper LP data are available.
Since 1972, when Cusack et al. [1] introduced the first computer-assisted mechanical tuner, measure-ment systems and control software have evolved seamlessly into integrated hardware–software plat-forms suitable for the characterization of nonlinear DUTs. The manual or automatic test sets that measure
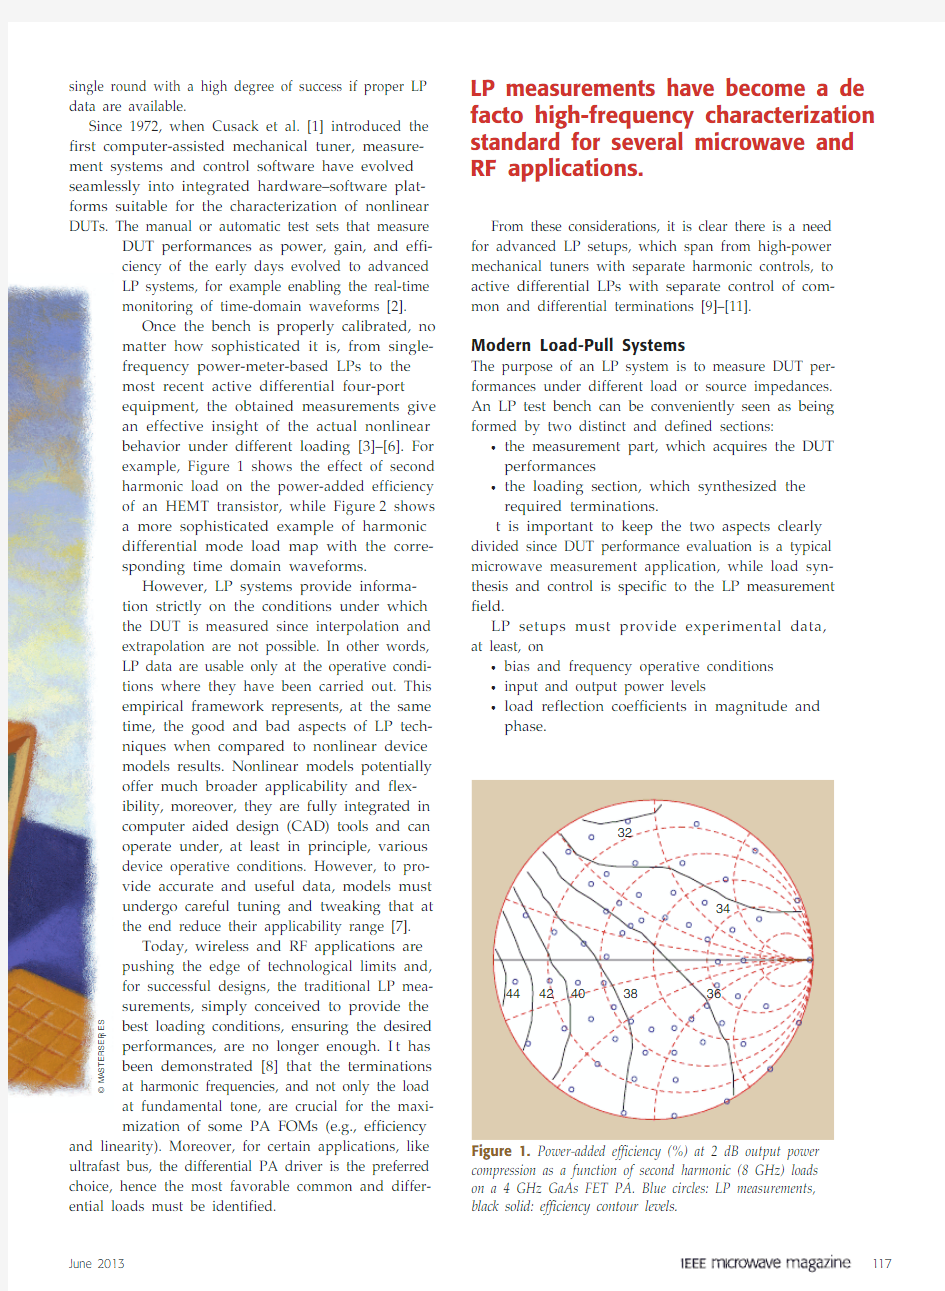
DUT performances as power, gain, and effi-ciency of the early days evolved to advanced LP systems, for example enabling the real-time monitoring of time-domain waveforms [2].Once the bench is properly calibrated, no matter how sophisticated it is, from single-frequency power-meter-based LPs to the most recent active differential four-port equipment, the obtained measurements give an effective insight of the actual nonlinear behavior under different loading [3]–[6]. For example, Figure 1 shows the effect of second harmonic load on the power-added efficiency of an HEMT transistor, while Figure 2 shows a more sophisticated example of harmonic differential mode load map with the corre-sponding time domain waveforms.
However, LP systems provide informa-tion strictly on the conditions under which the DUT is measured since interpolation and extrapolation are not possible. In other words, LP data are usable only at the operative condi-tions where they have been carried out. This empirical framework represents, at the same time, the good and bad aspects of LP tech-niques when compared to nonlinear device models results. Nonlinear models potentially offer much broader applicability and flex-ibility, moreover, they are fully integrated in computer aided design (CAD) tools and can operate under, at least in principle, various device operative conditions. However, to pro-vide accurate and useful data, models must undergo careful tuning and tweaking that at the end reduce their applicability range [7].Today, wireless and RF applications are pushing the edge of technological limits and, for successful designs, the traditional LP mea-surements, simply conceived to provide the best loading conditions, ensuring the desired performances, are no longer enough. I t has been demonstrated [8] that the terminations at harmonic frequencies, and not only the load at fundamental tone, are crucial for the maxi-mization of some PA FOMs (e.g., efficiency
and linearity). Moreover, for certain applications, like ultrafast bus, the differential PA driver is the preferred choice, hence the most favorable common and differ-ential loads must be identified.
From these considerations, it is clear there is a need for advanced LP setups, which span from high-power mechanical tuners with separate harmonic controls, to active differential LPs with separate control of com-mon and differential terminations [9]–[11].
Modern Load-Pull Systems
The purpose of an LP system is to measure DUT per-formances under different load or source impedances. An LP test bench can be conveniently seen as being formed by two distinct and defined sections:
?the measurement part, which acquires the DUT performances
?the loading section, which synthesized the required terminations.
t is important to keep the two aspects clearly divided since DUT performance evaluation is a typical microwave measurement application, while load syn-thesis and control is specific to the LP measurement field.
LP setups must provide experimental data, at least, on
?bias and frequency operative conditions ?input and output power levels
?load reflection coefficients in magnitude and phase.
Figure 1. Power-added efficiency (%) at 2 dB output power compression as a function of second harmonic (8 GHz) loads on a 4 GHz GaAs FET PA. Blue circles: LP measurements,
black solid: efficiency contour levels.
? m a s t e r s e r i e s
LP measurements have become a de facto high-frequency characterization standard for several microwave and RF applications.
? m a s t e r s e r i e s
118
June 2013
Originally, LP systems were based on power meters
and mechanical tuners, as shown in Figure 3, where
a pair of power meters is used to monitor the input
and output power levels. All test bench components
(e.g., cables, transition, and couplers) are precharacter-ized, while tuners are measured at several frequen-cies under many possible states with a lengthy and
bulky precalibration procedure by a vector network
analyzer (VNA). When performing the DUT measure-ments, the controlling software de-embeds all the lin-ear parts and uses the tuner lookup table to compute the impedance shown at the DUT ports. This system precalibration can be considered the Achilles’ heel of traditional LPs, since the accuracy strongly depends on how close the effective measurement conditions are to the ones experienced during the calibration; furthermore, only the acquired tuner states can be actually used. Another issue for the overall accuracy is the output power meter position which, as shown in Figure 3, is cascaded to the mechanical tuner. This arrangement is particularly critical for highly reflec-tive loads, i.e., close to open or short circuits, since the rather poor tuner transmission toward the power meter results in a system-reduced dynamic range [12].
Recently, these limitations have been surpassed by the commercial introduction of real-time LP and,
today, all the modern test benches
are based on this strategy [13]–[15].
Although known since the 1980s
[16], [17], modern real-time or vector
receiver LP systems have ultralow-loss couplers between the DUT refer-ence plane and the tuners, as shown in
Figure 4. Now the VNA is used for the measurement of the impedance pre-sented at the DUT and for the power
levels [18]. I n this way, real-time LPs have vector measurement capability,
and the setup calibration is fast and
broadband since the same methodol-ogy established for VNAs is adopted. One of the most relevant aspects of
this approach is that tuner and system
block precalibrations are no longer required, since the loads at the DUT ports are measured in real time dur-ing the DUT characterization.The VNA is also used to acquire the absolute power levels, while a power meter is only required for the calibra-tion. This feature is extremely impor-tant since VNAs have a much higher Figure 3. Passive LP.Microwave Source Input Variable
Attenuator
Input Amplifier Power Meter Power Meter Power
Meter
Input Tuner
Output Tuner
Port 1Port 2
DUT VNA
P1P2
Input Load
Output Load
Figure 4. Real-time LP.
D i f -D i f f e r e n t i a l C u r r e n t (m A -2210-11
24.7 dBm 27.3 dBm 2)
1m Load at Second
Harmonic
Figure 2. An example of time domain differential harmonic LP. Fundamental
frequency 1 GHz. Voltage and current waveform for two values of second
harmonic load.
LP data are usable only at the
operative conditions where they have been carried out.
June 2013 119
dynamic range than power meters, and it has been demonstrated that the overall measurement accuracy is at least one order of magnitude higher than those of traditional solutions [12]. Accuracy is fundamental to successfully use an LP system for the optimization of the amplifier performances because the characteriza-tion of a modern transistor with large gate periphery, which typically has highly reflective reflection coef-ficients .,09>L C ^h emphasizes any small residual calibration uncertainty [12]. This problem is further stressed when high-power-added efficiencies (>80%) at very high C must be measured. In this case, real-time LPs are the only possible solution since power-added efficiency uncertainties of a few % are almost impossible to achieve with traditional power-meter-based LP systems [19]. Low-loss directional couplers are key components of these novel LP setups because conventional tuners can be adopted without compro-mising the possibility of synthesizing highly reflec-tive loads. Coupler behavior and performances play a decisive role not only in terms of insertion loss, but also concerning directivity, coupling, return loss, and stability behavior, which must be ensured across the whole frequency band. Although systematic uncer-tainties, hence coupler effects, can be accounted for, and thus removed with the bench calibration, good hardware is mandatory to reach the desired measure-ment stability and repeatability [19]. Today, ultralow loss couplers have insertion loss below 0.25 dB and flat coupling up to 35 GHz [20].
Besides the couplers, there are several different solutions on the receiver side: from PCI extensions for instrumentation (PXI )-based VNAs to time domain receivers with high-speed sampling scopes [6], [21]. The simpler and more economic approach is adopting a conventional VNA with a direct sampler/mixer access option [13]. If an external switch unit is added to increase the effective number of receiver channels, the measurement of other quantities such as the source reflection coefficient S C can be also carried out [15]. Figure 5 shows an example of a real-time-based system. All real-time LPs typically are able to provide harmonic measurements of reflection coeffi-cients at the input and output and, if a proper phase reference unit is available, time domain waveforms also can be acquired [4]. Table 1 presents a comparison of the main measurement features of traditional and real-time systems.
Automatic Load Technologies
Today, load technology spans from modern tuners with multiple slugs to innovative active loads. The common specifications are ?frequency range
?harmonic tuning capabilities ?maximum power handling
?maximum voltage standing wave ratio (VSWR).
Switch Unit
Loop Amp Loop Unit
Couplers Source
DUT
VNA
Figure 5. A real-time LP with an active loop. (Photo
courtesy of HFE.)
When performing the DUT
measurements, the controlling software de-embeds all the linear parts and uses the tuner lookup table to compute the impedance shown at the DUT ports.
120 June 2013
There are three main load technologies available on the market today:
?mechanical tuner ?open-loop active load ?closed-loop active load.
Mechanical tuners have been the first solution adopted to automatically change impedance in an LP test bench. They rely on one or multiple slugs inside an airline. A set of stepper motors accurately move the slugs along the airline as well as push the slugs close to the center conductor, as shown in Figure 6. Horizontal and vertical slug motions change the reflection coef-ficient phase and amplitude, respectively. Tuner tech-nology has greatly improved in the last 20 years, from single-slug systems to the sophisticated multislug harmonic tuners of today. In most recent tuners, sev-eral slugs are present with different frequency behav-ior. Different impedances at fundamental frequency and harmonics can thus be independently synthe-sized [22]. An example of a modern harmonic tuner is shown in Figure 7. Since the different slugs interact, to independently control each harmonic impedance, a sophisticated software is required, which accounts for the multidimentional tuner map, and synthesizes the desired impedances.
A lt houg h moder n t u ners ca n sy nt he si ze almost purely reactive reflection coefficients (Max
VSWR > 200), the presence of cables, fixtures, probes,
and connector losses reduces the maximum achiev-able reflection coefficient at the DUT reference planes. Since losses increase with frequency, this issue is more marked at millimeter-wave but it is, however, important at wireless bands where the characteriza-tion of high-power transistors with sub-ohm match-ing impedance is normal. Furthermore, when on-wafer LP measurements are needed, since vibrations due to mechanical tuners are unacceptable, a coaxial cable must be placed between the probe and the tuner, which again negatively affects the maximum attain-able reflections.
For these reasons, the active load techniques have been introduced. From the original Takayama and Bava works [23], [24], the active load technology has reached the multiharmonic solutions available today. The working principle of an open-loop active solution is the injection at the load side of a signal generated from an independent source that can be controlled in magnitude and phase. The original idea used the main signal generator followed by a splitter and a controlling network, as shown in Figure 8, while in
Slug
Movement Phase Control
Electrical Equivalent
L 1
L 2
L 3L 3
Z
The working principle of a mechanical tuner.
Mechanical tuners have been the first solutions adopted to automatically change impedance in an LP test bench.
First Harm Slug
Second Harm Slug
Third Harm Slug Fourth
Harm Slug I/O Coax
Figure 7. A modern multiharmonic tuner. (Photo courtesy of Focus Microwaves.)
DUT
Figure 8. An active open-loop concept. The backward wave is obtained by attenuating and shifting the source signal.
June 2013 121
today’s active loads, several independent
phase-locked synthesizers are typically used [25] (Figure 9). Each source has an independent control of phase and mag-nitude of its output signal, thus a set of
backward waves at harmonic frequencies is obtained and different harmonic loads
are synthesized (Figure 9). The backward
wave, set by the generators, is indepen-dent from the incident one, therefore, if for any reason the DUT output power changes, the load moves. In other words,
this approach does not synthesize an actual load but instead ensures a constant and well-defined ratio between the back-ward and forward wave. This is a major
drawback. For example, if a load close to
the edge of the Smith chart is set with the device already in compression and the
input power is reduced, the load seen by the DUT can
exit the Smith chart causing DUT damages if no cor-rective control actions are undertaken. Even if today’s
active open loops are controlled by sophisticated
algorithms that measure the effective DUT loads
and automatically operate to keep it inside the Smith
chart, the control latency time is questionable when
very highly reflective loads are required.
The closed-loop technology is the other commer-cial solution available for active load synthesization. In
this case, the backward wave is obtained from the inci-dent one through a directional coupler placed at the DUT output, as shown in Figure 10. With the closed loop approach, feedback is created and the active load behaves at any effect as a frequency selective passive tuner, where the backward wave is linearly linked to the incident one. The main issue of this technology is
related to oscillations, which can affect the system. This problem was solved in the late 1990s with the inclusion
of losses inside the loop [26] and inserting a narrow-band filter (Figure 10). Thanks to these improvements, today’s systems are as reliable and oscillation free as the open-loop setups [15]. An example of commercial active load is shown in Figure 11. If more active loops are combined, a harmonic load is realized, as shown in Figure 12, where each loop is centered at a differ-ent frequency to independently control the harmonic
terminations.DUT
3f 0
2f 0
f 0
f 0
Figure 9. A multiharmonic open-loop active load. The backward signal is obtained by combining several independent sources controllable in magnitude and phase.
Variable Atten Coupler
Losses Amplifier Phase Shifter A VNA
C L = C · A · G · L · e j U
U a m f 0b m YIG Filter C G L Figure 10. The active-load-loop concept: the backward wave is obtained by attenuating and shifting the incident
one taken through the loop coupler.
Figure 11. A commercial active loop. (Photo courtesy of
HFE.)
122 June 2013
The main drawback of both active technologies is the high power required by the load amplifiers, which, to avoid undesired harmonic contributions, must work
under strictly linear conditions. Therefore, they must operate in strong back-off conditions and the maxi-mum power requirements may result in unsustain-able costs. For this reason, a mixed approach combin-ing a tuner with one or multiple active loads has been proposed (Figure 13). The tuner acts as a prematcher, reducing, under certain conditions, the loop ampli-fier power requirements [27]. This solution, however, requires a rather sophisticated software to indepen-dently control the modulus and phase of the harmonic terminations [28].
The tuning speed is another important param-eter to consider. Active, electronically controlled solutions clearly overcome traditional mechanical tuners. However, the cost effectiveness of modern multislug tuners offers a good compromise in term of costs and performances, especially for in-fixture high-power measurements. I nstead, concerning on-wafer characterization, vibration free, compact, and fast-active loads, which replace the bulky mechani-cal tuners on the prober, represent a clean and very effective solution.
The frequency range of all solutions span from the wireless range to millimeter wave in different band, while passive tuners are also available at lower fre-quencies (100 MHz).
Latest Developments
The latest development of harmonic LP techniques span from broadband LP on modulated signals to four-port time-domain differential LPs [6], [29]. Test-ing devices under complex modulated signals may offer a new view of their performances but the com-plexity of the system raises the cost because of the highly specialized hardware required [21]. The dif-ferential time domain LP represents the latest evolu-tion of real-time active loop systems. Here, a four-port
Figure 14. A four-port differential active LP system.
The closed-loop technology is the other commercial solution available for active load synthesization.
Variable Att
Coupler C L
Amplifier
Phase Shifter
YIG Filter
2f 0
f 0
Figure 12. A harmonic active closed-loop scheme.
C L
f 0
2f 0
C
Prematch Tuner Figure 13. An active loop with prematching tuner.
measurement system is built up with frequency and time-domain capability, along with the use of two or more active loads to independently control the com-mon and differential mode load at fundamental and harmonic frequencies, as shown in Figure 14. Again, the complexity of this system raises the costs, but the measurement capabilities of a four-port time/fre-quency domain differential LP is unsurpassed, and complex devices like mixers, differential driven cir-cuits, dual gate, or push-pull transistors can be char-acterized more easily and deeply.
Conclusions
An overview of modern harmonic LP technologies has been presented. Today’s LP systems offer pow-erful measurement capabilities for nonlinear charac-terization, and they represent a fundamental tool for supporting the design of high-power PAs or, more generally, nonlinear circuits at high frequencies. A final remark concerns the evolution of measurement technology that will bring LP characterization more and more embedded inside the modern fabrication and design flow.
Acknowledgments
The authors wish to thank Valeria Teppati of Politecnico di Torino, Cristos Tsironis of Focus Microwaves, and Marco Garelli of High Frequency Engineering (HFE) for the precious discussions and material. References
[1] J. Cusack, S. Perlow, and B. Perlman, “Automatic load contour
mapping for microwave power transistors,” IEEE Trans. Microwave Theory Tech., vol. MTT-2, pp. 1146–1152, Dec. 1974.
[2] P. J. Tasker and J. Benedikt, “Methods and apparatus for time-do-
main measurement with a high frequency circuit analyzer,” U.S.
Patent 6 639 393, Oct. 28, 2003.
[3] Z. Aboush, J. Lees, J. Benedikt, and P. Tasker, “Active harmonic
load-pull system for characterizing highly mismatched high pow-er transistors,” in IEEE MTT-S Symp. Dig., Long Beach, CA, June 2005, pp. 1311–1314.
[4] M. P. van der Heijden, D. M. H. Hartskeerl, I. Volokhine, V. Teppati,
and A. Ferrero, “Large-signal characterization of an 870 MHz in-verse class-F cross-coupled push-pull PA using active mixed-mode load-pull,” in Proc. Radio Frequency Integrated Circuits Symp., 2006 IEEE, San Francisco, CA, pp. 389–392.
[5] V. Camarchia, V. Teppati, S. Corbellini, and M. Pirola, “Microwave
Measurements—Part —Non-Linear Measurements”, EEE n-strum. & Meas. Mag., Vol. 10, no. 3, pp. 34-39, June 2007.
[6] V. Teppati, M. Garelli, V. Camarchia, A. Ferrero, and U. Pisani,
“Advanced load-pull techniques from single-ended to multiport/ differential measurement systems,” in Proc. European Microwave Week Workshop WSW6, Munchen, Oct. 2007, pp. 105–120.
[7] J. Verspecht, “Black box modelling of power transistors in the fre-
quency domain,” in Proc. INMMC ’96, Duisburg, Germany, 1996.
[8] P. Colantonio, F. Giannini, E. Limiti, and V. Teppati, “An approach
to harmonic load-and source-pull measurements for high-efficien-cy PA design,” IEEE Trans. Microwave Theory Tech., vol. MTT-52, no.
1, pp. 191–198, 2004.[9] Focus Microwave, I nc. (2012, Sept.). Appraising different load
pull approaches, MicroWaves and RF. [Online]. Available: http:// https://www.360docs.net/doc/e64789147.html,/active-components/appraising-different-load-pull-approaches.
[10] W. Liu and C. Tsironis, “Load pull characterization system for
differential devices,” in Proc. 62nd ARFTG Microwave Measurements Conf., Dec. 2003, pp. 201–204.
[11] A. Ferrero and V. Teppati, “A novel active differential/common-
mode load for true mixed-mode load-pull systems,” in Proc. int.
Microwave Symp., San Francisco, CA, June 2006, pp. 1456–1459. [12] V. Teppati and C. R. Bolognesi, “Evaluation and reduction of cali-
bration residual uncertainty in load-pull measurements at millim-eter-wave frequencies,” IEEE Trans. Instrum. Meas., vol. 61, no. 3, pp. 817–822, 2012.
[13] S. Dudkiewicz, “Vector-receiver load pull measurements,” Micro-
wave J., vol. 54, no. 2, pp. 88–98, 2011.
[14] M. Thorsell and K. Andersson, “Fast multiharmonic active load–
pull system with waveform measurement capabilities,” IEEE Trans. Microwave Theory Tech., vol. 60, no. 1, pp. 149–157, 2012. [15] HFE High Frequency Engineering. (2012). Application note 101.
Tech. Rep. [Online]. Available: https://www.360docs.net/doc/e64789147.html,
[16] R. B. Stancliff and D. B. Poulin, “Harmonic load-pull,” in Micro-
wave Symp. Dig., 1979 IEEE MTT-S Int. IEEE, 1979, pp. 185–187. [17] R. Tucker and P. Bradley, “Computer-aided error correction of
large-signal load pull measurements,” IEEE Trans. Microwave The-ory Tech., vol. MTT-32, pp. 296–300, Mar. 1984.
[18] A. Ferrero and U. Pisani, “An improved calibration technique for
on-wafer large-signal transistor characterization,” IEEE Trans. In-strum. Meas., vol. IM-47, pp. 360–364, Apr. 1993.
[19] B. Noori, “Advances and requirements of next generation high
power load-pull systems,” in 80th ARFTG Conf. Dig., Dec. 2012. [20] HFE High Frequency Engineering. (2012). Rtth35 ultra-low-loss di-
rectional coupler. Tech. Rep. [Online]. Available: https://www.360docs.net/doc/e64789147.html, [21] M. J. Pelk, W. C. Neo, J. R. Gajadharsing, R. S. Pengelly, and
L. C. N. de Vreede, “A high-efficiency 100-W GaN three-way Doherty amplifier for base-station applications,” IEEE Trans. Micro-wave Theory Tech., vol. MTT-56, no. 7, pp. 1582–1591, July 2008. [22] C. Tsironis, “Harmonic impedance tuner with four wideband
probes and method,” U.S. Patent 8 212 628, July 3, 2012.
[23] Y. Takayama, “A new load-pull characterization method for mi-
crowave power transistor,” in IEEE MTT-S Intl. Microwave Symp.
Dig., Cherry Hill, NJ, June 1976, pp. 218–220.
[24] G. P. Bava, U. Pisani, and V. Pozzolo, “Active load technique for
load-pull characterization at microwave frequencies,” Electron.
Lett., vol. 18, pp. 178–179, Feb. 1982.
[25] Z. Aboush, C. Jones, G. Knight, A. Sheikh, H. Lee, J. Lees, J. Ben-
edikt, and P. J. Tasker, “High power active harmonic load-pull system for characterization of high power 100-watt transistors,” in IEEE Microwave Conf., 2005 European, vol. 1, pp. 4.
[26] A. Ferrero, “Active load or source impedance synthesis apparatus
for measurement test set of microwave components and systems,”
U.S. Patent 6 509 743, June 12, 2000.
[27] V. Teppati, A. Ferrero, and U. Pisani, “Recent advances in real-
time load-pull systems,” IEEE Trans. Instr. Meas., vol. 57, no. 11, pp.
2640–2646, 2008.
[28] S. Bonino, V. Teppati, and A. Ferrero, “A novel methodology for
fast harmonic-load control with a passive tuner and an active loop,” in Microwave Symp. Dig., 2010 IEEE MTT-S Int., 2010, pp.
1158–1161.
[29] M. Marchetti, M. J. Pelk, K. Buisman, W. Neo, M. Spirito, and L. de
Vreede, “Active harmonic load–pull with realistic wideband com-munications signals,” IEEE Trans. Microwave Theory Tech., vol. 56, no. 12, pp. 2979–2988, 2008.
June 2013 123
建筑节能检测方法综述
建筑节能现场检测方法 田斌守 摘要本文综述了几种建筑物围护结构传热系数现场检测方法的原理、操作方法、适用条件,指出各种方法的优缺点及注意事项。 关键词建筑节能检测热流计法热箱法控温箱-热流计法非稳态法当今飞速发展的国民经济活动必然导致前所未有的资源能源消耗速度。而许多资源能源是不可再生的,为了人类的可持续发展,节约能源刻不容缓。据介绍,我国目前单位建筑面积采暖能耗相当于气候条件相近的发达国家的2~3倍,而建筑能耗也占全国能耗总量的27.5%。随着人民生活水平的不断提高、城市化进程的加快以及住房体制改革的深化,建筑能耗在我国增长趋势很大,很可能是我国今后能耗的一个主要增长点。为建设节约型社会,促进经济社会可持续发展,国家发展委员会发布了“节能中长期专项规划”,建筑节能作为三大重点领域中的一项,受到高度重视。建设部也相继发布了一系列建筑节能标准,其中包括若干强制性条款,目前正在建设领域逐步实施。 建筑节能工作从流程上可分为设计审查、现场检测、竣工验收三个大的阶段。对节能建筑的评价,从建设前期对施工图纸审查计算阶段、向现场检测和竣工验收转移是大势所趋。建筑节能现场检测也是落实建筑节能政策的重要保证手段。目前,全国范围内建筑节能检测都执行JGJ132-2001《采暖居住建筑节能检验标准》,它是最具权威性的检测方法,它的发布实施,为建筑节能政策的执行提供了一个科学的依据,使得建筑节能由传统的间接计算、目测定性评判到现在的直接测量,从此这项工作进入了由定性到定量、由间接到直接、由感性判断到科学检测的新阶段。 根据我们对建筑节能影响因素和现场检测的可实施性的分析,我们认为能够在实验室检测的宜在实验室检测(如门窗等作为产品在工程使用前后它的性状不会发生改变),除此之外,只有围护结构是在建造过程中形成的,对它的检测只能在现场进行。因此建筑节能现场检测最主要的项目是围护结构的传热系数,这也是最重要的项目。如何准确测量墙体传热系数是建筑节能现场检测验收的关键。目前对建筑节能现场检测的、围护结构(一般测外墙和屋顶、架空地板)的
关于产业技术创新的研究综述
经济研究导刊 ECONOMIC RESEARCH GUIDE 总第166期2012年第20期Serial No .166 No .20,2012一、技术创新的概念 经济学家约瑟夫·熊彼特在1912年出版的《经济发展理论》中第一次提出“创新”的概念:“创新是企业家对生产要素 的新的组合。” [1] 弗里曼(1973)认为,技术创新是技术、工艺商业化的过程,导致新产品的市场实现和首次商业性转化[2]。Bessant (2001)认为,技术创新是技术变革过程中发明之后的阶段[3]。美国国家科学基金会在1969年的研究报告中将创新定义为技术变革的集合;在1976年的报告中把模仿和不需要引入新技术的改进视为低层次的两种创新,划入技术创新的范畴[4]。傅家骥(1995)认为,技术创新是:从研究开发(R&D )到企业家抓住市场潜在机会,重新组合生产条件和生产要素,建立生产费用更低、能效更强、效率更高的生产经营的系统活动过程[5]。 曹萍等(2008)认为,技术创新是指企业根据市场需求、 竞争状况及自身条件,进行技术研究开发以满足市场需求的能力[6]。廖媛红(2009)指出,技术创新是对新产品、 新工艺、新服务以及上述各项改进的构想从闪现、研究到生产、销售,实现市场价值的全过程[7]。 综合上述观点,技术创新是技术和经济相结合的过程,是包括新构想的产生、研究开发到成果引入市场、商业化和应用扩散的一系列科学、技术和经营活动的全过程。 二、技术创新模式 自20世纪60年代至今,先后出现了五种具有代表性的技术创新模式。 1.技术推动的技术创新过程模式,是指创新主体通过研究开发得到新技术、新产品来开展技术创新活动,并通过生产和销售把新技术、新产品引入市场。在这种模式中,科技进 步或研究开发是技术创新的主要来源,市场只是被动的接受创新成果[8]。 2.需求拉动的技术创新过程模式,认为多数的技术创新是由社会和市场需求拉动的渐进性的过程,而不是技术推动的直接结果[9]。 3.技术推动与市场需求相互作用的模式,强调技术和市场的有机结合共同推动技术创新,把单一的技术创新模式视为科学、技术和市场交互作用的特例[10]。 4.技术创新一体化模式,认为技术创新过程包括构思、研究开发、生产以及营销等行为,强调研发和制造的一体化,以及企业和供应商之间的沟通联系[11]。 5.技术创新的网络模式是一体化模型的发展,强调合作企业之间更密切的联系和信息交换。随着技术的进步,技术创新过程的网络化已成为创新过程发展的趋势。 三、我国产业技术创新的现状 按照划分对象的层次不同,技术创新可划分为企业技术创新、产业技术创新和国家技术创新。产业技术创新是以企业技术创新为基础,推动整个产业进步,提高产业竞争力的过程[12]。国务院发展研究中心课题组(2007)指出,随经济社会发展,我国企业技术条件发展较快,部分企业已具备较好的创新基础和研发能力,但仍然缺乏技术型人才和核心技术[13]。肖虹(2007)通过对37个产业1999—2004年技术创新统计数据的研究,指出当前中国产业技术转化能力较弱,高新技术产业与非高科技产业对技术的转化能力不强[14]。 王健(2007)结合我国高新技术产业2000—2004年的指标值,认为我国高新技术产业在R&D 投入和产品占世界出口份额上与发达国家存在一定差距,对技术引进的消化吸收再创新能力也较为薄弱[15]。董瑜等(2011)的研究表明:我国的产业技术创新 收稿日期:2012-05-30 作者简介:王璐(1988-),女,安徽合肥人,硕士研究生,从事产业经济学研究。关于产业技术创新的研究综述 王 璐 (安徽大学,合肥230601) 摘要:我国技术创新能力同发达国家相比仍然存在一定的差距, 因此,在创新过程中,要注重培育企业主体创新意识,引进和培养技术创新人才,提高研发人员比重,创建学习型组织。政府要加大研发资金投入力度,选择正确的技术创新战略,加强对科研成果的保护力度,加大产业政策扶持,营造良好的技术创新氛围和政策环境,从而提升产业整体的技术创新能力,促进我国经济持续健康的发展。 关键词:技术创新;产业技术创新;创新能力中图分类号:F273 文献标志码:A 文章编号:1673-291X (2012)20-0020-02 20——
立井施工作业规程及施工技术措施知识讲解
立井井筒施工作业规程 第一章概况 第一节概述 一、巷道名称及施工目的 1.巷道名称:三河矿业天井井筒与井底车场连接处工程 2.工程范围:立井井筒设计图纸内的全部施工工程 3.施工目的:解决采煤工作面通风提升运输问题 4.巷道用途:用于采区工作面通风、提升、运输,质量要求必须严格、切实按照“安全生产、质量第一”的思想教育每一个职工。 二、井口位置:如巷道平面布置图所示。 第二节立井井筒特征 为了提高矿井生产力,现对五矿矿井井筒400m,直径6m,浇筑墙壁厚度0.5m,的井筒施工,施工用IV型井架,JT-2.5m绞车,提升3m3吊桶,进行人员下放与排矸,浇注混凝土用1.6m3底卸式吊桶输送砼,浇注高4m的无缝液压整体模板,钻眼用YT-28风钻,出矸采用HZ-6型中心回转式抓岩机。 第三节施工的工作量 临时施工项目包括:井架施工,排水设施,锁口,封口,临时支护系统施工,供风设施,供电设施,安全梯等施工项目。 主要施工项目包括:井筒开挖,排矸石和混凝土注浆, 第四节编写依据 本规程编写过程中用到以下主要依据:
1.《煤矿安全规程》及阳煤集团工种操作规程及各项补充规定。 2.根据井筒施工图及《矿山井巷工程施工及验收规范》进行编制。 第二章地面相对位置及水文地质概况 第一节通讯系统 本次施工井筒所采用的主要通讯设备为手机以。 第二节泥浆系统 本次施工所用泥浆主要是井筒开挖以后用泥浆充填井壁。 第三节供电系统 本次施工绞车所需电压为660/380v,用1680Kva变压器接线, 第四节通风系统 本次施工用一个局扇通风,但是需要备用一个 第五节供水系统 为满足本次施工用水,采用3DZ-SZ75/50水泵,每隔5-10米焊接50mm闸阀一个。 第六节废物,矸石处理 灌注混凝土以及其他施工废弃物运送至山顶进行处理或者掩埋,证将污染降到最小。 第七节瓦斯情况及水文地质 井筒在岩层中掘进无瓦斯,井筒无涌水量。裂隙含水性微弱,松散层沉积厚度偏小,含水条件较差,并依据邻近已贯通巷道的地次水文资料得出含水对本巷道无影响。故在掘进中应遵循“有疑必探,先探后掘”的原则。 第八节地质构造 根据工程勘察设计及相邻巷道提供的地质资料,在施工期间无断层、
技术创新理论研究趋势综述
技术创新理论研究趋势综述 【摘要】技术创新是新技术的产生和商业化应用。本文根据技术创新理论研究的趋势,将其研究划分为三个阶段即单个企业创新行为、创新企业与企业的合作关系、创新企业与国家关系的研究阶段,并将各阶段的研究进行了综述。 【关键词】技术创新理论;演变趋势;综述 1.技术创新的概念界定 美籍奥地利经济学家约瑟夫.熊彼特(J.A.Schumpeter,1912)的《经济发展理论》的出版,首次提出了“创新”这一概念,他认为:“所谓创新,是把一种从来没有过的生产要素和生产条件的‘新组合’(a new combination)引入生产体系。”其内涵包括:(1)引入新产品;(2)引入新工艺;(3)开辟新市场;(4)控制原材料新的供应来源;(5)实现工业的新组织。熊彼特的创新概念既包括了技术性变化的创新,又包括了非技术性变化的创新,其创新理论开辟了技术创新理论的先河。下表列举了以往研究者对“技术创新”的概念界定(见表1)。 表1 以往研究者的“技术创新”的概念界定列举 2.技术创新理论研究的发展阶段 20世纪熊彼特最早提出了技术创新理论,从此,拉开了技术创新研究的序幕。根据相关研究文献,从时间上可把技术创新理论研究划分为三个阶段。 2.1第一代技术创新理论 第一代技术创新理论研究阶段为单个企业创新行为研究阶段。20世纪50年代初到60年代,在世界新技术革命浪潮的推动下,技术创新研究迅速发展,逐步突破新古典经济学的限制与束缚,形成对技术创新起源、效应和内部结构与过程等方面的专门研究。但研究主要停留在对单个企业创新行为的研究上,如熊彼特于1934-1944强调企业家的作用(见图1)。此后,技术创新理论形成了以技术创新和市场创新为研究对象、组织变革和组织形式为研究对象的两个分支。该时期并未形成完整的理论框架。 图1 熊彼特的企业家创新模型 (Mark Dodgson,Roy Rothwell,2000) 2.2第二代技术创新理论 第二代技术创新理论研究阶段为创新企业与企业的合作关系研究阶段。时间为20世纪70年代初至80年代初,该阶段研究强调创新企业与企业的合作关系
船舶电力系统中的谐波检测方法综述
船舶电力系统中的谐波检测方法综述 船舶电力系统是一个独立的、小型的完整电力系统,由于整流型,冲击性等非线性负荷的存在,所以对比陆地大电网,船舶电力系统有着更加严重的电能质量问题,而其中最主要的问题就是谐波,谐波会使船舶电网供电质量指标严重下降,同时使得电网各个部件运行情况恶化。所以如何更快速更准确的测量出系统中的谐波与简谐波,成为了全世界的焦点。文章主要介绍了目前流行的谐波检测方法,并详细论述了各种检测方法上的优势与不足,以便在检测过程中选择更加恰当的方法。 标签:船舶电力系统;谐波;检测方法 1 概述 船舶電力系统是一个独立的系统,随着电力技术的飞速发展以及科技的进步,船舶电力系统已经从早期的单一照明供电,逐渐发展成现代的船舶电力。然而,正是由于大量半导变流器的普遍投入使用,以及电力技术的应用,这使得船舶电力系统中的谐波污染日益严重[1]。 谐波会造成电动机的电机和变压器的附加损耗,并且产生噪声、过热现象、谐波过电压以及机械振动,甚至会损坏变压器与电机。同时谐波会引起,电流变化率电压变化率过高或产生过热效应,控制系统误差,会给换流装置带来影响、并且引起晶闸管故障[2]。高次谐波也会对线路以及通讯设备带来干扰,从而产生电力测量仪表中的误差。 而谐波问题涉及面很广,其中包括畸变波形、谐波抑制的分析方法、谐波潮流计算、电网谐波潮流计算、谐波测量、谐波源分析以及谐波限制标准等[2]。谐波检测是谐波问题的一个重要分支,也是研究谐波问题的基础与出发点。 2 基于傅里叶变换的谐波检测算法 虽然加窗插值法能够减小一定的误差,但为了检测出信号中所有的间谐波和谐波分量,窗宽在大多数情况下可能会高达几十个信号周期,并且容易受噪声干扰,这对实时检测是不利的。 3 基于小波变换的谐波检测方法 小波变换是将信号与一个时域和频域均具有局部化性质的平移伸缩小波基函数进行卷积,将信号分解成位于不同频带时段上的各个成分。小波变换是在工程应用中最重要的是最优小波选择,目前主要是通过小波分析处理信号的结果与结论的误差来判定小波的好坏,并由此选择小波基。 特殊地,取a0=2,b0=1,可以得到二进小波(Dyadic Wavelet),相应的变
水中油类测定分析方法的综述
水中油类测定分析方法的综述 李海州 (浙江海洋学院海洋与技术学院,浙江舟山316004) [摘要]:本文对国内外学者有关水中油类的测定方法做了比较系统的综述。对几种水中油类的常用方法,重量法、紫外分光光度法、荧光分光光度法、红外分光光度法和非分散红外光度法做了简要介绍,并对其优劣进行了评价。另外,介绍了测定水中油类含量存在的难点、发展趋势和技术改进等。 关键词:水;油类;测定分析 油类是指任何类型的(矿物油、植物油等)及其炼制品(汽油、柴油、机油、煤油等)、油泥和油渣[1]。油类主要有漂浮油、分散油、乳化油、溶解油和油类附着在固体悬浮物表面而形成油膜---固体物5种形式。全世界每年至少有500—1000吨油类通过各种途径进入水体,由于漂浮于水体表面的油将会影响空气和水体表面氧的交换,而分散于水体中以及吸附于悬浮颗粒上或以乳化状态存在于水体的油易被微生物氧化分解,并将消耗水中的溶解氧,从而使水质恶化;油膜还能附着于鱼鳃上,使鱼类窒息而死;当鱼类产卵期,在含有油类污染物质废水中孵化的鱼苗,多数为畸形,生命力低下,易于死亡;含有油类污染物的废水进入水体后,造成的危害很为严重,不仅影响水生生
物的生长,降低水体的自我净化能力,而且影响水体附近的环境,因此,油类是水体环境中的主要污染物之一,在水质监测中,也是一项重要的监测项目。要消除油类对环境的污染和危害,首先就必须能够准确的测定水中油类的含量。 然而,水中油类含量测定又是比较复杂的,因为水中的油类成分是相当复杂的,此外不同地区、不同行业水体中油类污染的成分也不同,无法有用单一的油标准进行对照,无法准确测定,所以水体中油类物质含量的测定问题是环境分析化学一个古老、重要而又困难的问题。目前水体中油类测定常用的方法有重量法、紫外分光光度法、荧光分光光度法、非分散红外光度和国家最新颁布的国家标准方法红外分光光度法等[2],本文简要介绍以上几种方法的原理和优劣,及人们对水体中油类监测分析方法的创新和改进。 1.重量法 重量法是用有机萃取剂(石油醚或正己烷)提取酸化了的样品中的油类,将溶剂蒸发掉后,称重后计算油类含量。重量法应用范围不受油品的限制,可测定含油量较高的污水,不需要特殊的仪器和试剂,测定结果的准确度较高、重复性较好。缺点是损失了沸点低于提取剂的油类成分,方法操作复杂,灵敏度低,分析时间长,并要耗费大量的提取剂,而且方法的精密度随操作条件和熟练程度不同差异很大。因此,水体中动植物油含量较高的,采用该方法较适合,可以得到比较准确的结果;工业废水、石油开采及炼制行业中含油量较高,此方
绿色技术创新研究综述
龙源期刊网 https://www.360docs.net/doc/e64789147.html, 绿色技术创新研究综述 作者:李杰中 来源:《创新科技》2015年第10期 [摘要] 回顾绿色技术创新研究的演进历程,梳理理论研究的热点和主要成果,从评价模型、评价指标体系和评价方法等方面探讨绿色技术创新评价研究,评析研究现状与指出存在问题,探讨进一步研究的重点和方向。 [关键词] 绿色技术创新;理论;评价研究 [中图分类号] F204 ; ; [文献标识码] A ; 文章编号:1671-0037(2015)10-32-3 Research Review on the Green Technology Innovation Li Jiezhong (Department of Economics and Management,Ningde Normal University,Ningde Fujian 352100) Abstract:This paper reviewed the evolution of green technology innovation research,combed the hot and main achievements of theoretical research,discussed the evaluation research of green technology innovation in terms of the evaluation model,evaluation index system and evaluation methods,assessed the research status and pointed out the problems,to explore the direction and focus of further research. Keywords:Green technology innovation;Theory;Evaluation research 绿色技术创新是生态文明建设的有效途径。随着资源与环境约束的加剧,绿色技术创新成为创新领域研究的热点议题,学者们对此进行了诸多研究和探讨,取得了不少积极的研究成果。 1 国外绿色技术创新理论研究综述 国外对绿色技术创新研究随着绿色意识的增强和对环境保护的关注而逐渐展开。从时间维度看,绿色技术创新本身历经了几个明显的发展阶段,从末端技术到无废工艺(20世纪60年代至70年代),从废弃物最少化技术到清洁生产技术(1984年至1989年),直到对污染预防技术的关注(1990年),绿色技术不断演进,不断向前渗透,目标和关注重点历经了污染的 去处与资源化、资源的合理利用、零排放、节能减排与源头消减,更加强调全过程的绿色技术创新,更加强调防患于未然,更加强调与经济社会发展的需求互动。
虚拟现实技术-综述
浅谈虚拟现实技术在规划领域中的应用 作者:Why 摘要:随着信息时代的到来,越来越多的高新技术应用到社会的各个领域中来,而作为信息技术发展的首要驱动力的“虚拟现实”技术也越来越多地应用到规划领域中来。本文着重论述了虚拟现实技术在城市规划中的应用范围、应用的意义及其为我们带来的便利。 关键词:虚拟现实、范围、发展、迫切性、城市规划 虚拟现实(Virtual Reality,简称VR),又称灵境技术,是90年代为科学界和工程界所关注的技术。它的兴起,为人机交互界面的发展开创了新的研究领域;为智能工程的应用提供了新的界面工具;为各类工程的大规模的数据可视化提供了新的描述方法。它是一种基于可计算信息的沉浸式交互环境,具体的说,就是采用以计算机技术为核心的现代高科技生成逼真的视、听、触觉一体化的特定范围的虚拟环境,用户借助必要的设备以自然的方式与虚拟环境中的对象进行交互使用、相互影响,从而产正亲临其境的真实环境的感受和体验。这种技术的应用,改进了人们利用计算机进行多工程数据处理的方式,尤其在需要对大量抽象数据进行处理时;同时,它在许多不同领域的应用,可以带来巨大的经济效益。 1、虚拟现实技术的发展概述 1965年,Sutherland在篇名为《终极的显示》的论文中首次提出了包括具有交互图形显示、力反馈设备以及声音提示的虚拟现实系统的基本思想,从此,人们正式开始了对虚拟现实系统的研究探索历程。 随后的1966年,美国MIT的林肯实验室正式开始了头盔式显示器的研制工作。在这第一个HMD的样机完成不久,研制者又把能模拟力量和触觉的力反馈装置加入到这个系统中。1970年,出现了第一个功能较齐全的HMD系统。基于从60年代以来所取得的一系列成就,美国的JaronLanier在80年代初正式提出了“VirtualReality”一词。 80年代,美国宇航局(NASA)及美国国防部组织了一系列有关虚拟现实技术的研究,并取得了令人瞩目的研究成果,从而引起了人们对虚拟现实技术的广泛关注。1984年,NASAAmes研究中心虚拟行星探测实验室的M.McGreevy和J.Humphries博士组织开发了用于火星探测的虚拟环境视觉显示器,将火星探测器发回的数据输入计算机,为地面研究人员构造了火星表面的三维虚拟环境。在随后的虚拟交互环境工作站(VIEW)项目中,他们又开发了通用多传感个人仿真器和遥现设备。 进入90年代,迅速发展的计算机硬件技术与不断改进的计算机软件系统相匹配,使得基于大型数据集合的声音和图象的实时动画制作成为可能;人机交互系统的设计不断创新,新颖、实用的输入输出设备不断地进入市常而这些都为虚拟现实系统的发展打下了良好的基矗例如1993年的11月,宇航员利用虚拟现实系统成功地完成了从航天飞机的运输舱内取出新的望远镜面板的工作,而用虚拟现实技术设计波音777获得成功,是近年来引起科技界瞩目的又一件工作。可以看出,正是因为虚拟现实系统极其广泛的应用领域,如娱乐、军事、航天、设计、生产制造、信息管理、商贸、建筑、医疗保险、危险及恶劣环境下的遥操作、教育与培训、信息可视化以及远程通讯等,人们对迅速发展中的虚拟现实系统的广阔应用前景充满了憧憬与兴趣。 2、虚拟现实在规划领域的应用范围 虚拟现实在规划信息存储和查询系统中的应用 例如土质数据库系统,地域信息系统,地理信息系统,城市政策信息系统等。这一类系
电力系统谐波检测方法综述
综述 2019年第9期 1电力系统谐波检测方法综述 陈和洋1,3 吴文宣2 郑文迪1 晁武杰3 唐志军3 (1. 福州大学电气工程与自动化学院,福州 350108; 2. 国网福建省电力有限公司,福州 350003; 3. 国网福建省电力有限公司电力科学研究院,福州 350007) 摘要 电力系统谐波检测为谐波治理提供了方向,同时也是谐波监测系统的核心。本文首先 阐述了电力系统谐波的诸多危害;其次对一些传统检测方法和近期新方法展开讨论和分析,比如瞬时无功功率法、快速傅里叶变换法、小波变换法、希尔伯特-黄变换法等;最后阐述了将来谐波检测领域的发展趋势。 关键词:谐波检测;瞬时无功功率;快速傅里叶变换;小波变换;希尔伯特-黄变换;人工神 经网络;复合检测 Reviews of power system harmonic measurement methods Chen Heyang 1,3 Wu Wenxuan 2 Zheng Wendi 1 Chao Wujie 3 Tang Zhijun 3 (1. College of Electrical Engineering and Automation, Fuzhou University, Fuzhou 350108; 2. State Grid Fujian Electric Power Co., Ltd, Fuzhou 350003; 3. Electric Power Reserch Institute of State Grid Fujian Electric Power Co., Ltd, Fuzhou 350007) Abstract Power system harmonic detection provides the direction for harmonic control and is also the core of the harmonic monitoring system. This paper first expounds the many hazards of power system harmonics, and then discusses and analyzes some traditional detection methods and recent new methods, such as: instantaneous reactive power method, fast Fourier transform method, wavelet transform method, Hilbert-Hang transformation method, etc., finally pointed out the future development trend and personal outlook in the field of harmonic detection. Keywords :harmonic detection; instantaneous reactive power; fast Fourier transform (FFT); wavelet transform; Hilbert-Huang transform (HHT); artificial neural network (ANN); composite detection 100多年来,随着电力系统的不断发展,以非化石能源为主的新一代电力系统格局已经产生,将来清洁能源和可再生能源将占有很大的比重。在此背景下,电力电子元器件的大量使用导致电力系统不可避免地受到谐波的污染。电力系统中的谐波分量过大将造成诸多危害:①使电能利用率降低,电力系统设备产生附加能耗,同时增加了电气应力,影响设备安全稳定运行[1];②大量分布式电源在公共连接点(point of common coupling, PCC )集中被 接入,可能放大电网的谐波振荡;③在柔性直流输 电运行过程中,直流场持续的谐波扰动可能引发一 系列不稳定现象,从而影响系统的安全稳定运行; ④谐波还可能使得保护误动作,测量装置产生误差,甚至可能会对通信线路产生干扰,影响通信效果。 针对谐波产生的种种危害,我国在20世纪90年代就已经开展了谐波治理的相关研究,并制定了《电能质量:公用电网谐波》(GB/T 14549—93)国家标准对公共电网谐波允许值进行了限制。此后对电力系统进行谐波治理,改善电能质量成为一项持续而长久的工作。有源电力滤波器(active power filter, APF )是一种能够动态抑制谐波、全面改善电能质量的电力电子装置,谐波电流的精确、实时检测直接影响其动态抑制的效果。 对谐波信号进行高精度、实时地检测是谐波治 福建省自然基金项目(2017J01480) 国网福建省电力有限公司科技项目(52130416001P )
矿井回风立井井口连接处施工技术安全措施正式样本
文件编号:TP-AR-L8187 In Terms Of Organization Management, It Is Necessary To Form A Certain Guiding And Planning Executable Plan, So As To Help Decision-Makers To Carry Out Better Production And Management From Multiple Perspectives. (示范文本) 编制:_______________ 审核:_______________ 单位:_______________ 矿井回风立井井口连接处施工技术安全措施正式 样本
矿井回风立井井口连接处施工技术 安全措施正式样本 使用注意:该解决方案资料可用在组织/机构/单位管理上,形成一定的具有指导性,规划性的可执行计划,从而实现多角度地帮助决策人员进行更好的生产与管理。材料内容可根据实际情况作相应修改,请在使用时认真阅读。 一、工程概况: 巴彦高勒矿井回风立井井筒设计净直径Φ7m,设 计净断面38.48m2,井筒全深624m。表土段深度 130.02m,冻结深度635m。井口设计标高为+1271.4m (实际),回风立井井口连接处设计深度13.4m,井 口连接处底口标高+1258m;内壁净直径7m,荒经 8m,外壁净直径8m,荒经9060mm,混凝土强度等级 内壁C30、外壁C35;壁厚1m(其中内、外壁厚度均 为500mm)。井壁结构:内、外壁均为双层钢筋混凝 土支护。井壁预留风道口、安全出口,技术特征如下
技术创新文献综述
自主创新能力影响因素的文献综述(浙江理工大学,吴华贵,杭州,310018) 摘要:自主创新能力影响因素的研究是自主创新绩效评价和国家创新政策制定的基础。本文回顾了已有的对自主创新能力研究的相关文献,主要从自主创新的投入能力和环境支撑能力两个角度出发,发现以往的文献对投入和外部环境的研究比较多,而对于企业内部的运行和产出能力研究较少。在提高自主创新能力方面的建议方面强调政府作用的占多数,缺乏对作为创新主体的企业的内部因素进行研究。 关键词:自主创新;自主创新能力;FDI;R&D; 创新概念的定义 要理解自主创新,首先要明白什么是创新,自主的涵义又是什么。 创新一词在辞海中并没有,引用“英汉辞海”innovate,innovation的意思,即采取新的事物,变革,创新,改革。查“英文字根字典”英文单词来自nonus,nonellas.意思是NEW 新的意思。① 熊皮特在其1911年出版的《经济增长理论》首次引入了创新这个概念。他认为任何生产都是一种组合。而当有一种新的组合,这种新的组合是不连续的出现的时候,那么具有发展特点的现象就出现了。这种现象就是创新的最初概念。之后其又在《经济变动分析》一文中对创新做了如下定义:创新就是生产函数的变化,这种生产函数的变化不能分解为无限小的步骤,曾做过这样一个形象的比喻:你可以把许许多多的邮车加起来,加到你想要加到的地步,但你永远得不到一条铁路(熊彼特著,叶华译,2007) 。这一定义后来也被学者广泛引用,但是对熊皮特的生产函数跳跃式变动持有不同的观点。S.C. Gilfillan(1935)实证研究的结果表明:产业技术创新的主要内容是无数进步细小的更新和改良,而重大创新发生的概率是很低的。John Enos(1962)对美国精细化工工业的技术创新进行了长时间的跟踪研究,发现每项新技术产生的经济效益有一半来自发生在新技术投入商业化使用之后的持续改进。Abernathy 和Utterback(1978)提出:“重大创新”和“渐进创新”两种创新模式并不是彼此独立的类别,许多组织都经历了从重大产品创新到渐进创新的改变;工艺和渐进创新与产品创新具有同等甚至更重要的商业价值。N. Rosenberg(1982)认为:熊彼特强调的是重大创新,却忽略了渐进创新的作用。 从熊皮特提出创新概念到现在,创新被赋予了很多形式:产品创新、技术创新、市场创新、资源配置创新、组织创新、过程创新、管理创新等。但最终可以归纳为两种形式,即技术创新和制度创新。凡是涉及“人与人关系”的创新就是制度创新(改变生产的“交易成本”),涉及“人与自然”关系的创新就是技术创新(改变生产的“技术成本”)(汪丁丁,2003)。按照这种分类方法,产品创新、技术创新、资源配置创新、过程创新应该属于技术创新,而市场创新、组织创新、管理创新属于制度创新。
虚拟现实技术在军事训练中的应用及发展前景
虚拟现实技术在军事训练中的应用及 未来发展前景 一、综述 虚拟现实技术(Virtual Reality,简称VR)是一系列高新技术如计算机软件、硬件、图形学、多媒体、人工智能、智能人机接口、传感器、高性能计算技术以及人类行为学、心理学等多领域最新技术的汇集与融合。 它是建立在自动控制技术、计算机图形学、计算机仿真技术、人机接口技术、多媒体技术、传感器技术及人工智能技术基础之上,本质上是一种在系统仿真技术的基础之上发展起来的高级接口技术,但是它与仿真技术有明显的区别。虚拟现实的目的是为人与实际环境之间接的交互提供一种自然的、方便的界面,即所谓的虚拟环境。虚拟环境可以给人一种进入真实环境的效果,人可以与虚拟环境交互,通过改变虚拟环境,进而实现改变实际环境的目的。 像IT界其他高新技术一样,比如计算机、Internet等,这些新技术不仅是首先应用于军事领域,同时军事领域的应用需求与研究也是这些技术逐步发展成熟的决定性推动力量,VR技术也不例外,在军事训练准备中发挥着越来越重要的作用。下面就对虚拟现实技术在军事训练中的应用和发展前景做简要的分析。 二、虚拟现实技术特点 1.对于一个人造的环境,人需要有参与的感觉,不能只是此环境的
外部观察者,人要对虚拟现实技术中的武器装备进行自主操作,在虚拟技术中掌握武器装备的使用方法。 2.虚拟现实依赖于3维立体的、头跟踪的显示,以及手身体跟踪和双耳声音,虚拟现实是一种有临场感的多传感的体验,给人以身临战场的真实感觉。 3.虚拟现实技术中的场景与实际作战场景的地形和标志物相似,可以使作战人员提前适应战场环境。 4.虚拟现实技术中设计各种突发事件,增强士兵处理突发事件的能力,培养作战小分队的团结协作能力。 三、在军事训练中的应用 (一)在新式武器研究方面 在新式武器与装备的研制和应用上,军事模拟也可以得到很大的效益。 比如,在美国国防部测绘局在1995年8月到9月北约对波黑进行大规模空袭期间,曾在意大利的空军基地建立一个作战模拟设施,利用侦察卫星拍摄的高分辨率图像与测绘据提供的波黑地区的数字地图相结合,通过作战模拟所产生的灵境环境,模拟战斗机在波黑地区上空的飞行。 经过这个仿真环境的训练,极大地提高了实战的成功率和飞行员的适应性。 (二)作战训练与人才培养方面 这些方面的应用主要体现在以下几个方面:
建筑节能检测方法综述
建筑节能检测方法综述 The Standardization Office was revised on the afternoon of December 13, 2020
建筑节能现场检测方法 田斌守 摘要本文综述了几种建筑物围护结构传热系数现场检测方法的原理、操作方法、适用条件,指出各种方法的优缺点及注意事项。 关键词建筑节能检测热流计法热箱法控温箱-热流计法非稳态法当今飞速发展的国民经济活动必然导致前所未有的资源能源消耗速度。而许多资源能源是不可再生的,为了人类的可持续发展,节约能源刻不容缓。据介绍,我国目前单位建筑面积采暖能耗相当于气候条件相近的发达国家的2~3倍,而建筑能耗也占全国能耗总量的%。随着人民生活水平的不断提高、城市化进程的加快以及住房体制改革的深化,建筑能耗在我国增长趋势很大,很可能是我国今后能耗的一个主要增长点。为建设节约型社会,促进经济社会可持续发展,国家发展委员会发布了“节能中长期专项规划”,建筑节能作为三大重点领域中的一项,受到高度重视。建设部也相继发布了一系列建筑节能标准,其中包括若干强制性条款,目前正在建设领域逐步实施。 建筑节能工作从流程上可分为设计审查、现场检测、竣工验收三个大的阶段。对节能建筑的评价,从建设前期对施工图纸审查计算阶段、向现场检测和竣工验收转移是大势所趋。建筑节能现场检测也是落实建筑节能政策的重要保证手段。目前,全国范围内建筑节能检测都执行JGJ132-2001《采暖居住建筑节能检验标准》,它是最具权威性的检测方法,它的发布实施,为建筑节能政策的执行提供了一个科学的依据,使得建筑节能由传统的间接计算、目测定性评判到现在的直接测量,从此这项工作进入了由定性到定量、由间接到直接、由感性判断到科学检测的新阶段。 根据我们对建筑节能影响因素和现场检测的可实施性的分析,我们认为能够在实验室检测的宜在实验室检测(如门窗等作为产品在工程使用前后它的性状不会发生改变),除此之外,只有围护结构是在建造过程中形成的,对它的检测只能在现场进行。因此建筑节能现场检测最主要的项目是围护结构的传热系数,这也是最重要的项目。如何准确测量墙体传热系数是建筑节能现场检测验收的关键。目前对建筑节能现场检测的、围护结构(一般测外墙和屋顶、架
技术创新理论概述1
目录 摘要 (1) 一、技术创新理论概述 (1) (一)企业需要技术创新的必要性 (1) (二)技术创新理论的提出及其发展 (2) 二、基于技术创新理论的海尔集团核心竞争力分析 (4) (一)技术创新是海尔的核心竞争力 (4) (二)技术创新在海尔的成功运用及管理 (5) 三、海尔集团成功经验的启示 (7) (一)提高企业创新管理水平与能力,是企业技术创新成功的重要保障 (7) (二)建立学习型组织,培养企业家型人才,为技术创新提供思路与方向 (7) (三)进一步转变观念,实现思维和观念创新 (7) (四)构建与创新先进的企业文化,对企业文化不断进行创新、发展 (7) (五)加大制度创新的力度,促进完整的创新生态体系的建立 (7) (六)利用外部资源,加快发展步伐 (8) 结束语 (8) 参考文献 (9)
海尔集团核心竞争力分析及启示 —基于技术创新理论视角 学生:指导老师: 摘要:本文首先简要介绍了企业需要技术创新的必要性以及技术创新理论的提出与发展,在强调了企业需不断创新的必要性基础上,着重从技术创新角度分析了海尔集团成功的宝贵经验,总结了海尔集团在竞争日趋激烈的全球化时代能够持续、稳步发展的关键所在。通过对其基于技术创新理论的分析,得出启示性建议与措施,以探索出适合我国企业自身发展的新道路。 关键词:技术创新、企业核心竞争力、海尔集团 Abstract The passage brifly introduce the necessity that companies need technological innovation and propose the innovation theory and development firstly. Base on the necessity of the emphasis that companies need technologic al innovation, it emphasises on the precious experience of the successd of Haier Group from the new view. And it summaeizes why Haier Group could develop continuly and steadily during the fierceful goldlization period. Through the anylysis of the new technological innovation theory, it gets revelational suggestion and arrangement to search the new way of their own that fit to our country's companies. key words: technological innovation 、enterprise core competitiveness 、Haier Group 一、技术创新理论概述 (一)企业需要技术创新的必要性 21世纪是创新制胜的世纪,在全球经济迅猛发展、社会环境急剧变化的时代,越来越多的人确信变是唯一不变的真理。而如今,“创新”也已成为全球范围内的一个热门话题①。 “科学技术是第一生产力”是邓小平同志在坚持和发展马克思关于生产力的理论基础上,于1988年提出的精辟论断,这个论断揭示了科学技术在现代社会中的重要作用。科学技术是第一生产力,它代表先进生产力的发展要求,是解放和发展生产力的重要基础和标志,高新技术更是当代企业抢占先进生产力制高点的关键因素。当今世界各国的竞争是综合国力的竞争,其核心和关键在于 ①肖峰. 企业文化. 北京:中国纺织出版社,2002.2
虚拟现实技术的历史与发展
虚拟现实技术的历史与发展 摘要:虚拟现实技术作为一种综合多种科学技术的计算机领域新技术,已经涉及众多研究和应用领域,被认为是21世纪重要的发展学科以及影响人们生活的重要技术之一。本文介绍了虚拟现实技术的概念、特性以及发展历史和发展趋势,并对虚拟现实技术的应用前景进行展望。 关键词:虚拟现实技术发展历史发展趋势 一、虚拟现实的概念和特性 虚拟现实(Virtual Reality,又译作灵境、幻真)是近年来出现的高新技术,也称灵境技术或人工环境。虚拟现实是利用电脑模拟产生一个三维空间的虚拟世界,提供使用者关于视觉、听觉、触觉等感官的模拟,让使用者如同身历其境一般,可以及时、没有限制地观察三度空间内的事物[1]。虚拟现实技术作为一种新的技术,主要有三个特性,分别是沉浸性、交互性和构想性。 1.沉浸性,是指利用计算机产生的三维立体图像,让人置身于一种虚拟环境中,就像在真实的客观世界中一样,能给人一种身临其境的感觉。 2.交互性,在计算机生成的这种虚拟环境中,人们可以利用一些传感设备进行交互,感觉就像是在真实客观世界中一样,比如:当用户用手去抓取虚拟环境中的物体时,手就有握东西的感觉,而且可感觉到物体的重量。 3.构想性,虚拟环境可使用户沉浸其中并且获取新的知识,提高感性和理性认识,从而使用户深化概念和萌发新的联想,因而可以说,虚拟现实可以启发人的创造性思维。 二、虚拟现实技术的发展历程 虚拟现实技术演变发展史大体上可以分为四个阶段:1963 年以前,蕴涵虚拟现实技术思想的第一阶段;1963年~1972 年,虚拟现实技术的萌芽阶段;1973 年~1989 年,虚拟现实技术概念和理论产生的初步阶段;1990 年至今,虚拟现实技术理论的完善和应用阶段。 第一阶段:虚拟现实技术的前身。虚拟现实技术是对生物在自然环境中的感官和动作等行为的一种模拟交互技术,它与仿真技术的发展是息息相关的。中国古代战国时期的风筝,就是模拟飞行动物和人之间互动的大自然场景,风筝的拟声、拟真、互动的行为是仿真技术在中国的早期应用,它也是中国古代人试验飞行器模型的最早发明。西方人利用中国古代风筝原理发明了飞机,发明家Edwin A. Link 发明了飞行模拟器,让操作者能有乘坐真正飞机的感觉。1962 年,Morton Heilig的“全传感仿真器”的发明,就蕴涵了虚拟现实技术的思想理论。这三个较典型的发明,都蕴涵了虚拟现实技术的思想,是虚拟现实技术的前身。 第二阶段:虚拟现实技术的萌芽阶段。1968 年美国计算机图形学之父Ivan Sutherlan 开发了第一个计算机图形驱动的头盔显示器HMD 及头部位置跟踪系统,是虚拟现实技术发展史上一个重要的里程碑。此阶段也是虚拟现实技术的探索阶段,为虚拟现实技术的基本思想产生和理论发展奠定了基础。 第三阶段:虚拟现实技术概念和理论产生的初步阶段。这一时期出现了VIDEOPLACE 与VIEW两个比较典型的虚拟现实系统。由M.W.Krueger 设计的VIDEOPLACE系统,将产生一个虚拟图形环境,使参与者的图像投影能实时地响应参与者的活动。由M.MGreevy 领导完成的VIEW 系统,在装备了数据手套和头部跟踪器后,通过语言、手势等交互方式,形成虚拟现实系统。 第四阶段:虚拟现实技术理论的完善和应用阶段。在这一阶段虚拟现实技术从研究型阶段转向为应用型阶段,广泛运用到了科研、航空、医学、军事等人类生活的各个领域中,如美军开发的空军任务支援系统和海军特种作战部队计划和演习系统,对虚拟的军事演习也能达到