Towards a computational model of sketching
人工智能的发展

02
自动化系统若出现故障可能导致严重后果,例如
自动驾驶汽车的交通事故。
算法偏见
03
AI算法可能因训练数据偏差而产生歧视性决策,
影响公平性,如招聘软件的性别偏见问题。
隐私保护法规
为防止AI滥用个人数据,多 国制定了严格隐私保护法规,
如欧盟的GDPR。
伦理道德审查
人工智能在医疗、军事等领 域的应用引发伦理争议,需
机器翻译系统
谷歌翻译等机器翻译系 统利用深度学习技术, 提供跨语言交流的便利, 打破语言障碍。
情感分析应用
情感分析被广泛应用于 社交媒体监控,通过分 析用户评论来了解公众 情绪和品牌声誉。
自动化生产线
利用AI技术优化生产流程,实现从原料到成品的全自动化 生产,提高效率和质量。
智能质量检测
通过机器学习算法分析生产数据,实时监控产品质量,减 少缺陷率,提升产品合格率。
监督学习
通过标注好的训练数据, 机器学习模型能够预测或 分类新数据,如垃圾邮件 过滤。
02
无监督学习
模型在没有标签的数据中 寻找模式,常用于市场细 分和社交网络分析。
03
强化学习
通过奖励机制训练模型做 出决策,应用于自动驾驶 汽车和游戏AI。
01 神经网络的结构
深度学习的核心是神经网络,它模仿人脑结构,通过多 层处理信息,实现复杂功能。
1
疾病诊断
人工智能通过深度学习分析医学影像, 辅助医生进行更准确的疾病诊断,如癌
症筛查。
2
个性化治疗
AI技术能够根据患者的基因信息和病史, 提供个性化的治疗方案,提高治疗效果。
3
药物研发
利用人工智能加速药物研发过程,通过 模拟和预测化合物的效果,缩短新药上
二维ising模型蒙特卡洛算法
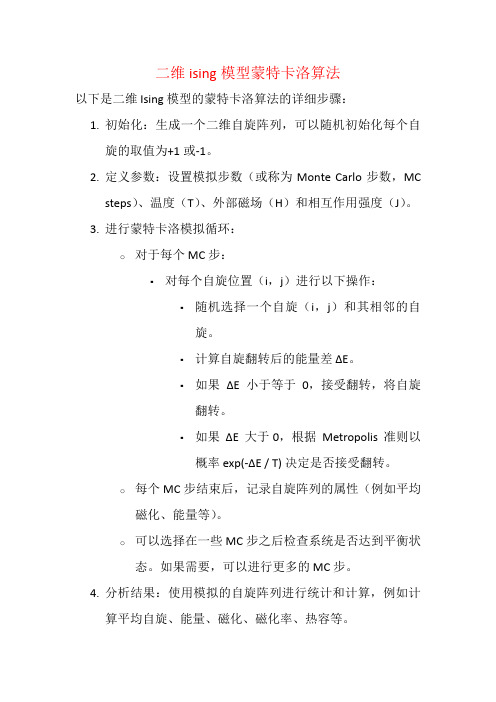
二维ising模型蒙特卡洛算法
以下是二维 Ising 模型的蒙特卡洛算法的详细步骤:
1.初始化:生成一个二维自旋阵列,可以随机初始化每个自
旋的取值为+1或-1。
2.定义参数:设置模拟步数(或称为Monte Carlo 步数,MC
steps)、温度(T)、外部磁场(H)和相互作用强度(J)。
3.进行蒙特卡洛模拟循环:
o对于每个 MC 步:
▪对每个自旋位置(i,j)进行以下操作:
▪随机选择一个自旋(i,j)和其相邻的自
旋。
▪计算自旋翻转后的能量差ΔE。
▪如果ΔE 小于等于0,接受翻转,将自旋
翻转。
▪如果ΔE 大于0,根据Metropolis 准则以
概率 exp(-ΔE / T) 决定是否接受翻转。
o每个 MC 步结束后,记录自旋阵列的属性(例如平均磁化、能量等)。
o可以选择在一些 MC 步之后检查系统是否达到平衡状态。
如果需要,可以进行更多的 MC 步。
4.分析结果:使用模拟的自旋阵列进行统计和计算,例如计
算平均自旋、能量、磁化、磁化率、热容等。
这是基本的二维Ising 模型的蒙特卡洛算法步骤。
在实施算法时,还可以根据需要考虑边界条件(如周期性边界条件)、优化算法以提高效率等其他因素。
结构稀疏模型刘建伟

结构稀疏化模型是当前稀疏学习领域的研究方向近几年来涌现出很多研究成果文中对主流的结构稀疏模型如组结构稀疏模型结构稀疏字典学习双层结构稀疏模型树结构稀疏模型和图结构稀疏模型进行了总结对结构稀疏模型目标函数中包含非可微非凸和不可分离变量的结构稀疏模型目标函数近似转换为可微凸和可分离变量的近似目标函数的技术如控制一受控不等式majorityminoritymmnesterov双目标函数近似方法一阶泰勒展开和二阶泰勒展开技术对求解结构稀疏化模型近似目标函数的优化算法如最小角回归算法组最小角回归算法groupleastangleregressiongrouplars块坐标下降算法blockcoordinatedescentalgorithm分块坐标梯度下降算法blockcoordinategradientdescentalgorithm局部坐标下降算法1ocalcoordinatedescentalgorithm谱投影梯度法spectralprojectedgradientalgorithm主动集算法activesetalgrithm和交替方向乘子算法alternatingdirectionmethodofmultipliersadmm进行了比较分析并且对结构稀疏模型未来的研究方向进行了探讨
★★★★广发证券-投资策略-探寻西蒙斯投资之道:基于HMM模型的周择时策略研究-罗军[1].pdf
![★★★★广发证券-投资策略-探寻西蒙斯投资之道:基于HMM模型的周择时策略研究-罗军[1].pdf](https://img.taocdn.com/s3/m/677d96125f0e7cd184253677.png)
.
广发证券公司或其关联机构可能会持有报告中所涉及的公司所发行的证券并进行交易,亦可能为这些公司提供或争取提供承 销等服务。本报告中所有观点仅供参考,并请务必阅读正文之后的免责声明。
目录索引
量化投资专题报告
HMM 与量化投资:探寻西蒙斯投资之道.................... 3
投资流派的分类:判断型 V.S 量化型、技术型 V.S 基本面型 3 西蒙斯的主要应用工具之一——隐马尔科夫模型(HMM)..... 3
算法和结果分析 ...................................... 12
两类波动模式下的择时策略及交易结果................... 12 三类波动模式下的择时策略及交易结果................... 13
总 结 .............................................. 15
HMM 模式识别模型的优势:动态刻画价量推动的过程
股价的变化来自于未知力量的价量推动,推动的完成其需要一个动态的过程,而HMM在描述该过程的动 态变化方面相对其他模式识别工具具备明显的优势,这也正是我们采用HMM尝试对股价预测的原因。 本文将 HMM 模型应用到我国股市的预测中,通过对股票数据序列的模式识别来对股市每周趋势进行预测。 我们将股票的未来走势分别划分为两种(涨、跌)和三种(涨、跌、平)状态,把股市的波动预测转化为 分类问题,并通过 HMM 模型进行识别。
李明 研究助理
电话:020-87555888-687 eMail: lm8@
蓝昭钦 研究助理
电话:020-87555888-667 eMail:lzq3@
隐马尔科夫模型(HMM)是西蒙斯大奖章基金的主要工具之一
nscacscs第四版第十四章内容

nscacscs第四版第十四章内容第四版第十四章内容:人工智能与未来社会人工智能(Artificial Intelligence,简称AI)是当今科技领域最炙手可热的话题之一。
在第四版的第十四章中,我们将深入探讨人工智能与未来社会的关系,以及其对我们生活的影响。
首先,我们需要明确人工智能的定义。
人工智能是一种模拟人类智能的技术,通过计算机系统实现对复杂问题的分析、判断和决策。
它可以模拟人类的思维过程,具备学习、推理、识别和理解等能力。
随着科技的不断进步,人工智能已经在各个领域得到广泛应用,包括医疗、金融、交通、教育等。
人工智能的发展对未来社会产生了深远的影响。
首先,人工智能的出现将改变我们的工作方式。
许多重复性、繁琐的工作将被机器人或自动化系统取代,从而提高工作效率和生产力。
然而,这也意味着一些传统的工作岗位可能会消失,需要我们不断学习和适应新的技能。
其次,人工智能的应用将改变我们的生活方式。
例如,智能家居系统可以通过语音识别和自动化控制,实现对家庭设备的智能管理。
智能助手可以帮助我们处理日常事务,提供个性化的服务。
虚拟现实技术可以让我们身临其境地体验各种场景。
这些技术的出现将极大地提升我们的生活质量和便利性。
然而,人工智能的发展也带来了一些挑战和问题。
首先,人工智能的普及可能导致一些道德和伦理问题的出现。
例如,自动驾驶汽车在遇到危险情况时如何做出决策,成为了一个备受争议的话题。
其次,人工智能的发展可能会导致一些就业岗位的消失,增加社会的不平等。
此外,人工智能的算法可能存在偏见和歧视,需要我们加强监管和规范。
为了应对这些挑战和问题,我们需要制定相应的政策和法规。
首先,我们需要加强对人工智能技术的监管,确保其安全和可靠性。
其次,我们需要加强对人工智能的研究和发展,培养更多的专业人才。
同时,我们也需要加强对人工智能的教育和普及,提高公众对人工智能的认知和理解。
总之,人工智能是未来社会发展的重要驱动力之一。
武汉大学资环学院gis地图学与地理信息系统考研(真题+答案+笔记)

现在大家可能也在面临着选择,比如是否考研,考哪个学校,考哪个专业,跟哪个导师, 怎样平衡专业课与公共课的时间等等。作为过来人,当初的我们和大家一样,也在思考着类 似的问题;也正因为是过来人,我们才有了给大家提供建议的底气。借此机会,把我们一些 个人看法与大家交流,虽个人经历不同,经验不足以证明什么,但仅供参考之用足矣! 1、为什么要考研?
II
学长学姐们对大家网上购买资料的几点忠告
1、考研不易,资料的作用显而易见,只要经济允许,大家还是要找个信得过的 提供者。
2、买资料注意,首先,一定要和对方聊聊,看对方是什么出身,如果一个人连 地域分异规律、新仙女木事件、中心地理论、空间分析、遥感影像分辨率都不知 道是什么,那他是无法保证质量的。有时候,对方会狡辩说是找人编写的,那大 家扪心自问下,如果有人出钱让你编资料,但对方对这块也不懂,也就是说质量 上是没人把关的,你会十二分的用心吗?其次,要让对方截图,任意指定版块进 行截图,很多资料描述的都很美,但实际拿到后会大失所望。随机性的截图可以 避免这一点。
3、资料更新说明
新的年份,考研范围、考试重点和大纲都会有新的变化,针对这种变化,本中心每年都会进行一次较大内 容更新,所以本套资料仅适用于 2015 年,请大家多加关注我们!谢谢。
4、资料接受说明
收到资料后,在不拆开前提下,可自由浏览资料内容,如不满意,2 小时之内,联系我们,然后无偿退货。 但对于那些擅自拆开书钉,进行复印,而后再退货的资料贩子,我们也会坚决维护我们的权益,与之奉陪 到底!联系方式:咨询 QQ:2593665687,TEL:18012981114
行人碰撞腿部保护研究

图1 行人下肢伤害的主要模式
骨折。股骨和腓骨也具有同样的伤 害机理。
Kajzer对膝关节受到横向碰撞 时的伤害机理进行了详细的研究, 指出膝关节伤害主要是由于横向平 移位移导致的剪切以及角位移导致 的弯曲两种伤害机理造成的。行人 腿部膝关节位置通常是直接受到车 辆保险杠的撞击,由于股骨运动的 滞后使得关节面间发生剪切错位。 这种剪切错位导致了膝关节韧带的 拉伸,并在股骨髁和胫骨髁间隆凸 间产生横向压缩力。横向压缩力导 致关节接触表面出现集中应力,当 应力超过其容忍极限时,胫骨髁间 隆凸或股骨髁就会发生横向骨折。 当膝关节横向弯曲时,关节一侧的 韧带受到拉伸力的作用发生拉伸变 形,与此同时,关节表面的另一侧 则会受到轴向压缩力作用,导致集 中应力的出现。当集中应力超过骨 的压缩强度时,也会出现骨折伤 害,如图 2 所示。
综 述
行人碰撞腿部保护研究
郑 巍
内容提要:本文从生物力学角度综合分析了行人与车辆碰撞过程中其腿部的伤害机理,并根据EEVC 行 人碰撞保护试验法规建立了腿部撞击器的有限元模型。利用该数值模型,本文针对某国产轿车进行了行人腿 部保护的相关研究,并提出了相应的结构改进方案。计算结果表明,通过对保险杠的结构改进可以有效地减 轻车辆对行人腿部的伤害,具有较高的可行性。
分析车身保险杠的结构可以发 现,整个保险杠结构类似于一根简 支梁,最外层为保险杠蒙皮,它通 过螺钉固定在保险杠骨架上,保险 杠骨架又通过保险杠支架与车身前 纵梁相连接。无疑,在梁支承处的 撞击工况相对于其它位置的碰撞而 言更为恶劣,而L2碰撞位置正位于 保险杠支架(梁支承处)附近。
recurrent models of visual attention
recurrent models of visualattentionRecurrent models of visual attention are a type of deep neural networks that are used to simulate the human visual system and its ability to focus on different areas of an image for a certain period of time. This is done by using recurrent neural networks (RNNs) combined with convolutional neural networks (CNNs). The recurrent model of visual attention is designed to mimic the way humans shift their focus from one area to another in order to identify objects and features in images.In general, recurrent models of visualattention use a combination of CNNs and RNNs to detect which elements or features of an image are most important. This is done in two stages. First, the CNN extracts the features of the image, such as edges and shapes. Then, the RNN takes thesefeatures and uses them to determine which elements of the image should be focused on, and for howlong. This is done through a process called “attention”, where the RNN assigns more importance to certain elements of the image over others based on their relevance to the task at hand.For example, if an image contains both a cat and a dog, the RNN might assign more attention to the cat than the dog. This is because cats tend to be more relevant to the task of identifying animals in images than dogs. Similarly, if an image contains both a car and a tree, the RNN might assign more attention to the car than the tree. This is because cars tend to be more relevant to the task of identifying vehicles in images than trees.The advantage of using recurrent models of visual attention is that they can learn to focus on the most relevant elements in an image, instead of just relying on the fixed filters used in regular CNNs. This makes them more suitable for tasks such as object detection, where it is important to identify the specific objects in an image.Furthermore, since they are able to focus on different elements of an image for different lengths of time, they can also be used for tasks such as scene recognition, where it is important to recognize not only individual objects but also the overall structure of the scene.Overall, recurrent models of visual attention are a powerful tool for simulating the human visual system and its ability to focus on different elements of an image for various lengths of time. By combining CNNs and RNNs, these models can learn to focus on the most relevant elements in an image, making them well suited for tasks such as object detection and scene recognition.。
- 1、下载文档前请自行甄别文档内容的完整性,平台不提供额外的编辑、内容补充、找答案等附加服务。
- 2、"仅部分预览"的文档,不可在线预览部分如存在完整性等问题,可反馈申请退款(可完整预览的文档不适用该条件!)。
- 3、如文档侵犯您的权益,请联系客服反馈,我们会尽快为您处理(人工客服工作时间:9:00-18:30)。
Figure 1: A Course of Action SketchTowards a Computational Model of SketchingKenneth D. Forbus, Ronald W. Ferguson, Jeff UsherQualitative Reasoning Group, Northwestern UniversityAbstractSketching is a powerful means of communication between people, and while many useful programs have been created, current systems are far from achieving human-like participation in sketching. A computational model of sketching would help characterize these differences and better understand how to overcome them. This paper is a first step towards such a model. We start with an example of a sketching system, designed to aid military planners, to provide context. We then describe four dimensions of sketching, visual understanding, conceptual understanding, language understanding, and drawing, that can be used to characterize the competence of existing systems and identify open problems. Three research challenges are posed, to serve as milestones towards a computational model of sketching that can explain and replicate human abilities in this area.IntroductionPerson-to-person communication often involves diagrams, charts, white boards, and other shared surfaces. People point, mark, highlight, underscore, and use other gestures to help disambiguate what they are saying. Being able to use multiple modalities, i.e., speech and gesture, to communicate ideas is especially crucial for spatial information [1,4,6,21]. The ability to understand spatial representations, and to use them appropriately in dialogue, is a critical skill that we need to embed in software, in order to create systems that understand the users they are interacting with.We focus here on sketching , meaning a communication activity involving a combination of interactive drawing plus linguistic interaction. The drawing carries the spatial aspects of what is to be communicated. The linguistic interaction provides a complementary conceptual channel that guides the interpretation of what is drawn. Most people are not artists, and even artists cannot produce, in real time, drawings of complex objects and relationships that are recognizable solely visually without breaking the flow of conversation. The verbal description that occurs during drawing, punctuated by written labels, compensates for inaccuracies in drawing. Follow-up questions may be needed to disambiguate what aspects of a drawing are intended versus accidental.There is now a substantial body of research on multimodalinterfaces [19]. Sketching is clearly a form of multimodal interaction, but not all multimodal interaction is sketching. Many multimodal interfaces focus on placement of predefined entities, e.g., selecting a location, often via pointing (c.f. [1,6]). Such selection operations require a fairly minimal shared understanding on the part of the participants, and hence has provided a natural startingpoint for multimodal interface research. Work that comes closer to sketching (c.f. [8,13,23]) incorporates more domain semantics, to increase the level of sharedunderstanding. This progression suggests that to achieve the kind of flexible interaction that sketching provides in human-to-human communication, multimodal research will rely heavily upon, and even drive, AI research. This paper examines sketching in that light, to provide a framework for understanding the phenomena and suggesting new research directions.The rest of this paper describes our progress towards a computational model of sketching. We start with an example, our nuSketch multimodal interface architecture, showing how it has been used to create a system for reasoning about military courses of action. We then step back and describe a framework for sketching, motivated by a combination of constraints from computation and from cognitive science research. We end by identifying three challenges for research on sketching.nuSketch: A multimodal architecture for sketchingnuSketch is designed as a general-purpose multimodal architecture to support sketching. The best way to illustrate nuSketch’s abilities is through an example application. Military planners use a Course of Action sketch (COA sketch) when designing an operation. COA sketches express the gist of a plan, before many details, such as timing, have been worked out. Traditionally such sketches are created using acetate overlays on maps, or on paper starting with hand-drawn abstractions of critical terrain features. A well-worked out vocabulary of visual symbols is used to represent terrain features, military units, and tasks assigned to units. Figure 1 illustrates a course of action drawn using the nuSketch COA Creator. A layer metaphor organizes the interface. Like acetate layers, each nuSketch layer corresponds to some category of domain information, such as terrain analysis, enemy disposition, disposition of your units, and so forth. Switching between layers is accomplished by clicking on the tabs to the left. Multiple layers can be displayed at once, or hidden or grayed out as convenient. The choice of active layer determines how user inputs are interpreted. For example, if the terrain layer is active, the user can add regions corresponding to different terrain categories (i.e., regions where movement is restricted due to slope, soil type, or vegetation) and man-made features such as cities and towns. Additions are made via speech command (e.g., “Add severely restricted terrain”) accompanied by a gesture, whose interpretation depends on the command. For adding regions, the curve drawn is taken to be the boundary of the region, so it is closed and filled with the appropriate texture to indicate that the command was understood.. For adding standard symbols, e.g. towns, the user’s gesture indicates a bounding box, and the appropriate glyph isretrieved from the KB anddisplayed there, scaled appropriately. A set of assertions constituting the system’s conceptual understanding of the visual element and what it represents in domain terms is also created. This conceptual understanding facilitates reasoning to support the user. For instance, geographic queries are made by dragging and dropping sketch elements onto a simple parameterized dialog (Figure 2). These queries are answered by using qualitative and visual reasoning to interpret the spatial entities and relationships in the sketch. Similarly, users can request critiques based on analogies with prior plans, with the application of the advice to their plan illustrated by the system highlighting the appropriate visual elements of the sketch (Figure 3). The analogical mapping is driven by the visual and conceptual descriptions constructed during sketching. Figure 4 shows the nuSketch architecture. The Ink Processor accepts pen input, does simple signal processing, and passes time-stamped data to the Multimodal Parser. The other input to the multimodal parser is from a commercial speech recognizer, which produces time-stamped text strings. The Multimodal Parser uses grammars that include both linguistic and gesture information, to produce propositions that are interpreted by the Dialog Manager. The Dialog Manager and the KB contents are the only application-specific components of nuSketch. The Dialog Manager is responsible for interpreting propositions and supplying grammars to the speech recognizer and Multimodal Parser based on context (as determined by itsown state and the activelayer). Central to nuSketch isthe use of a knowledge-basedreasoner (DTE 1), which provides integrated access to a1 DTE stands for Domain Theory Environment, theFigure 2: nuSketch provides geographic reasoning. Here the user asked for shortest trafficable path to an objective. The path found is outlined in pink Figure 3: Analogies can be used to provide critiques, with resultsdisplayed by highlighting elements of the user’s sketchnumber of reasoning services, including analogical reasoning and geographic reasoning. The Dialog Manager uses DTE for its reasoning, and as much domain-specific knowledge is stored in the KB as possible. For example, the glyphs corresponding to the visual symbols in a domain are stored as part of the knowledge base, so that how something is depicted can be reasoned about (e.g., if a glyph is not available for a specific unit type, use a glyph corresponding to a more general type of unit).Several aspects of nuSketch are inspired by Quickset [6], a multimodal interface system for setting up military simulations, such as using off-the-shelf speech recognition and time-stamping ink and speech signals to facilitate integrating information across modalities. Quickset incorporates ink-recognition schemes that nuSketch does not (as a matter of principle; see below). Because Quickset was designed as an interface for legacy computer systems, it lacks an integrated reasoning system. As the discussion below will make clear, this starkly limits its potential as a model of sketching. For example, it does not reason about depiction as nuSketch can.Dimensions of sketchingThe power of sketching in human communication arises from the high bandwidth it provides [21]. There is high perceptual bandwidth because the shared drawing is interpreted by the participants’ powerful visual apparatus. There is high conceptual bandwidth because the combination of visual and linguistic channels facilitates the interaction needed to create a shared conceptual model. Sketching covers a wide span of activities that occur under a variety of settings. A computational model of sketching reasoning system. It combines a prolog-style query-driven inference system with a logic-based TMS to enable heterogeneous inference systems to interoperate. must identify what knowledge and skills the participants need. We characterize these competencies along four dimensions: visual understanding, language understanding, conceptual understanding, and drawing skills. Variations along these dimensions determine how many different types of interactions something having those skills can participate in. We describe each in turn. Visual understanding. This dimension characterizes how deeply the spatial properties of the ink are understood. The simplest level of understanding is recognizing gestures. Gestures indicate locations or sizes, often including an action to be taken with regard to something at that location (e.g., selecting or deleting) [2,6,24]. We do not consider a system with only this level of visual understanding to be capable of sketching, since it does not understand the spatial relationships between visual elements.The next level of visual understanding is the use of a visual symbology, i.e. a collection of glyphs, representing conceptual elements of the domain whose spatial properties can also convey conceptual meaning. Schematic diagrams in various technical fields and formal visual languages such as the military task language illustrated above are two examples. Is a CAD system a participant in sketching? We argue no, for two reasons. First, it is not taking an active role as a participant. In multimodal interactions, even during data entry the system is engagedin recognizing the kinds of entities and actions the user intends. Second, the time and conceptual overhead needed to deal with menus prevents the maintenance of a conversation-like flow [6,21]. By contrast, multimodal systems that use recognition procedures to “parse” ink automatically (c.f. Quickset), or use speech plus gesture to identify entities (c.f. nuSketch) keep the interaction more like dealing with another person, someone capable of looking at what you are drawing and hearing what you are saying, and responding appropriately.Most multimodal systems rely on a combination of speech and black-box recognition algorithms (e.g., hidden Markov models or neural nets) operating on digital ink to identify a user’s intent (c.f. [6,12]. While certainly useful in some applications,we claim thatthey aredetours fromthe path thatleads tohuman-likesketchingcapabilities.The reason isthat peopleare veryflexible inFigure 4: nuSketch architectureFigure 5: Visual symbols can be complextheir use of visual symbols, and they expect the same flexibility from their partners. Three examples illustrate this point.Figure 5 illustrates how complex visual symbols can be. In terrain analysis, broad red arrows indicate avenues of approach. This multi-headed “arrow”, drawn by a military officer, accurately conveys where units might move. However, it is hard to see how any statistical recognizer could be trained up in advance to recognize such a complex figure.Figure 6 shows two arrows thatare very similar, except for thestyle in which they are drawn.Most visual symbologies assign different meanings to dashed versus solid arrows, so it would not be enough to simply recognize both of these as arrows. The richness of visual properties that can arise even with very stylized visual symbologies is illustrated by Figure 7, which shows a symmetric pair of attacks that has been automatically identified by high-level visual reasoning [9].These examples suggest that powerful visual skills are one of the keys to human-like sketching. We suspect that work like Saund’s [22] on perceptual organization will play a major role in bringing sketching systems closer to human capabilities.Conceptual understanding: As a communicative act, sketching requires common ground [3]; the depth of representation of what is sketched is probably the single strongest factor determining how flexible communication can be. There must be enough visual and language understanding, and these can be traded off against each other, but it is the degree of shared conceptual model that ultimately limits what can be communicated, no matter what modalities are available. As might be expected, this is the weakest area for current systems.The simplest level of conceptual understanding for sketching is the ability to handle a fixed collection of types of entities and relationships (c.f. [5,6,12,24]). It is also the level most commonly used, since it suffices to issue commands to other software systems, the primary purpose of most existing multimodal interfaces. Type information is often used to reduce ambiguity, e.g., if a gesture indicating the argument to a MOVE command might be referring to a tank or a fence, the latter is ruled out. Moving beyond identifying an intended command and its arguments requires broader and deeper common ground. Domain-specific systems (e.g., Quickset, particular nuSketch applications) obviously need knowledge about their domain. But there are areas of knowledge that cut across multiple domains of discourse that seem to be necessary to achieve flexible communication via sketching:• Qualitative representations of space. Being able to reason about regions, paths, and relative locations is important in every spatial domain. [10,7]• Qualitative representations of shape. The ability to abstract away minor differences in order to describe important properties facilitates recognition. [8]We claim that qualitative representations are crucial for several reasons. First, they are well-suited for handling the sorts of approximate spatial descriptions provided by hand-drawn figures, layouts, and maps. Second, the level of description they provide is close to the descriptions of continuous properties common in human discourse. [11,23] The nuSketch COA Creator, for instance, relies on qualitative representations to understand geographic questions and as part of the encoding of a situation that facilitates retrieval for generating critiques via analogy.Other types of general knowledge are needed for flexible sketching as well:• Graphical conventions. Many conventions used in drawings are deliberately unrealistic, e.g., cutaways to show the internal structure of a complex object. Using sequences of snapshots to depict dynamics requires interpreting spatial repetition as temporal progression. Understanding these conventions is necessary for many types of sketches.• Standard visual symbols. Part of our shared visual language consists of simplified drawings that convey complex concepts easily. Stick-figure drawings and many types of cartoons provide examples.Graphical conventions and visual symbols require combining visual/spatial knowledge with conceptual knowledge, and thus we suspect are a crucial area for improvement to create better sketching systems.Language Understanding: Language provides several services during sketching. It can ease the load on vision by labeling entities, specifying what type of thing is being drawn, stating what spatial relationships are essentialFigure 6: Two arrowsFigure 7: Higher-level visual constructs such as symmetry communicate nformationversus accidental, and describing entities and relationships not depicted in the drawing. Speech is the most common modality used during sketching because it enables visual attention to remain on the diagram, although short handwritten labels are often used as well. Existing multimodal systems tend to use off-the-shelf speech recognition systems, limiting them to finite-state or definite clause grammars (c.f. [4,5,19]). Given the differences in complexity between spoken and written text, such grammars, albeit with multimodal extensions, are likely to remain sufficient [1]. The most important dimension for characterizing language understanding in sketching systems concerns dialogue management [15,18]. Most systems have been command-oriented, with some support for system-initiated clarification questions. We know of no sketching systems that use full mixed-initiative dialogs. We suspect two reasons for this. First, when multimodal interfaces are grafted onto legacy software, the existing output presentation systems are often used. Second, the relatively shallow conceptual understanding used in most systems does not support them doing much on their own, so they are unlikely to need to interject anything. Drawing capabilities: Sketching is a two-way street; ideally visual and linguistic expression should be modalities available to all participants (c.f. [20]). The state of the art in natural language generation and text to speech is constantly improving, and such improvements will of course benefit sketching systems. Visual expression by sketching programs provides some new challenges. The simplest forms of visual expression are highlighting and performing operations on human-drawn elements (e.g., moving, rotating, or resizing). Some systems complement their human partners by neatening their diagrams (c.f. [17]). The ability to modify a user’s sketch, and generate their own sketches to start a dialog, are beyond the present state of the art. Significant progress has been made on expressing the visual skills needed for graphical production tasks such as layout (c.f. [19]), the key barriers for sketching are the lack of understanding of both the domain and visual representations, as outlined above.Challenges for computational models of sketching The discussion of the dimensions of sketching should make it clear that, while currently we can build software that participates in sketching in a limited way, the state of the art is far from creating systems that have the depth and flexibility of a human partner. In the spirit of encouraging progress, we suggest three challenges as useful benchmarks to measure progress in the area. Integrated compositional semantics: The preponderance of systems that use “black-box” recognizers is more a function of them being easily available and of the limited range of tasks tackled to date than their suitability for use in sketching. An example provides the best illustration. The symbols used on military maps are highly standardized, with thick books providing visual symbols for almost every conceivable occasion. Nevertheless, during military exercises unique visual symbols are sometimes generated tocover special needs.Figure 8 shows an icon,drawn on a post-it, thatappeared in severalplaces on anintelligence map in arecent US Army exercise.This symbol represents a downed US pilot at its location. Although this symbol cannot be found in any military manual, it is quite easy to interpret. Even non-military people tend to get it after one or two leading questions (what is the thing on the right? Okay, it’s a crashed airplane. Who might that be?). There are degrees of ambiguity in the interpretation: Some people interpret the dashed lines coming out of the pilot’s head as sweat rather than tears, and some think the person is a passenger. But no one who is told what the symbol means has trouble identifying the airplane and the pilot and the pilot’s unhappy/stressed state as a consequence.This very simple interpretation problem requires an enormous amount of knowledge: Of airplanes, pilots, and their relationships, of the visual appearance of airplanes and how modifications of that appearance might be interpreted (i.e., a crashed airplane), and of conventions for depicting people and their states. The ability to combine visual and conceptual understanding in a compositional way to decode complex sketches is, we believe, a major challenge for computational models of sketching.User-extensible visual symbologies: As more open domains are attempted, restricting users to a predefined vocabulary of visual symbols will be infeasible. Asking a user to provide dozens to hundreds of samples to train a statistical recognition system in order to add a new glyph, for instance, is quite unnatural. When a new glyph is introduced in human-to-human sketching, the introducer may have to linguistically mark its occurrence for a while when first used, but over time the other participants learn to recognize it. Being able to interactively specify the domain semantics of a new glyph, and have the software start picking up how to recognize it through normal interactions, will be an important benchmark since it will enable the bootstrapping of sketching systems.Visual analogies: Being able to compare sketches is an important aspect of comparing what the sketches are about (e.g., comparing engineering designs or comparing COAs). Shared history provides an important form of common ground, so the ability to recognize when aspects of the current sketch have been seen before will enable softwareFigure 8: A novel, but easilyunderstandable, visual symbolparticipants to take on more of a community memory role. Currently there are domain-specific systems that do sketch-based retrieval [8,14], but these only operate in narrow domains. Some progress has been made on using similarity in visual encoding, particularly to detect symmetry and regularity in line drawings[9], but using these and other analogical encoding techniques in visual understanding is currently an area of active research. Sketching systems that can carry out such visual analogies and retrievals in a broad range of domains will be another important benchmark in modeling sketching. DiscussionSketching is a powerful human-to-human communication activity, and a potentially powerful metaphor for human-computer interaction. We have argued that the state of the art is still far from creating software that participates in sketching with the same fluency as humans. We argued that two key areas of improvement are depth of conceptual understanding and visual processing. The three challenges we outlined provide, we believe, benchmarks that would mark significant advances towards more human-like sketching systems. Even leaving aside its importance as an interface modality, research on sketching provides an arena for investigating the intersection of conceptual knowledge, visual understanding, and language, making it a valuable area for investigation in order to understand human cognition. We hope that this paper encourages more research in this area.Acknowledgements:This research was supported by DARPA under the High Performance Knowledge Bases and Command Post of the Future programs. References1. Allen, J.F. et al, The TRAINS Project: A Case Study in Defining a Conversational Planning Agent, Journal of Experimental and Theoretical AI, 1995.2. Bolt, R. A. (1980) Put-That-There: Voice and gesture at the graphics interface. Computer Graphics. 14(3), 262-270.3. Clark, H. 1996. Using language. Cambridge University Press.4. Cohen, P. (1992) The role of natural language in a multimodal interface. UIST92, pp 143-149.5. Cohen, P., Dalrymple, M., Moran, D., Pereira, F., Sullivan, J., Gargan, R., Schlossberg, J. and Tyler, S. (1989) Synergistic use of direct manipulation and natural language. Proceedings of CHI-89, pp 227-233.6. Cohen, P. R., Johnston, M., McGee, D., Oviatt, S., Pittman, J., Smith, I., Chen, L., and Clow, J. (1997). QuickSet: Multimodal interaction for distributed applications, Proceedings of the Fifth Annual International Multimodal Conference (Multimedia '97), (Seattle, WA, November 1997), ACM Press, pp 31-40.7. Cohn, A. (1996) Calculi for Qualitative Spatial Reasoning. In Artificial Intelligence and Symbolic Mathematical Computation, LNCS 1138, eds: J Calmet, JA Campbell, J Pfalzgraf, Springer Verlag, 124-143, 1996.8. Egenhofer, M. (1997) Query Processing in Spatial-Query-by-Sketch in Journal of Visual Languages and Computing 8(4), 403-424 pp.9. Ferguson, R.W. and Forbus, K.D. 1999. GeoRep: A Flexible Tool for Spatial Representation of Line Drawings. Proceedings of QR99. Loch Awe, Scotland.10. Forbus, K. 1995. Qualitative Spatial Reasoning: Framework and Frontiers. In Glasgow, J., Narayanan, N., and Chandrasekaran, B. Diagrammatic Reasoning: Cognitive and Computational Perspectives. MIT Press, pp. 183-202.11. Forbus, K., Nielsen, P. and Faltings, B. “Qualitative Spatial Reasoning: The CLOCK Project”, Artificial Intelligence, 51 (1-3), October, 1991.12. Gross, M. (1994) Recognizing and interpreting diagrams in design. In T. Catarci. M. Costabile, S. Levialdi, G. Santucci eds., Advanced Visual Interfaces '94, ACM Press, 89-94.13. Gross, M. (1996) The Electronic Cocktail Napkin - computer support for working with diagrams. Design Studies. 17(1), 53-70.14. Gross, M. and Do, E. (1995) Drawing Analogies - Supporting Creative Architectural Design with Visual References. in 3d International Conference on Computational Models of Creative Design, M-L Maher and J. Gero (eds), Sydney: University of Sydney, 37-58. 15. Grosz, B.J., and Sidner, C.L., "Attention, Intentions, and the Structure of Discourse", Computational Linguistics, 12:3 (1986)16. Henderson, K. 1999. On Line and On Paper: Visual representations, visual culture, and computer graphics in design engineering. MIT Press.17. Julia, L. and Faure, C. 1995. Pattern Recogntion and Beautification for a pen-based interface. Proceedings of ICDAR’95: Montreal (Canada), pp 58-63.18. Luperfoy, S. (editor) Automated Spoken Dialogue Systems. MIT Press (in preparation).19. Maybury, M. and Whalster, W. 1998. Readings in Intelligent User Interfaces. Morgan Kaufmann.20. Moran, D.B., Cheyer, A.J., Julia, L.E., Martin, D.L., and Park, S. (1997) Multimodal user interfaces in the Open Agent Architecture. Proceedings of IUI97. pp 61-68. 21. Oviatt, S. L. 1999. Ten myths of multimodal interaction, Communications of the ACM, Vol. 42, No. 11, November, 1999, pp. 74-81.22. Saund, E., and Moran, T, (1995) Perceptual Organization in an Interactive Sketch Editing Application. ICCV '9523. Stahovich, T. F., Davis, R., and Shrobe, H., "Generating Multiple New Designs from a Sketch," in Proceedings Thirteenth National Conference on Artificial Intelligence, AAAI-96, pp. 1022-29, 1996.24. Waibel, A., Suhm, B., Vo, M. and Yang, J. 1996. Multimodal interfaces for multimedia information agents. Proc. of ICASSP 97。