Q-DAS课程(值得收藏)
sqa基础培训

TOPGROUP CENTER ACADEME SEPG Version:1.0 2002-03-08
Overview
课程介绍 第一章 CMM对SQA的要求 第二章 SQA简述 第三章 TP’SQA流程 第四章 与项目组的接口问题 参考资料
TPCA SEPG
2019/5/23
过程/工件审计(在整个开发过程中)
• SQA 组评审软件工程活动以验证符合性。 • SQA 组审计指定的软件工作产品以验证符合性。
TPCA SEPG
2019/5/23
22
……与项目组的接口问题
不符合性问题的处理
• 与当事人和项目经理协商对不符合性问题的处理措施;如果不能达成 一致意见,则上报高级管理者
2
课程介绍
关于本次课程
课程目标 预备知识 目标听众 日程表 词汇表 图例(可选)
TPCA SEPG
2019/5/23
4
课程目标
使开发人员了解SQA的作用 明确TP’SQA工作流程 明确SQA与开发人员的接口问题
CA SEPG
2019/5/23
5
预备知识
行项目开发活动 • 软件产品的质量决定于过程的质量[PSP] 保证最终交付产品的质量
TPCA SEPG
2019/5/23
16
SQA的独立性
SQA有一个向高级管理者报告的渠道,它独立于:
• 项目经理, • 项目的软件工程组, • 其它的软件一有关组。
三权分立的思想
• 立法:SEPG • 行政:项目组 • 司法:SQA
2019/5/23
26
Question?
THANK YOU
(完整word版)QTRAP-IDA指南

IDA指南Information Dependent Acquisition (IDA)自动关联扫描能够在一个色谱过程中进行MS/MS谱的“on the fly ”采集.Analyst Software IDA通过组合特定的survey scans,高分辨扫描和灵敏的子离子扫描产生大量有用的MS/MS数据.在一个典型的IDA实验中,survey scan产生了一个所有出现离子的峰列表。
峰列表根据用户定义的标准除去不想要的母离子。
留下的离子则进行MS/MS实验.这个循环在整个采集过程中不断重复,产生了大量的信息丰富的数据。
由于Q TRAP TM System仪器灵活性强,有多种不同的扫描选择,所以IDA功能强大而灵活。
多个水平的MS/MS和MS/MS/MS可以以完全自动的方式执行.IDA实验可以手动方式建立或者借助IDA Wizard帮助。
本指南介绍采用这两种方式建立IDA实验。
另外还描述了一些用于蛋白质组学的典型方法;蛋白质鉴定的标准方法,在多肽混合物中筛选磷酸化位点的方法。
注意:关于不同扫描方式的更多信息参见Q TRAP TM系统的LIT扫描模式.6。
1 击活硬件Profile打开导航栏(屏幕的左边)中的Hardware Configuration Editor,选择与MS 系统相联的LC系统的合适的硬件配置并击活Profile.这些外围设备将自动加入到IDA方法中,所以必需提前选好。
关于硬件Profile更多的信息参见LC Packing System指南或者Agilent capLC 系统指南。
6。
2 IDA Wizard双击导航栏的Acquire部分的IDA Method Wizard,可以登录IDA Wizard。
建立IDA Experiment的窗口如下.IDA Wizard简化了建立IDA Experiment的过程。
Wizard包括了三个IDA Method,可以采用4个survey scans.前两个采用线性离子阱MS扫描作为survey scans,即EMS和EMC扫描,然后击发EPI从属扫描。
海克斯康 Q-DAS V12的新内容
产品iProduct栏目编辑|孟圆mengy@一、质量大数据分析专家Q-DASQ-DAS专注于制造过程数据统计分析和质量数据可视化管理及报告,最早为大众、宝马、博世和麦格纳等公司开发制造质量管理系统,并逐步推广到汽车、航空航天、机械制造、电子、食品、医药和化工等行业。
Q-DAS软件系统以人、机、料、法和环为主线,贯穿并涵盖企业制造PDCA全过程。
二、Q-DAS CAMERAQ-DAS CAMERA是Q-DAS的集成解决方案,包括数据采集、数据评估、数据管理、数据评价、数据报告和数据归档。
Q-DAS CAMERA结合了结构化设计流程和测量系统的动态特性,为工业生产中质量分析提供了精简的统计信息系统,形成制造质量数据、可视化管理过程分析优化和预测性维护等能力,是质量输出最优的解决方案。
首先介绍基于CAD和结构树的数据管理系统eMMA。
eMMA是基于CAD和结构树的尺寸规划、测量数据采集、产品质量数据管理、尺寸综合分析和3D报告展示系统。
eMMA系统兼容众多品牌测量设备的数据格式,支持三坐标测量机、蓝光设备、激光测量设备、在线测量设备和现场量检具所产生的质量数据。
eMMA专注于钣金件、内外饰等产品的塑型和成型过程,帮助企业实现质量数据的结构化管理和尺寸评判的统一标准,实现跨区域跨部门的业务互动并深度挖掘质量数据的潜在价值,实现加工制造业的数字化转型。
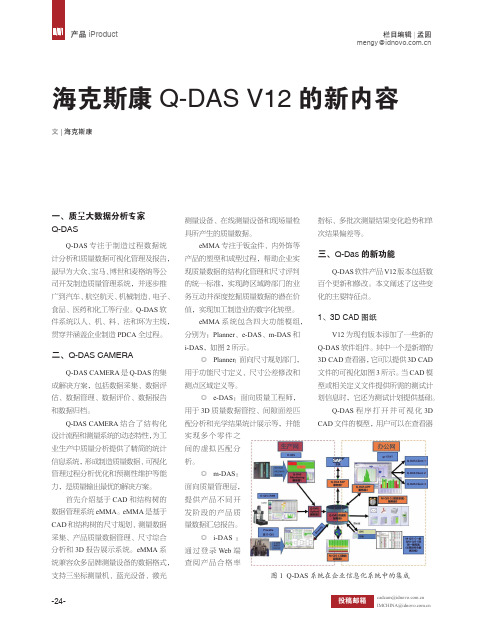
eMMA系统包含四大功能模组,分别为:Planner、e-DAS、m-DAS和i-DAS,如图2所示。
◎Planner:面向尺寸规划部门,用于功能尺寸定义、尺寸公差修改和测点区域定义等。
◎e-DAS:面向质量工程师,用于3D质量数据管控、间隙面差匹配分析和光学结果统计展示等,并能实现多个零件之间的虚拟匹配分析。
◎m-DAS:面向质量管理层,提供产品不同开发阶段的产品质量数据汇总报告。
◎i-DAS :通过登录Web端查阅产品合格率指标、多批次测量结果变化趋势和单次结果偏差等。
Q-DAS--基础应用

Q-DAS软件基础应用页码Page 1 / 9发布Issue date 2013-2-17摘要 Summary1. 目的 Purpose2. 范围 Scope3. 内容 Content4. 参考文件Reference Documents修订记录 Revision版本 Version版本Version版本 VersionA0 2013-2-17 New编制、审核及批准Prepare, check and approval编制 Prepared by 审核 Checked by 批准 Approved by签名/Signature: 日期/Date: 签名/Signature:日期/Date:签名/Signature:日期/Date:Q-DAS软件基础应用页码Page 2 / 9发布Issue date 2013-2-171.目的:为了让使用者学习怎么样从开始到结束创建新文件,包括输入数据和使用线性转换等。
2.范围:生产,质量及工程人员。
3.内容:3.1打开Q-DAS 软件,选择用户名:Superuser, 并选择所需模块:QS-STAT(过程分析), PROCELLA,Q-QISQ-DAS软件基础应用页码Page 3 / 9发布Issue date 2013-2-173.2.数据录入:3.2.1.操作:首先选择PROCELLA模块或者QS-STAT模块下的过程分析模块,在该模块下选择文件下的新文件并点击。
如下图:Q-DAS软件基础应用页码Page4 / 9发布Issue date2013-2-17根据需要,选择定量的参数或者定性的参数,并选择数量,如:定量参数为5个,定性的参数为1个,点击是。
3.2.2. 在零件栏中,根据图纸信息录入零件编号及零件名称。
如下图:通过如下3个图标,可以再零件栏,被测参数及数值三个窗口间相互切换。
Q-DAS软件基础应用页码Page 5 / 9发布Issue date 2013-2-173.2.3. 从零件栏切换到被测参数栏,并输入相应的参数号及名称。
Q学习原理及例子

Q学习原理及例⼦这篇教程通过简单且易于理解的实例介绍了Q-学习的概念知识,例⼦描述了⼀个智能体通过⾮监督学习的⽅法对未知的环境进⾏学习。
假设我们的楼层内共有5个房间,房间之间通过⼀道门相连,正如下图所⽰。
我们将房间编号为房间0到房间4,楼层的外部可以被看作是⼀间⼤房间,编号为5。
注意到房间1和房间4可以直接通到房间5。
我们可以⽤图来表⽰上述的房间,将每⼀个房间看作是⼀个节点,每⼀道门看作是⼀条边(链路)。
在这个例⼦中,我们可能在任意⼀间房间中放置⼀个智能体(机器⼈),并期望该智能体能够从该房间开始⾛出这栋楼(可以认为是我们的⽬标房间)。
换句话说,智能体的⽬的地是房间5。
为了设置这间房间作为⽬标,我们为每⼀道门(节点之间的边)赋予⼀个奖励值。
能够直接通到⽬标房间的门赋予⼀及时奖励值100,⽽其他的未与⽬标房间直接相连的门赋予奖励值0。
因为每⼀道门都有两个⽅向,因此,每⼀道门在图中将描述为两个箭头。
如下所⽰:当然,从房间5到房间5的奖励值也是100,其他所有直接通到⽬标房间5的奖励值也是100。
在Q-学习中,学习的⽬标是达到具有最⾼奖励值的状态,因此,如果智能体到底了⽬标位置,它将永远的留在那⼉。
这种类型的⽬标被称为“吸收⽬标”。
想象我们的智能体是⼀个不会说话的虚拟机器⼈,但是它可以从经验中学习。
智能体能够从⼀个房间到底另外⼀个房间,但是它对周围的环境⼀⽆所知,它不知道怎么⾛能够通到楼层外⾯(房间5)。
假设我们想对智能体从某⼀个房间中撤退的过程进⾏建模,现在,我们假设智能体在房间2内,我们希望智能体通过学习到达房间5。
Q-学习中的术语包括状态(state)和动作(action)。
我们将每⼀个房间称为⼀个“状态”,智能体从⼀个房间到另⼀个房间的移动过程称为“动作”。
在我们的⽰意图中,状态被描述为节点,动作被描述成箭头。
假设智能体处于状态2,那么,它从状态2能够直接到达状态3,因为状态2和状态3相连。
然⽽,智能体从状态2不能直接到达状态1,因为在房间2和房间1之间没有直接相通的门,也即没有箭头存在。
Q-DAS 产品和服务产品手册说明书

Q-DAS PRODUCTS AND SERVICESPRODUCT BROCHUREStatistical expertise due to our involvement in the creation of guidelines, standards and reference manualsCONVINCING ARGUMENTSQ-DAS products are established as a global standardExchange of information with third-party systems (CAQ, MES, SAP)Developing the Q-DAS ASCII transfer format and industry standard AQDEF , we have the authority of data formatHands-on transfer of knowledge based onexperience and expertiseVariety of interfaces for a direct connection to many measuring instrumentsQ-DAS converter interfaces ensure readability of foreign formatsEvaluation in line with standards and guidelinesStatistical software products available in 22 languagesInternational partnernetwork offers worldwide customer support4681216182022242628303034 36 40Measurement process capability - solara.MP ®Process qualification - qs-STAT ®Design of experiments - destra ® / vidara ®Real-time visualisation - O-QIS ®Automated data processing - M-QIS ®System solution - Q-DAS CAMERA ® ConceptFlexible display of results - Q-DAS WebAutomated transfer of data - Q-DM DatamanagementVisual support - 3D CAD ViewerIndividual report layout - Form DesignerInspecting initial samples - ISREfficient application of Q-DAS software – Training and ConsultingEasy integration - Interfaces3D measurement data management - eMMA Software SuiteSystem implementation - Q-DAS ServicesCONTENTSHEXAGON MANUFACTURING INTELLIGENCE | | 4solara.MP ®MEASUREMENT PROCESS CAPABILITYsolara.MP offers a broad variety of graphics users apply as a visual support to interpret the statistics they calculated. Users may customise any available graphic for a quick and professional overview of measurement process capability.Reports provide users with a concise and appealing overview of statistics and graphics. These reports frequently document measurement process capability. They can be stored as PDF files or sent as an email attachment. Reports used as graphic files are easy to integrate into third-party systems.To avoid misinterpretations of process data, the recorded measured values have to be reliable reflecting the real conditions, i. e. measurement processes have to be capable of performing the required task in the respective situation. solara.MP is the perfect choice to establish measurement process capability.APPEALING GRAPHICS, CONVINCING STATISTICS AND DETAILED REPORTSATTRIBUTE MEASUREMENT SYSTEM ANALYSISThe signal detection approach is designed to compare attribute values to reference values. Without any reference values | | HEXAGON MANUFACTURING INTELLIGENCE5HEXAGON MANUFACTURING INTELLIGENCE | | 6REPORTSReports provide users with a concise and appealing overview of statistics and graphics. These reports frequently document measurement process capability. They can be stored as PDF files or sent as an email attachment. Reports used as graphic files are easy to integrate into third-party systems. | | HEXAGON MANUFACTURING INTELLIGENCE710HEXAGON MANUFACTURING INTELLIGENCE | | procella offers more than the “one and only“ default input screen mask. A flexible design is one of the key benefits ofprocella. The graphics displayed to the operators are defined during the program’s implementation and configuration. These graphics include value charts, summary graphics and even images, CAD drawings and inspection notes regarding the part or characteristics to be measured. procella visually indicates where and how an operator has to measure the part, even by applying different views.procella visualises statistical deviations from process specifications in alarm dialogue boxes. Alarms are, for example,violations of tolerance limits or control limits, or violations in quality control charts or trend processes. As soon as an alarm occurs, the operator will be prompted to enter events, causes and measures to identify clusters and record deviations. The application of quality control charts and the observation of control limits in particular maintain process stability.procellaThe SPC tool procella collects measurement and test data manually or transfers them directly from various types ofmeasuring equipment via interface. Measuring equipment is either directly connected to the computer via interface or it transmits data via multiplexer.Operators first select the test plan of the part to be measured either by choosing it from the list of all test plans or by using a barcode scanner. With a test plan selected, procella shows a graphical user interface for an easy recording and evaluation of measurement and test data. The program guides operators through the part inspection task and indicates any deviations from the test sequence. Operators are able to schedule setup measurements and handle incomplete measurements.The recording of test data first requires a careful definition of what operators are allowed to do and what they are not. This is what the user management of Q-DAS software products does so that operators can only see and use the predefined input screen mask. This is the reason why operators do not need any training in procella since administrators clearly define the options and liberties available to them. The application of the software thus becomes self-evident.pool from the Q-DAS database. The system evaluates theassociated information and provides them in the form ofreports. It sends PDF reports as an email attachment to aspecified group of recipients or stores them in a directoryQ-DAS statistical software products load data from the database, evaluate them and generate associated reports. M-QIS (Management Quality Information System) automates all these steps.AUTOMATED GENERATION OF REPORTSM-QIS®LONG-TERM ANALYSES BASED ON COMPRESSED RESULTSM-QIS provides users with the option to calculate process statistics continuously over a long period and to store the resultsDATA ARCHIVINGQ-ARC (archiving) optimises and keeps the performance of the database daily in use but still accesses historical data in case of need. The tool transfers data automatically from the database to an external storage location at regular intervals to keep the active database lean.the light turns red indicating a problemto users of O-QIS Web. Clicking on thislight, users get detailed information atthe next website, e.g. value charts ofthe part’s characteristics causing theproblem. Updating the view cyclically,users always load and visualise currentmeasured values from the database.configure in Q-DM. These rules ensure a clear allocation of measurement information in the database.A project engineer of the Q-DAS System Integration team supports customers in configuring Q-DM during the initialinstallation of Q-DAS software. The team always considers the IT infrastructure, the data flow and the database system of the respective customer.Q-DM structures data that have been recorded locally and transfers them to a central data pool.Q-DM DATAMANAGEMENTCONFIGURATION OPTIONSYou may adjust a wide range of settings in Q-DM, e.g. how to respond to alarms occurring while loading files in the database and how to store specific information to be considered in subsequent evaluations. The tool is able to generate protocols when a problem occurs while transferring data - e.g. due to a missing network connection or erroneous files - and sends them tosystem administrators by email. The major task of Q-DM Datamanagement is to guarantee a smooth data flow.PROCESS PARAMETERSQ-DM ConverterQ-DAS DATABASEAQDEF format FOREIGN FORMATSAQDEF format3D CAD VIEWERFORM DESIGNERREPORT CONFIGURATIONUsers needing to adapt report templates use the Form Designer to modify them or to create individual templates.The Form Designer creates report templates for all Q-DAS products. Reports may show any kind of output point availablein Q-DAS software products, e.g. texts, statistics, formulas and graphics. They also integrate jpg and BMP graphics or CAD models directly and link them to characteristics information. The recipient of a report easily understands how statisticsand graphics relate to the respective product. Users position output points in a report template by using drag & drop functionalities.The Form Designer is often applied together with M-QISEngine in order to create individual reports for differentrecipients. Users select and apply the created reporttemplates in Q-DAS products.To avoid the need for entering recurring reference data againand again, such reference data can be managed throughreference catalogues. The reference data entries can beselected directly and will be transferred to the input screens.A combo box provides the catalogue entries in the associatedwindows. Several catalogues are available: customers,creators, reasons for sample inspection, types of sampleinspection, gauges, units etc.SUMMARY OF FUNCTIONSOutput of individual values and min/max values with comments on each characteristic on the output formOption to specify whether the individual values for each characteristic should be outputOut-of-tolerance values highlighted on the output formSymbols for types of measured characteristics (shape and positional tolerances, physical parameters, …) are included.The report shows the corresponding symbols.Selection based on the different criteria of report elementsClassification of characteristics according to the method of sample inspection; i.e. verification of appearance,dimensions, materials, reliability or functionCharacteristics are provided automatically on a separate page for each type of sample inspectionEntering circulation listsConfiguration of input screensData analysis with export to qs-STATForm Designer to design company-specific reportsManagement of constituents/hazardous materials in purchased partsMost of the methods of measurement process capability provided by VDA Volume 5 and ISO 22514-7 can only be applied with the help of computers.Learn how to use the methods for determining measurement system and measurement process capability in solara.MP . The seminar also shows users how to visualise evaluation results and how to consider different company guidelines.MACHINE PERFORMANCE / PROCESS CAPABILITY IN qs-STATMEASUREMENT SYSTEM ANALYSIS IN solara.MP/destraMEASUREMENT UNCERTAINTY ACCORDING TO VDA 5/ISO 22514-7 IN solara.MPIt is crucial to master statistical methods and suitable software to perform machine performance studies and process capability analyses efficiently.This seminar teaches how to conduct machine performance studies and process capability analyses in qs-STAT. Users gain necessary background knowledge of efficient data storage and are able to comprehend evaluation strategies and associated evaluation results.Basic requirement for proper machine acceptance or an appropriate process analysis is the established capability of the applied measuring equipment.This seminar shows users how to apply different methods of measurement system analysis in solara.MP and destra. They visualise evaluation results in consideration of various company guidelines and pick up some useful tips and tricks on handling files and databases.TRAINING AND CONSULTINGADDITIONAL Q-DAS SOFTWARE TRAINING COURSES AND SERVICESQ-DAS offers special consulting services as well as individual and advanced training courses focusing on software-specific aspects or on specified tasks, such as• Seminars for users and administrators configuring the software in a company (key users)• Training courses on the creation of reports and input screen masks in the Form/Mask Designer• Efficient application of databases and selections• Upgrading from version 11 to version 12• Development of company-specific evaluation strategies• How to handle and adapt evaluation strategies correctlyPROFESSIONAL, INDIVIDUAL AND EFFICIENT CONSULTING SERVICESYou benefit from a broad variety of consulting services due to an extensive network of experts in different fields and industries. Here is a selection of topics we cover. Q-DAS supports you in...• introducing SPC, the implementation of Q-DAS statistical software included.• creating GPS-compliant technical drawings and in tolerancing aspects.• performing measurement system analyses and in tolerancing aspects.• designing, introducing, maintaining and developing management systems and teach you how to apply them efficiently (ISO 9001, IATF 16949, EN 9100, ISO/IEC 17025, ISO 14001, ISO 50001).• performing potential analyses to optimise processes.• implementing process improvement strategies, especially Six Sigma.• creating company-specific and industry-specific audit concepts and audit programmes.• conducting internal and supplier audits in compliance with industry standards.• undertaking the tasks of an external management representatives for quality and/or environment in SMEs International offices, distribution partners and subsidiaries of Q-DAS make these services available worldwide.evaluation based on the acquired data in order to reach smart and reliable decisions without any time-consuming and error-prone data conversion.Q-IF INTERFACES CONNECTING PORTABLE MEASURING EQUIPMENT AND MULTIPLEXERSUsers transfer measurement data directly to Q-DAS software products via serial interface (RS-232 or USB). Q-DAS products currently support more than 150 measuring instruments and multiplexers by default. There are various interface packages available connecting these devices to the software.INTERFACESQ-DAS packages offer interfaces for the communicationbetween different types of portable measuring equipment,measuring instruments having a RS-232 interface, variouseMMA SOFTWARE SUITEeMMA MDM SERVER/CLIENTeMMA MDM is an enterprise IT solution created to structure and manage 3D measurement data, thus closing theinformation gap in the quality assurance process. eMMA MDM provides controlled access to measurement plans, alignment systems, tolerances, measurement results, and analysis sessions.An integrated and central data management gives full control of all data. The import and export of quality data into/from different data formats (*.dmi, *.dmo, *.dfq, *.csv, etc.) is thus possible. eMMA MDM Server/Client tracks and manages project changes and user interactions with the help of versioning and change management.eMMA ANALYSTeMMA Analyst is a flexible and versatile module for the analysis of measurement results. Using statistical key performance indicators (KPIs), it provides insights that enable users to have better control over prototyping, launch, ramp-up and production processes. eMMA Analyst supports both PDF documentation and interactive on-the-fly 3D analysis.The 3D environment integrated into eMMA Analyst offers different graphs to display the measurement results associated with each feature. Besides the natively supported graphs, eMMA Analyst also supports the computation and visualisation of statistical metrics using the qs-STAT engine.eMMA INSPECTOReMMA Inspector is a module specially designed to support the easy and fast analysis of large sets of optical measurement results. The rich 3D native environment enables users to smoothly explore and interact with the data as they identify and compare regions of interest. Likewise other eMMA modules, eMMA Inspector also supports both PDF documentation and interactive on-the-fly 3D analysis while also providing the option to create a video of the day.The fast and easy loading and selection of measurement results along with the graphic options for the display of the results provide a clear overview of the production quality over time. The results of these analyses can later be saved as a 3D session or exported as a PDF report or PowerPoint presentation for easier distribution.eMMA SOFTWARE SUITE eMMA ASSEMBLEReMMA Assembler is a module for graphical analysis of virtual assemblies based on eMMA Analyst. It combines the powerful analytic capabilities of the eMMA Analyst to be applied simultaneously to multiple component parts and virtual linked-features. Individual parts or assembly structures of the functional areas can be assembled and analysed with transformations according to the assembly position, evaluation definitions, manually generated or adopted local alignment systems to form a virtual assembly. For simultaneous analysis of the measurement results of all selected components, itis possible to add individual features as well as new linked-features from the component parts involved. For instance, one of the most popular applications of eMMA Assembler is virtual analysis of flush and gap combining multiple parts. For documentation, scenes with any component and feature selection can be exported as a presentation and PDF report.eMMA REPORTERQuality assurance at the production line requires the detection of tolerance deviations in real time and the identificationof the cause of such deviations. eMMA Reporter is a web-based module that allows company-wide monitoring of manufacturing quality at any number of production sites in real time. Tolerances defined within the product design data are used as the basis for the evaluation of different productionand construction stages. The software recognises andreports deviations from manufacturing tolerances in realtime and supports root cause analysis. In the case of adetected out-of-tolerance deviation, the system sendscustomisable warning messages via email or SMS toauthorised users. | | HEXAGON MANUFACTURING INTELLIGENCE41Q-DAS ® SERVICESINSTALLATION AND CONFIGURATIONThe implementation of the Q-DAS CAMERA Concept starts with the installation. We install the respective software components according to your system specifications and configure and adjust them to your field of application.UPGRADESDo you want to upgrade your software version to benefit from an advanced or extended range ofEmail:***************Email:************************Email:**************Email:********************Email:************** | | HEXAGON MANUFACTURING INTELLIGENCE 43WE ARE PLEASED TO SUPPORT YOU. PROFESSIONALLY .CONTACTHexagon Manufacturing Intelligence helps industrial manufacturers develop the disruptive technologies of today and the life-changing products of tomorrow. As a leading metrology and manufacturing solution specialist, our expertise in sensing, thinking and acting – the collection, analysis and active use of measurement data – gives our customers the confidence to increase production speed and accelerate productivity while enhancing product quality. Through a network of local service centres, production facilities and commercial operations across five continents, we are shaping smart change in manufacturing to builda world where quality drives productivity. For more information, visit .Hexagon Manufacturing Intelligence is part of Hexagon (Nasdaq Stockholm: HEXA B; ), a leading global provider of information technologies that drive quality and productivity across geospatial and industrial enterprise applications.COORDINATE MEASURING MACHINES3D LASER SCANNINGSENSORSPORTABLE MEASURING ARMSSERVICESLASER TRACKERS & STATIONSMULTISENSOR & OPTICAL SYSTEMSWHITE LIGHT SCANNERSMETROLOGY SOFTWARE SOLUTIONSCAD / CAMSTATISTICAL PROCESS CONTROLAUTOMATED APPLICATIONSMICROMETERS, CALIPERS AND GAUGESDESIGN AND COSTING SOFTWAREThe broad Q-DAS catalogue of hands-on seminars delivers essential methodological skills of statistical process control, production metrology and quality assurance. This is complemented by general and company-specific training in any available Q-DAS software product. These support our users in focusing on goals while fulfilling their tasks.Q-DAS software sets standards for quality assurance inindustrial production. 150 000 users all over the world trustin Q-DAS and successfully apply its software as well asassociated training and consulting services to raise productand process quality.More than 8 000 customers from various industrieshave already chosen Q-DAS solutions, and are profitablyharnessing the full potential of correct and reliable statisticalevaluations as well as the planning of 3D features alongthe assembly sequence. Q-DAS software products planmeasurement processes and record, visualise and evaluatedata in 55 countries to increase efficiency.© 2019 Hexagon AB and / or its subsidiaries and affiliates. All rights reserved. This document is accurate as of its publication date. Information is subject to change without notice.。
Q-DAS培训
这些K域信息对于数据库中数据的筛选有决定性作用
Q-DAS数据库相关操作
数据库过滤
一、简单过滤 二、快速过滤
三、复杂过滤
过滤功能的使用首先要导入附加信息的 目录信息
选项-系统设置-目录-出现对话框- 来自文件的目录数据-文件选择: C盘-Q-DAS-ME-6-PROGRAM- CATALOG
一些主要的测试结果的概括表可通过如下菜单进行显示: 数值 – 试验方式 – 概括 较长使用的是抽检分析模式下的首件报告,5件报告及冷且加工等实验方式
Q-DAS标准操作界面的相关功能
六、多参数 – 概况
箱型图 该 图可以对如下一些值进行对比显示 平均值/中值/ 变化范围(99,73% resp. +/-3s)/最大值/最小值/ 值的个数
机器必须装满部件,至少8 个小时内机器必须停止运行 (切断电源),至少加工5 个部件
运用统计学的方法进行研究 与评估,Q-STAT®软件按照 GM要求设置了设备验收标 准。对于换刀及冷机加工有 相应的计算方法。
其实三种过滤方式都可以实现数据筛选,简单过滤和快速过滤是将常用的过 滤器进行人性化操作界面设置,筛选方法清晰,但是筛选方式比较死板,速 度较慢且不能保存。随着Q-DAS版本升级会逐步取消。
数据库数据量较大时,过滤速度会越来越慢。及时使用较为细致的过 滤后打开速度也会很慢,这是因为每次数据打开时都要经过大量的计 算,以便显示出能力值,直方图等详细信息。所以,如果你只是需要 查看数据值,而不需要分析能力等情况下,可以选择抽检分析模块以 加快数据打开速度。
Q-DAS标准操作界面的相关功能
PQC项目的Cpk分析时,如果出现其他非正态分布,其计算结果是否有其 他说明,对于设备状态是否还有其他指导意义。
TricentisTosca培训课程-2024鲜版

检查输入数据是否符合预期,以及数据处理 过程中是否出现错误或异常。
2024/3/27
14
04
高级功能应用与实践
2024/3/27
15
数据驱动测试实现方法
2024/3/27
数据准备
了解如何创建和管理测试数据,包括从外部数据源导入、数据清 洗和格式化等。
数据驱动测试用例设计
学习如何编写可重用、可维护的数据驱动测试用例,以及如何使用 参数化查询和动态数据生成技术。
20
实战演练:编写自动化测试脚本
编写测试脚本的步骤 和技巧
演示如何编写高质量 的自动化测试脚本
2024/3/27
使用Tricentis Tosca 进行自动化测试脚本 的编写和调试
21
问题解答与经验分享
解答学员在实战演练中遇到的问 题
分享自动化测试的最佳实践和经 验教训
提供进一步学习和探索的建议和 资源
通过编写脚本或使用自动化工具来执 行测试用例,以验证软件系统的功能 和性能。
自动化测试优势
自动化测试适用场景
回归测试、性能测试、安全测试等。
提高测试效率、减少人为错误、实现 持续集成和持续交付等。
2024/3/27
8
TricentisTosca核心功能
模块化测试设计
提供灵活的模块化框架,支持创 建可重用的测试组件和模块。
TricentisTosca是一款功能强大的连续测试平台,支持端到端测试自动化,旨在提高 软件质量并加速应用程序上市时间。
该平台提供了全面的测试解决方案,包括测试用例设计、测试数据管理、测试执行 和缺陷跟踪等功能。
2024/3/27
TricentisTosca具有易于使用的界面和强大的自定义能力,可满足不同团队的特定需 求。
- 1、下载文档前请自行甄别文档内容的完整性,平台不提供额外的编辑、内容补充、找答案等附加服务。
- 2、"仅部分预览"的文档,不可在线预览部分如存在完整性等问题,可反馈申请退款(可完整预览的文档不适用该条件!)。
- 3、如文档侵犯您的权益,请联系客服反馈,我们会尽快为您处理(人工客服工作时间:9:00-18:30)。
七、评定设置
验收阶段: MRO saved distribution 过程/PPAP阶段: GQP 6 sigma 2004年以前设备: GQP non 6 sigma 评价标准选择是根据GM要求 对Q-DAS进行评定设置的,每 种评价标准的计算方法是相同 的,只是评价要求不同。 评价标准可以自行设定,但是 不能保存为GMPT的标准
概况 – C 值 该图对性能因子进行对比显示。描述 系统潜在能力的性能因子 (Cm, Cp, Pp, ...)显示在图的后排。描述系统实 际能力的性能因子 (Cmk, Cpk, Ppk, ...) 显示在图的前排。 特性值 被测参数 通过该菜单项将列表显示所有被测参 数的评定结果。 概况 – 特性值 被测参数 …
一些主要的测试结果的概括表可通过如下菜单进行显示: 数值 – 试验方式 – 概括 较长使用的是抽检分析模式下的首件报告,5件报告及冷且加工等实验方式
Q-DAS标准操作界面的相关功能
六、多参数 – 概况
箱型图 该 图可以对如下一些值进行对比显示 平均值/中值/ 变化范围(99,73% resp. +/-3s)/最大值/最小值/ 值的个数
Q-DAS针对MRO的验收使用
在设备与机床的验收时,无论是在供应商处,还是在生产车间,都应该 采用同样的验收模式。
Q-DAS针对MRO的验收使用
在不带工件的情况下,至少应持续运行8 小时以检验机械 系统和控制系统的可靠性
机器应满负荷运行,对于旋转,举升,换向,输送滚道,测量等 传送装置,需要带工件进行耐久性试验
计算出Ppk值为1.73,那么上下限1.44和2.02代表什么意思,作用何在,怎么 得出的? 置信区间,参考样本量 数量对结果的影响。
Q-DAS标准操作界面的相关功能
Pp:2.01的右下角有个小的图标15代表什么意思?为什么Pp〈Ppk,在什么 情况下出现此情况?这种情况下Pp是否是真值?是否要有特殊说明或验证方 法来评定Pp值? 形位公差,没有下限时,Pp会显示915,没有Pp结果 有下线,下线为0时(不选择下自然界限),会在Pp下显示915,有Pp值,且 Pp值没有下角标15 有下线,下线为0时,同时选择下自然界限时,会计算出Pp值, Pp值有下 角标15但是没有实际意义,制作为参考
Q-DAS标准操作界面的相关功能 日常使用疑问:
在分析数据时,有些数据显示结果是Ppk,有些是Tpk,两者有何区别?应如 何看待此结果?对于两者的输出选择依据的标准是什么?评判标准是否相同? 是否还有其他输出(例如Pok等)? 过程能力判断标准:GM标准是否超公差,是否超控制线 Tp出现,说明有超出控制线的点,或者有超差点。控制图不受控,或有出现 超差的风险。 只有在正态分布情况下,数据量大于50件,过程受控,多个条件同时满足时 才会出现cpk Po只出现在位置度中,更改时所有数据都要同时更改,否则需要更改评定设 置,Q-DAS自动计算综合位置度。
四、分布模式
通过激活不同的评估策略,有多种不同 分布方式可用来描述测量结果。然而 基于给定的实验方式和方法的最初分 布模式是由Q-STAT程序自动载入的。 如果有必要进行其他分布模式的评估 的话,必须另外重新手动设定。 如果你手动重新选择了分布模式,你 必须确保该模式是适用的。因为QSTAT程序将会以你所确定的评估策略, 分析统计测量值给出相应的最匹配评 估结果。也就是说,错误的评估策略 将会给出错误的评估结果。 分布状态只在设备验收时有参考意义, 非正态分布说明设备状态异常,新设 备应该符合正态分布模式。
这些K域信息对于数据库中数据的筛选有决定性作用
Q-DAS数据库相关操作
一、简单过滤
数据库过滤
二、快速过滤 三、复杂过滤
过滤功能的使用首先要导入附加信息的 目录信息 选项-系统设置-目录-出现对话框- 来自文件的目录数据-文件选择: C盘-Q-DAS-ME-6-PROGRAM- CATALOG 在CATALOG中选择相应的数据库配置, 例如GEN3选择
一、菜单
所有功能汇总,可以在菜单中选择相关功能进行文件的处理 二、图标栏: 一些图标、功能的快捷键
三、工作域: (打开的标准页面)单值进程,直方图,表3,分析用质量控制图
1. 2. 3. 4. 单值进程:整个系统变化,测量过程及测量值变化趋势 直方图:数据分级,分布模式,频率概率状态 表3:数据分布状态,能力分析结果,评定结果 分析用质量控制图:现有数据状态下受控情况
Q-DAS数据库相关操作
基本要求: 必须的K-域: • K0100 文件中被测参数的数量 • K1001 零件号 • K1002 零件名称 • K2001 被测参数号 • K2002 被测参数名称 • K0001 测量值 附加信息: (可选) •日期/时间 •批次号 •事件 •夹具/巢穴号 •机器号 •操作工/检验员 •检具 •....
在下自然界限状态下,数据越趋近于下线状态越好,Xbar接近下线时计算出的 Pp下限可能会很小,系统输出会取Pp两边界限中小的一个,导致系统误认为 数据不良,失去参考意义,所以在单边自然界限时Pp没有实际意义。
Q-DAS标准操作界面的相关功能
PQC项目的Cpk分析时,如果出现其他非正态分布,其计算结果是否有其 他说明,对于设备状态是否还有其他指导意义。 Q-DAS是怎样判断分布情况,来选择分布状态的,不同的分布对于评定有何区别?分 布状态是否可以人为修改?特殊分布状态下的PPK结果判定标准是否有区别? 数据分布模型较多,Q-DAS设置了常用模式的自动选则,根据数据的实际 分布情况判定分布模式,这个模式只对数据分布进行判定,对能力计算 结果没有影响,分布状态判定后不可选择。 Johnson 族分布 共有几种理论分布模型。 使用 Johnson 分布可以涵盖范围较广的分布, 例如,对数正态分布、无界分布、有界分布 扩展的正态分布 当呈正态分布的过程呈现均值位置的额外波动时,则形成扩展的正态分布 (MM = 移动平均值) 分布模式请参考SPC教材及统计学教材 分布只在验收阶段有意义,对与新设备去除人员等特殊原因数据应该服 从正态分布,如出现其他类型非正态分布,可以判定机床是否异常原因 导致的变差
二、统计图
基于单值计算上的统计分析图。 过程分析模块和测量系统分析 中不同的程序为每个子群提供 了计算统计值的能力。 特性值 – 单值进程 – 方差……
对于每种单值图都有对应的统 计图,用于各种子群数据计算 查询
Q-DAS标准操作界面的相关功能
三、数值化结果
通过相应的菜单项可以输出需要的 几个数值化结果,主要的几个数值 化结果列表如下: 数值 – 评定结果 数值 – 表格页- 表1-4 这些数值中包括标准的一些统计结 果及C 值.表1-4汇总即为评定结果 另外通过 数值 – 单值 - 全部 或 数值 – 单值 – 值 你可以显示测量所得的原始值及相 关附加信息.
Q-DAS数据库相关操作
数据过滤方法的注意事项:
1.附加信息足够,且设置合理,并被充分输入
2.快速过滤可以添加过滤条件,筛选方式是从零件-参数信息-数值 信息逐级完成,速度相对较快
3.所有K域信息都可以做为复杂过滤的条件,复杂过滤可以保存,常用 过滤方式可以建立独立过滤器后保存,并且可以多个叠加使用。 其实三种过滤方式都可以实现数据筛选,简单过滤和快速过滤是将常用的过 滤器进行人性化操作界面设置,筛选方法清晰,但是筛选方式比较死板,速 度较慢且不能保存。随着Q-DAS版本升级会逐步取消。 数据库数据量较大时,过滤速度会越来越慢。及时使用较为细致的过 滤后打开速度也会很慢,这是因为每次数据打开时都要经过大量的计 算,以便显示出能力值,直方图等详细信息。所以,如果你只是需要 查看数据值,而不需要分析能力等情况下,可以选择抽检分析模块以 加快数据打开速度。
Q-DAS标准操作界面的相关功能
五、试验方式
试验方式其中的一个重要的应用是检验统计分析是否合适。特别是偶然 性实验和异常值实验,及均等变量,平均值和分布实验(不同的模块有不 同的实验方式)。 而实验结果总是以这样的方式表示:你可以以显示的颜色来判定,如果给 定的假设条件H0 满足要求则显示为绿色,否则将显示为红色,代表未满 足的假设条件H1。
Q-DAS标准操作界面的相关功能
其他常用图表的说明:
一、单值图:
•单值进程图 •数值离散 ������ 量仪分辨率 ������ 数值累积 ������ 量仪故障 •直方图 •积累线 ������ 直方图/离散图的积累图 ������ 分布模式的适配性 •概率网 ������ 概率 ������ 模式适用性,分布适配性 ������ 分位线
Q-DAS标准操作界面的相关功能
•在数据分析中Q上3和Q下3代表什么意思?两者之差如何看待? 上下分位数:Q上3=99.865%;Q下3=0.135%;Q上3-Q下3=99.73%(6δ ) 上/下分位点之间的差即过程离散宽度。 Q-DAS中计算能力时使用作为分母,Xpk=USL-LSL/ Q上3-Q下3
•在直方图中显示的绝对频率和相对频率是何意?对数据分析有何指导意义?
直方图可以反映: •分布形态(变化的大小, 是否为 正态分布, 峰度如何) •分布区间(在规格界限之内) •偏度(非对称)
Q-DAS数据库相关操作
Q-DAS数据库数据文件结构
Q-DAS数据库相关操作
键值-域(K-域) • 所有的描述信息都必须以特定的K-域开头 • 从而保证相关信息能够在软件中识别并存储到数据库中
Q-DAS标准操作界面的相关功能 常用工具
1.零件信息批量上传?(例如相同的控制线等数据) 有些相同数据可以选择以下进行设定,但是前提是要确定所有数据确实相同
被测参数栏,需要批量设置的项目右键, 接收登录,为了: 该类操作对参数一致性要求很高,但对 于级别、类型等栏目无效,建议慎重使 用
Q-DAS标准操作界面的相关功能
2.不同设备数据怎么区分?如何实现分类/筛选? 在特殊--分类--激活后按照可选条件查询并分类