MATLAB图像处理函数大全[1]
Matlab函数大全(第一版)

MatLab函数大全一、常用对象操作:除了一般windows窗口的常用功能键外。
1、!dir可以查看当前工作目录的文件。
!dir& 可以在dos状态下查看。
2、who可以查看当前工作空间变量名,whos可以查看变量名细节。
3、功能键:功能键快捷键说明方向上键Ctrl+P返回前一行输入方向下键Ctrl+N返回下一行输入方向左键Ctrl+B光标向后移一个字符方向右键Ctrl+F光标向前移一个字符Ctrl+方向右键Ctrl+R光标向右移一个字符Ctrl+方向左键Ctrl+L光标向左移一个字符home Ctrl+A光标移到行首End Ctrl+E光标移到行尾Esc Ctrl+U清除一行Del Ctrl+D清除光标所在的字符Backspace Ctrl+H删除光标前一个字符Ctrl+K删除到行尾Ctrl+C中断正在执行的命令4、clc可以命令窗口显示的内容,但并不清除工作空间。
二、函数及运算1、运算符:+:加,-:减, *:乘, /:除, \:左除 ^:幂,‘:复数的共轭转置,():制定运算顺序。
2、常用函数表:sin( ) 正弦(变量为弧度)Cot( ) 余切(变量为弧度)sind( ) 正弦(变量为度数)Cotd( ) 余切(变量为度数)asin( ) 反正弦(返回弧度)acot( ) 反余切(返回弧度)Asind( ) 反正弦(返回度数)acotd( ) 反余切(返回度数)cos( ) 余弦(变量为弧度)exp( ) 指数cosd( ) 余弦(变量为度数)log( ) 对数acos( ) 余正弦(返回弧度)log10( ) 以10为底对数acosd( ) 余正弦(返回度数)sqrt( ) 开方tan( ) 正切(变量为弧度)realsqrt( ) 返回非负根tand( ) 正切(变量为度数)abs( ) 取绝对值atan( ) 反正切(返回弧度)angle( ) 返回复数的相位角atand( ) 反正切(返回度数)mod(x,y) 返回x/y的余数sum( ) 向量元素求和3、其余函数可以用help elfun和help specfun命令获得。
MATLAB图像处理函数汇总
MATLAB图像处理函数汇总(一)1.applylut功能: 在二进制图像中利用lookup表进行边沿操作. 语法:A = applylut(BW,lut)举例lut = makelut('sum(x(:)) == 4',2);BW1 = imread('text.tif');BW2 = applylut(BW1,lut);imshow(BW1)figure, imshow(BW2)相关命令:makelut2.bestblk功能:确定进行块操作的块大小.语法:siz = bestblk([m n],k)[mb,nb] = bestblk([m n],k)举例siz = bestblk([640 800],72)siz =64 50相关命令:blkproc3.blkproc功能:实现图像的显式块操作.语法:B = blkproc(A,[m n],fun)B = blkproc(A,[m n],fun,P1,P2,...)B = blkproc(A,[m n],[mborder nborder],fun,...)B = blkproc(A,'indexed',...)举例I = imread('alumgrns.tif');I2 = blkproc(I,[8 8],'std2(x)*ones(size(x))');imshow(I)figure, imshow(I2,[]);相关命令:colfilt, nlfilter,inline4.brighten功能: 增加或降低颜色映像表的亮度.语法:brighten(beta)newmap = brighten(beta)newmap = brighten(map,beta) brighten(fig,beta)相关命令:imadjust, rgbplot5.bwarea功能: 计算二进制图像对象的面积. 语法:total = bwarea(BW)举例BW = imread('circles.tif');imshow(BW);附录MATLAB图像处理命令321 bwarea(BW)ans =15799相关命令:bweuler, bwperim6.bweuler.功能: 计算二进制图像的欧拉数. 语法:eul = bweuler(BW,n)举例BW = imread('circles.tif');imshow(BW);bweuler(BW)ans =-2相关命令:bwmorph, bwperim7.bwfill功能: 填充二进制图像的背景色.语法:BW2 = bwfill(BW1,c,r,n)BW2 = bwfill(BW1,n)[BW2,idx] = bwfill(...)BW2 = bwfill(x,y,BW1,xi,yi,n) [x,y,BW2,idx,xi,yi] = bwfill(...)BW2 = bwfill(BW1,'holes',n)[BW2,idx] = bwfill(BW1,'holes',n) 举例BW1 =[1 0 0 0 0 0 0 01 1 1 1 1 0 0 01 0 0 0 1 0 1 01 0 0 0 1 1 1 01 0 0 1 1 0 1 01 0 0 0 1 0 1 01 0 0 0 1 1 1 0]BW2 = bwfill(BW1,3,3,8)BW2 =1 0 0 0 0 0 0 01 1 1 1 1 0 0 01 1 1 1 1 0 1 01 1 1 1 1 1 1 01 1 1 1 0 1 1 11 0 0 1 1 0 1 01 0 0 0 1 0 1 01 0 0 0 1 1 1 0I = imread('blood1.tif');BW3 = ~im2bw(I);BW4 = bwfill(BW3,'holes');imshow(BW3)figure, imshow(BW4)相关命令:bwselect, roifill8.bwlabel功能:标注二进制图像中已连接的部分. 语法:附录MATLAB图像处理命令323L = bwlabel(BW,n)[L,num] = bwlabel(BW,n)举例BW = [1 1 1 0 0 0 0 01 1 1 0 1 1 0 01 1 1 0 1 1 0 01 1 1 0 0 0 1 01 1 1 0 0 0 1 01 1 1 0 0 0 1 01 1 1 0 0 1 1 01 1 1 0 0 0 0 0]L = bwlabel(BW,4)L =1 1 1 0 0 0 0 01 1 1 02 2 0 01 1 1 02 2 0 01 1 1 0 0 0 3 01 1 1 0 0 0 3 01 1 1 0 0 0 3 01 1 1 0 0 0 0 0[r,c] = find(L==2);rc = [r c]rc =2 53 52 63 6相关命令:bweuler, bwselect9.bwmorph功能:提取二进制图像的轮廓.语法:BW2 = bwmorph(BW1,operation) BW2 = bwmorph(BW1,operation,n) 举例BW1 = imread('circles.tif');imshow(BW1);BW2 = bwmorph(BW1,'remove'); BW3 = bwmorph(BW1,'skel',Inf); imshow(BW2)figure, imshow(BW3)相关命令:bweuler, bwperim, dilate, erode10.bwperim功能:计算二进制图像中对象的周长. 语法:BW2 = bwperim(BW1,n)举例BW1 = imread('circbw.tif');BW2 = bwperim(BW1,8);imshow(BW1)figure, imshow(BW2)附录MATLAB图像处理命令325 相关命令:bwarea, bweuler, bwfill11.bwselect功能:在二进制图像中选择对象.语法:BW2 = bwselect(BW1,c,r,n)BW2 = bwselect(BW1,n)[BW2,idx] = bwselect(...)举例BW1 = imread('text.tif');c = [16 90 144];r = [85 197 247];BW2 = bwselect(BW1,c,r,4);imshow(BW1)figure, imshow(BW2)相关命令:bwfill, bwlabel, impixel, roipoly, roifill12.cmpermute功能:调整颜色映像表中的颜色.语法:[Y,newmap] = cmpermute(X,map)[Y,newmap] = cmpermute(X,map,index)举例To order a colormap by luminance, use:ntsc = rgb2ntsc(map);[dum,index] = sort(ntsc(:,1));[Y,newmap] = cmpermute(X,map,index);相关命令:randperm13.cmunique功能:查找颜色映像表中特定的颜色及相应的图像. 语法:[Y,newmap] = cmunique(X,map)[Y,newmap] = cmunique(RGB)[Y,newmap] = cmunique(I)相关命令:gray2ind, rgb2ind14.col2im功能:将矩阵的列重新组织到块中.语法:A = col2im(B,[m n],[mm nn],block_type)A = col2im(B,[m n],[mm nn])相关命令:blkproc, colfilt, im2col, nlfilter15.colfilt功能:利用列相关函数进行边沿操作.语法:B = colfilt(A,[m n],block_type,fun)B = colfilt(A,[m n],block_type,fun,P1,P2,...)B = colfilt(A,[m n],[mblock nblock],block_type,fun,...)B = colfilt(A,'indexed',...)附录MATLAB图像处理命令327相关命令:blkproc, col2im, im2col, nlfilter16.colorbar功能:显示颜色条.语法:colorbar('vert')colorbar('horiz')colorbar(h)colorbarh = colorbar(...)举例I = imread('blood1.tif');h = fspecial('log');I2 = filter2(h,I);imshow(I2,[]), colormap(jet(64)), colorbar 17.conv2功能:进行二维卷积操作.语法:C = conv2(A,B)C = conv2(hcol,hrow,A)C = conv2(...,shape)举例A = magic(5)A =17 24 1 8 1523 5 7 14 164 6 13 20 2210 12 19 21 311 18 25 2 9B = [1 2 1;0 2 0;3 1 3]B =1 2 10 2 03 1 3C = conv2(A,B)C =17 58 66 34 32 38 1523 85 88 35 67 76 1655 149 117 163 159 135 6779 78 160 161 187 129 5123 82 153 199 205 108 7530 68 135 168 91 84 933 65 126 85 104 15 27相关命令:filter218.convmtx2功能:计算二维卷积矩阵.语法:T = convmtx2(H,m,n)T = convmtx2(H,[m n])相关命令:conv219.convn功能: 计算n维卷积.语法:C = convn(A,B)C = convn(A,B,shape)相关命令:conv220.corr2功能:计算两个矩阵的二维相关系数.语法:r = corr2(A,B)相关命令:std221.dct2功能:进行二维离散余弦变换.语法:B = dct2(A)B = dct2(A,m,n)B = dct2(A,[m n])举例RGB = imread('autumn.tif');I = rgb2gray(RGB);J = dct2(I);imshow(log(abs(J)),[]), colormap(jet(64)), colorbar J(abs(J) < 10) = 0;K = idct2(J)/255;imshow(K)相关命令:fft2, idct2, ifft222.dctmtx功能:计算离散余弦变换矩阵.语法:D = dctmtx(n)相关命令:dct223.dilate功能:放大二进制图像.语法:BW2 = dilate(BW1,SE)BW2 = dilate(BW1,SE,alg)BW2 = dilate(BW1,SE,...,n)举例BW1 = imread('text.tif');SE = ones(6,2);BW2 = dilate(BW1,SE);imshow(BW1)figure, imshow(BW2)相关命令:bwmorph, erode24.dither功能:通过抖动增加外观颜色分辨率,转换图像. 语法:X = dither(RGB,map)BW = dither(I)相关命令:rgb2ind25.double附录MATLAB图像处理命令331功能:转换数据为双精度型.语法:B = double(A)举例A = imread('saturn.tif');B = sqrt(double(A));相关命令:im2double, im2uint, uint826.edge功能:识别强度图像中的边界.语法:BW = edge(I,'sobel')BW = edge(I,'sobel',thresh)BW = edge(I,'sobel',thresh,direction)[BW,thresh] = edge(I,'sobel',...)BW = edge(I,'prewitt')BW = edge(I,'prewitt',thresh)BW = edge(I,'prewitt',thresh,direction)[BW,thresh] = edge(I,'prewitt',...)BW = edge(I,'roberts')BW = edge(I,'roberts',thresh)[BW,thresh] = edge(I,'roberts',...)BW = edge(I,'log')BW = edge(I,'log',thresh)BW = edge(I,'log',thresh,sigma)[BW,threshold] = edge(I,'log',...)BW = edge(I,'zerocross',thresh,h)[BW,thresh] = edge(I,'zerocross',...)BW = edge(I,'canny')BW = edge(I,'canny',thresh)BW = edge(I,'canny',thresh,sigma)[BW,threshold] = edge(I,'canny',...)举例I = imread('rice.tif');BW1 = edge(I,'prewitt');BW2 = edge(I,'canny');imshow(BW1);figure, imshow(BW2)27.erode功能:弱化二进制图像的边界.语法:BW2 = erode(BW1,SE)BW2 = erode(BW1,SE,alg)BW2 = erode(BW1,SE,...,n)举例BW1 = imread('text.tif');SE = ones(3,1);BW2 = erode(BW1,SE);imshow(BW1)figure, imshow(BW2)相关命令:bwmorph, dilate28.fft2功能:进行二维快速傅里叶变换.语法:B = fft2(A)B = fft2(A,m,n)举例load imdemos saturn2imshow(saturn2)B = fftshift(fft2(saturn2));imshow(log(abs(B)),[]), colormap(jet(64)), colorbar 相关命令:dct2, fftshift, idct2, ifft229.fftn功能: 进行n维快速傅里叶变换.语法:B = fftn(A)B = fftn(A,siz)相关命令:fft2, ifftn30.fftshif t功能:把快速傅里叶变换的DC组件移到光谱中心. 语法:B = fftshift(A)举例B = fftn(A);C = fftshift(B);相关命令:fft2, fftn, ifftshift31.filter2功能:进行二维线性过滤操作.语法:B = filter2(h,A)B = filter2(h,A,shape)举例A = magic(6)A =35 1 6 26 19 243 32 7 21 23 2531 9 2 22 27 208 28 33 17 10 1530 5 34 12 14 164 36 29 13 18 11h = fspecial('sobel')h =1 2 10 0 0-1 -2 -1B = filter2(h,A,'valid')B =-8 4 4 -8-23 -44 -5 40-23 -50 1 40-8 4 4 -8相关命令:conv2, roifilt232.freqspace功能:确定二维频率响应的频率空间.语法:[f1,f2] = freqspace(n)[f1,f2] = freqspace([m n])[x1,y1] = freqspace(...,'meshgrid')f = freqspace(N)f = freqspace(N,'whole')相关命令:fsamp2, fwind1, fwind233.freqz2功能:计算二维频率响应.语法:[H,f1,f2] = freqz2(h,n1,n2)[H,f1,f2] = freqz2(h,[n2 n1])[H,f1,f2] = freqz2(h,f1,f2)[H,f1,f2] = freqz2(h)[...] = freqz2(h,...,[dx dy])[...] = freqz2(h,...,dx)freqz2(...)举例Hd = zeros(16,16);Hd(5:12,5:12) = 1;Hd(7:10,7:10) = 0;h = fwind1(Hd,bartlett(16));colormap(jet(64))freqz2(h,[32 32]); axis ([-1 1 -1 1 0 1])34.fsamp2功能:用频率采样法设计二维FIR过滤器.语法:h = fsamp2(Hd)h = fsamp2(f1,f2,Hd,[m n])举例[f1,f2] = freqspace(21,'meshgrid');Hd = ones(21);r = sqrt(f1.^2 + f2.^2);Hd((r0.5)) = 0;colormap(jet(64))mesh(f1,f2,Hd)相关命令:conv2, filter2, freqspace, ftrans2, fwind1, fwind235.fspecial功能:创建预定义过滤器.语法:h = fspecial(type)h = fspecial(type,parameters)举例I = imread('saturn.tif');h = fspecial('unsharp',0.5);I2 = filter2(h,I)/255;imshow(I)figure, imshow(I2)相关命令:conv2, edge, filter2, fsamp2, fwind1, fwind236.ftrans2功能:通过频率转换设计二维FIR过滤器.语法:附录MATLAB图像处理命令337h = ftrans2(b,t)h = ftrans2(b)举例colormap(jet(64))b = remez(10,[0 0.05 0.15 0.55 0.65 1],[0 0 1 1 0 0]); [H,w] = freqz(b,1,128,'whole');plot(w/pi-1,fftshift(abs(H)))相关命令:conv2, filter2, fsamp2, fwind1, fwind237.fwind1功能:用一维窗口方法设计二维FIR过滤器.语法:h = fwind1(Hd,win)h = fwind1(Hd,win1,win2)h = fwind1(f1,f2,Hd,...)举例[f1,f2] = freqspace(21,'meshgrid');Hd = ones(21);r = sqrt(f1.^2 + f2.^2);Hd((r0.5)) = 0;colormap(jet(64))mesh(f1,f2,Hd)相关命令:conv2, filter2, fsamp2, freqspace, ftrans2, fwind2 38.fwind2功能:用二维窗口方法设计二维FIR过滤器.语法:h = fwind2(Hd,win)h = fwind2(f1,f2,Hd,win)举例[f1,f2] = freqspace(21,'meshgrid');Hd = ones(21);r = sqrt(f1.^2 + f2.^2);Hd((r0.5)) = 0;colormap(jet(64))mesh(f1,f2,Hd)相关命令:conv2, filter2, fsamp2, freqspace, ftrans2, fwind1 39.getimage功能:从坐标轴取得图像数据.语法:A = getimage(h)[x,y,A] = getimage(h)[...,A,flag] = getimage(h)[...] = getimage举例imshow rice.tifI = getimage;40.gray2ind功能:转换灰度图像为索引图像.语法:[X,map] = gray2ind(I,n)相关命令:ind2gray41.grayslice功能:从灰度图像创建索引图像.语法:X = grayslice(I,n)X = grayslice(I,v)举例I = imread('ngc4024m.tif');X = grayslice(I,16);imshow(I)figure, imshow(X,jet(16))相关命令:gray2ind42.histeq功能:用柱状图均等化增强对比.语法:J = histeq(I,hgram)J = histeq(I,n)[J,T] = histeq(I,...)举例I = imread('tire.tif');J = histeq(I);imshow(I)figure, imshow(J)imhist(I,64)figure; imhist(J,64)相关命令:brighten, imadjust, imhist43.hsv2rgb功能: 转换HSV值为RGB颜色空间. 语法:rgbmap = hsv2rgb(hsvmap)RGB = hsv2rgb(HSV)相关命令:rgb2hsv, rgbplot44.idct2功能:计算二维离散反余弦变换.语法:B = idct2(A)B = idct2(A,m,n)B = idct2(A,[m n])相关命令:dct2, dctmtx, fft2, ifft245.ifft2功能:计算二维快速傅里叶反变换.语法:B = ifft2(A)B = ifft2(A,m,n)相关命令:fft2, fftshift, idct246.ifftn功能: 计算n维快速傅里叶反变换. 语法:B = ifftn(A)B = ifftn(A,siz)相关命令:fft2, fftn, ifft247.sim2bw功能:转换图像为二进制图像.语法:BW = im2bw(I,level)BW = im2bw(X,map,level)BW = im2bw(RGB,level)举例load treesBW = im2bw(X,map,0.4);imshow(X,map)figure, imshow(BW)相关命令:ind2gray, rgb2gray48.im2col功能:重调图像块为列.语法:B = im2col(A,[m n],block_type)B = im2col(A,[m n])B = im2col(A,'indexed',...)相关命令:blkproc, col2im, colfilt, nlfilter49.im2double功能:转换图像矩阵为双精度型.语法:I2 = im2double(I1)RGB2 = im2double(RGB1)BW2 = im2double(BW1)X2 = im2double(X1,'indexed')相关命令:double, im2uint8, uint850.im2uint8功能:转换图像阵列为8位无符号整型. 语法:I2 = im2uint8(I1)RGB2 = im2uint8(RGB1)BW2 = im2uint8(BW1)X2 = im2uint8(X1,'indexed')相关命令:im2uint16, double, im2double, uint8, imapprox, uint16 51.im2uint16功能:转换图像阵列为16位无符号整型.语法:I2 = im2uint16(I1)RGB2 = im2uint16(RGB1)X2 = im2uint16(X1,'indexed')相关命令:im2uint8, double, im2double, uint8, uint16, imapprox 52.imadjust功能:调整图像灰度值或颜色映像表.语法:J = imadjust(I,[low high],[bottom top],gamma) newmap = imadjust(map,[low high],[bottom top],gamma) RGB2 = imadjust(RGB1,...)举例I = imread('pout.tif');J = imadjust(I,[0.3 0.7],[]);imshow(I)figure, imshow(J)相关命令:brighten, histeq53.imapprox功能:对索引图像进行近似处理.语法:[Y,newmap] = imapprox(X,map,n)附录MATLAB图像处理命令343[Y,newmap] = imapprox(X,map,tol)Y = imapprox(X,map,newmap)[...] = imapprox(...,dither_option)相关命令:cmunique, dither, rgb2ind54.imcontour功能:创建图像数据的轮廓图.语法:imcontour(I,n)imcontour(I,v)imcontour(x,y,...)imcontour(...,LineSpec)[C,h] = imcontour(...)举例I = imread('ic.tif');imcontour(I,3)相关命令:clabel, contour, LineSpec55.imcrop功能:剪切图像.语法:I2 = imcrop(I)X2 = imcrop(X,map)RGB2 = imcrop(RGB)I2 = imcrop(I,rect)X2 = imcrop(X,map,rect)RGB2 = imcrop(RGB,rect)[...] = imcrop(x,y,...)[A,rect] = imcrop(...)[x,y,A,rect] = imcrop(...)举例I = imread('ic.tif');I2 = imcrop(I,[60 40 100 90]);imshow(I)figure, imshow(I2)相关命令:zoom56.imfeature功能:计算图像区域的特征尺寸.语法:stats = imfeature(L,measurements) stats = imfeature(L,measurements,n)举例BW = imread('text.tif');L = bwlabel(BW);stats = imfeature(L,'all');stats(23)ans =Area: 89Centroid: [95.6742 192.9775] BoundingBox: [87.5000 184.5000 16 15] MajorAxisLength: 19.9127 MinorAxisLength: 14.2953 Eccentricity: 0.6961Orientation: 9.0845ConvexHull: [28x2 double] ConvexImage: [15x16 uint8 ]ConvexArea: 205Image: [15x16 uint8 ]FilledImage: [15x16 uint8 ] FilledArea: 122EulerNumber: 0Extrema: [ 8x2 double] EquivDiameter: 10.6451Solidity: 0.4341Extent: 0.3708PixelList: [89x2 double]相关命令:bwlabel57.imfinfo功能:返回图形文件信息.语法:info = imfinfo(filename,fmt)info = imfinfo(filename)举例info = imfinfo('canoe.tif')info =Filename:'canoe.tif'FileModDate: '25-Oct-1996 22:10:39' FileSize: 69708Format: 'tif'FormatVersion: []Width: 346Height: 207BitDepth: 8ColorType: 'indexed' FormatSignature: [73 73 42 0] ByteOrder: 'little-endian' NewSubfileType: 0 BitsPerSample: 8Compression: 'PackBits' PhotometricInterpretation: 'RGB Palette' tripOffsets: [ 9x1 double] SamplesPerPixel: 1 RowsPerStrip: 23 StripByteCounts: [ 9x1 double] XResolution: 72YResolution: 72ResolutionUnit: 'Inch'Colormap: [256x3 double] PlanarConfiguration: 'Chunky'TileLength: []TileOffsets: [] TileByteCounts: [] Orientation: 1FillOrder: 1 GrayResponseUnit: 0.0100 MaxSamplue: 255 MinSamplue: 0Thresholding: 1相关命令:imread, imwrite58.imhist功能:显示图像数据的柱状图.语法:imhist(I,n)imhist(X,map)[counts,x] = imhist(...)举例I = imread('pout.tif');imhist(I)相关命令:histeq59.immovie功能:创建多帧索引图的电影动画. 语法:mov = immovie(X,map)举例load mrimov = immovie(D,map);相关命令:montage60.imnoise功能:增加图像的渲染效果.语法:J = imnoise(I,type)J = imnoise(I,type,parameters)举例I = imread('eight.tif');J = imnoise(I,'salt & pepper',0.02); imshow(I)figure, imshow(J)rand61.impixel功能:确定像素颜色值.语法:P = impixel(I)P = impixel(X,map)P = impixel(RGB)P = impixel(Incur)P = impixel(X,map,c,r)P = impixel(RGB,c,r)[carp] = impixel(...)P = impixel(x,y,I,xi,yi)P = impixel(x,y,X,map,xi,yi)P = impixel(x,y,RGB,xi,yi)[xi,yi,P] = impixel(x,y,...)举例RGB = imread('flowers.tif');c = [12 146 410];r = [104 156 129];pixels = impixel(RGB,c,r)pixels =61 59 101253 240 0237 37 44相关命令:improfile, pixval62.improfile功能:沿线段计算剖面图的像素值.语法:c = improfilec = improfile(n)c = improfile(I,xi,yi)c = improfile(I,xi,yi,n)[cx,cy,c] = improfile(...)[cx,cy,c,xi,yi] = improfile(...) [...] = improfile(x,y,I,xi,yi) [...] = improfile(x,y,I,xi,yi,n) [...] = improfile(...,method)举例I = imread('alumgrns.tif');x = [35 338 346 103];y = [253 250 17 148];improfile(I,x,y), grid on相关命令:impixel, pixval63.imread功能:从图形文件中读取图像.语法:A = imread(filename,fmt)[X,map] = imread(filename,fmt)[...] = imread(filename)[...] = imread(...,idx) (TIFF only)[...] = imread(...,ref) (HDF only)[...] = imread(...,'BackgroundColor',BG) (PNG only) [A,map,alpha] = imread(...) (PNG only)举例[X,map] = imread('flowers.tif',6);info = imfinfo('skull.hdf');[X,map] = imread('skull.hdf',info(4).Reference);bg = [255 0 0];A = imread('image.png','BackgroundColor',bg); [A,map,alpha] = imread('image.png');相关命令:imfinfo, imwrite,fread,double,uint8,uint1664.imresize功能:改变图像大小.语法:B = imresize(A,m,method)B = imresize(A,[mrows ncols],method)B = imresize(...,method,n)B = imresize(...,method,h)65.imrotate功能:旋转图像.语法:B = imrotate(A,angle,method)B = imrotate(A,angle,method,'crop')举例I = imread('ic.tif');J = imrotate(I,-4,'bilinear','crop');imshow(I)figure, imshow(J)相关命令:imcrop, imresize66.imshow功能:显示图像.语法:附录MATLAB图像处理命令351imshow(I,n)imshow(I,[low high])imshow(BW)imshow(X,map)imshow(RGB)imshow(...,display_option)imshow(x,y,A,...)imshow filenameh = imshow(...)相关命令:getimage, imread, iptgetpref, iptsetpref, subimage, truesize, warp 67.imwrite功能:把图像写入图形文件中.语法:imwrite(A,filename,fmt)imwrite(X,map,filename,fmt)imwrite(...,filename)imwrite(...,Param1,Val1,Param2,Val2...)举例imwrite(X,map,'flowers.hdf','Compression','none',...'WriteMode','append')相关命令:imfinfo, imread68.ind2gray功能:把检索图像转化为灰度图像.语法:I = ind2gray(X,map)举例load treesI = ind2gray(X,map);imshow(X,map)figure,imshow(I)相关命令:gray2ind, imshow, rgb2ntsc69.ind2rgb功能:转化索引图像为RGB真彩图像.语法:RGB = ind2rgb(X,map)相关命令:ind2gray, rgb2ind70.iptgetpref功能:获取图像处理工具箱参数设置. 语法:value = iptgetpref(prefname)举例value = iptgetpref('ImshowAxesVisible') value =off相关命令:imshow, iptsetpref71.iptsetpref功能:设置图像处理工具箱参数.语法:iptsetpref(prefname,value)举例iptsetpref('ImshowBorder','tight')相关命令:imshow, iptgetpref, truesize72.iradon附录MATLAB图像处理命令353功能:进行反Radon变换.语法:I = iradon(P,theta)I = iradon(P,theta,interp,filter,d,n)[I,h] = iradon(...)举例P = phantom(128);R = radon(P,0:179);I = iradon(R,0:179,'nearest','Hann'); imshow(P)figure, imshow(I)相关命令:radon, phantom73.isbw功能:判断是否为二进制图像.语法:flag = isbw(A)相关命令:isind, isgray, isrgb74.isgray功能:判断是否为灰度图像.语法:flag = isgray(A)相关命令:isbw, isind, isrgb75.isind功能:判断是否为索引图像.语法:flag = isind(A)相关命令:isbw, isgray, isrgb76.isrgb功能:判读是否为RGB真彩图像.语法:flag = isrgb(A)相关命令:isbw, isgray, isind77.makelut功能:创建一个用于applylut函数的lookup表. 语法:lut = makelut(fun,n)lut = makelut(fun,n,P1,P2,...)举例f = inline('sum(x(:)) >= 2');lut = makelut(f,2)lut =11111111111相关命令:78.mat2gray功能:转化矩阵为灰度图像.语法:I = mat2gray(A,[amin amax])I = mat2gray(A)举例I = imread('rice.tif');J = filter2(fspecial('sobel'),I);K = mat2gray(J);imshow(I)figure, imshow(K)相关命令:gray2ind79.mean2功能:计算矩阵元素的平均值.语法:b = mean2(A)相关命令:std2, mean, std80.medfilt2功能:进行二维中值过滤.语法:B = medfilt2(A,[m n])B = medfilt2(A)B = medfilt2(A,'indexed',...)举例I = imread('eight.tif');J = imnoise(I,'salt & pepper',0.02);K = medfilt2(J);imshow(J)figure, imshow(K)相关命令:filter2, ordfilt2, wiener281.montage功能:在矩形框中同时显示多幅图像. 语法:montage(I)montage(BW)montage(X,map)montage(RGB)h = montage(...)load mrimontage(D,map)附录MATLAB图像处理命令357相关命令:immovie82.nlfilter功能:进行边沿操作.语法:B = nlfilter(A,[m n],fun)B = nlfilter(A,[m n],fun,P1,P2,...)B = nlfilter(A,'indexed',...)举例B = nlfilter(A,[3 3],'median(x(:))');相关命令:blkproc, colfilt83.ntsc2rgb功能: 转换NTSC的值为RGB颜色空间.语法:rgbmap = ntsc2rgb(yiqmap)RGB = ntsc2rgb(YIQ)相关命令:rgb2ntsc, rgb2ind, ind2rgb, ind2gray84.ordfilt2功能:进行二维统计顺序过滤.语法:B = ordfilt2(A,order,domain)B = ordfilt2(A,order,domain,S)B = ordfilt2(...,padopt)相关命令:medfilt285.phantom功能:产生一个头部幻影图像.语法:P = phantom(def,n)P = phantom(E,n)[P,E] = phantom(...)举例P = phantom('Modified Shepp-Logan',200); imshow(P)相关命令:radon, iradon86.pixval功能:显示图像像素信息.语法:pixval onpixval offpixvalpixval(fig,option)相关命令:impixel, improfile87.qtdecomp功能:进行四叉树分解.语法:S = qtdecomp(I)S = qtdecomp(I,threshold)S = qtdecomp(I,threshold,mindim)S = qtdecomp(I,threshold,[mindim maxdim]) S = qtdecomp(I,fun)S = qtdecomp(I,fun,P1,P2,...)举例I = [1 1 1 1 2 3 6 61 12 1 4 5 6 81 1 1 1 10 15 7 71 1 1 1 20 25 7 720 22 20 22 1 2 3 420 22 22 20 5 6 7 820 22 20 20 9 10 11 1222 22 20 20 13 14 15 16];S = qtdecomp(I,5);full(S)ans =4 0 0 0 2 0 2 00 0 0 0 0 0 0 00 0 0 0 1 1 2 00 0 0 0 1 1 0 04 0 0 0 2 0 2 00 0 0 0 0 0 0 00 0 0 0 2 0 2 00 0 0 0 0 0 0 0相关命令:qtgetblk, qtsetblk88.qtgetblk功能:获取四叉树分解中的块值.语法:[vals,r,c] = qtgetblk(I,S,dim)[vals,idx] = qtgetblk(I,S,dim)举例[vals,r,c] = qtgetblk(I,S,4)vals(:,:,1) =1 1 1 11 12 11 1 1 11 1 1 1vals(:,:,2) =20 22 20 2220 22 22 2020 22 20 2022 22 20 20r =15c =11相关命令:qtdecomp, qtsetblk89.qtsetblk功能:设置四叉树分解中的块值. 语法:J = qtsetblk(I,S,dim,vals)举例newvals = cat(3,zeros(4),ones(4)); J = qtsetblk(I,S,4,newvals)J =0 0 0 0 2 3 6 60 0 0 0 4 5 6 80 0 0 0 10 15 7 70 0 0 0 20 25 7 71 1 1 1 123 41 1 1 1 5 6 7 81 1 1 1 9 10 11 121 1 1 1 13 14 15 16相关命令:qtdecomp, qtgetblk90.radon功能: 计算Radon变换.语法:R = radon(I,theta)R = radon(I,theta,n)[R,xp] = radon(...)举例iptsetpref('ImshowAxesVisible','on')I = zeros(100,100);I(25:75,25:75) = 1;theta = 0:180;[R,xp] = radon(I,theta);imshow(theta,xp,R,[]), colormap(hot), colorbar相关命令:iradon, phantom91.rgb2gray功能: 转换RGB图像或颜色映像表为灰度图像. 语法:I = rgb2gray(RGB)newmap = rgb2gray(map)相关命令:ind2gray, ntsc2rgb, rgb2ind, rgb2ntsc92.rgb2hsv功能: 转化RGB值为HSV颜色空间.语法:hsvmap = rgb2hsv(rgbmap)HSV = rgb2hsv(RGB)相关命令:hsv2rgb, rgbplot93.rgb2ind功能: 转化RGB图像为索引图像.语法:[X,map] = rgb2ind(RGB,tol)[X,map] = rgb2ind(RGB,n)X = rgb2ind(RGB,map)[...] = rgb2ind(...,dither_option)举例RGB = imread('flowers.tif');[X,map] = rgb2ind(RGB,128);imshow(X,map)相关命令:cmunique, dither, imapprox, ind2rgb, rgb2gray 94.rgb2ntsc功能: 转化RGB的值为NTSC颜色空间.语法:yiqmap = rgb2ntsc(rgbmap)YIQ = rgb2ntsc(RGB)相关命令:ntsc2rgb, rgb2ind, ind2rgb, ind2gray95.rgb2ycbcr功能: 转化RGB的值为YcbCr颜色空间. 语法:ycbcrmap = rgb2ycbcr(rgbmap)YCBCR = rgb2ycbcr(RGB)相关命令:ntsc2rgb, rgb2ntsc, ycbcr2rgb96.rgbplot功能:划分颜色映像表.语法:rgbplot(map)举例rgbplot(jet)相关命令:colormap97.roicolor功能:选择感兴趣的颜色区.语法:BW = roicolor(A,low,high)BW = roicolor(A,v)举例I = imread('rice.tif');BW = roicolor(I,128,255);imshow(I);figure, imshow(BW)相关命令:roifilt2, roipoly98.roifill功能:在图像的任意区域中进行平滑插补. 语法:J = roifill(Incur)J = roifill(I)J = roifill(I,BW)[J,BW] = roifill(...)J = roifill(x,y,I,xi,yi)[x,y,J,BW,xi,yi] = roifill(...)举例I = imread('eight.tif');c = [222 272 300 270 221 194];r = [21 21 75 121 121 75];J = roifill(Incur);imshow(I)figure, imshow(J)相关命令:roifilt2, roipoly99.roifilt2功能:过滤敏感区域.语法:J = roifilt2(h,I,BW)J = roifilt2(I,BW,fun)J = roifilt2(I,BW,fun,P1,P2,...)举例h = fspecial('unsharp');J = roifilt2(h,I,BW);imshow(J)相关命令:filter2, roipoly100.roipoly功能:选择一个敏感的多边形区域. 语法:BW = roipoly(Incur)BW = roipoly(I)BW = roipoly(x,y,I,xi,yi)[BW,xi,yi] = roipoly(...)[x,y,BW,xi,yi] = roipoly(...)举例I = imread('eight.tif');c = [222 272 300 270 221 194];r = [21 21 75 121 121 75];BW = roipoly(Incur);imshow(I)figure, imshow(BW)相关命令:roifilt2, roicolor, roifill101.std2功能:计算矩阵元素的标准偏移. 语法:b = std2(A)相关命令:corr2, mean2102.subimage功能:在一幅图中显示多个图像. 语法:subimage(X,map)subimage(I)subimage(BW)subimage(RGB)subimage(x,y,...)h = subimage(...)举例load trees[X2,map2] = imread('forest.tif');subplot(1,2,1), subimage(X,map)subplot(1,2,2), subimage(X2,map2)相关命令:附录MATLAB图像处理命令367103.truesize功能:调整图像显示尺寸.语法:truesize(fig,[mrows mcols])truesize(fig)相关命令:imshow, iptsetpref, iptgetpref104.uint8功能:转换数据为8位无符号整型.语法:B = uint8(A)举例a = [1 3 5];b = uint8(a);whosName Size Bytes Classa 1x3 24 doublearrayb 1x3 3 uint8 array相关命令:double, im2double, im2uint8105.uint16功能:转换数据为16位无符号整型.语法:I = uint16(X)举例a = [1 3 5];b = uint16(a);whosName Size Bytes Classa 1x3 24 double arrayb 1x3 6 uint16 array相关命令:double, datatypes, uint8, uint32, int8, int16, int32. 106.warp功能:将图像显示到纹理映射表面.语法:warp(X,map)warp(I,n)warp(BW)warp(RGB)warp(z,...)warp(x,y,z,...)h = warp(...)举例[x,y,z] = cylinder;I = imread('testpat1.tif');warp(x,y,z,I);相关命令:imshow107.wiener2功能:进行二维适应性去噪过滤处理.语法:J = wiener2(I,[m n],noise)[J,noise] = wiener2(I,[m n])举例I = imread('saturn.tif');J = imnoise(I,'gaussian',0,0.005);K = wiener2(J,[5 5]);imshow(J)figure, imshow(K)相关命令:filter2, medfilt2108.ycbcr2rgb功能: 转化YcbCr值为RGB颜色空间. 语法:rgbmap = ycbcr2rgb(ycbcrmap)RGB = ycbcr2rgb(YCBCR)相关命令:ntsc2rgb, rgb2ntsc, rgb2ycbcr109.zoom功能:缩放图像.语法:zoom onzoom offzoom outzoom resetzoomzoom xonzoom yon。
matlab函数大全
matlab函数大全Matlab函数大全。
Matlab是一种强大的数学软件,它提供了丰富的函数库,可以帮助用户进行各种数学计算、数据分析和可视化操作。
在Matlab中,函数是一种用来完成特定任务的代码块,它可以接受输入参数并返回输出结果。
本文将介绍一些常用的Matlab函数,希望能够帮助读者更好地理解和使用Matlab。
1. plot函数。
plot函数是Matlab中最常用的函数之一,它用于绘制二维图形。
通过plot函数,用户可以将数据点连接起来,形成折线图或者曲线图。
plot函数的基本语法是,plot(x, y),其中x和y分别表示横轴和纵轴的数据点。
用户可以通过设置不同的参数,如颜色、线型、线宽等,来定制绘制的图形。
2. linspace函数。
linspace函数用于生成指定范围内的等间距数据点。
其基本语法是,linspace(start, end, n),其中start和end分别表示起始值和终止值,n表示生成的数据点个数。
linspace函数常用于生成绘图的横轴数据点,也可以用于生成一维数组。
3. meshgrid函数。
meshgrid函数用于生成二维网格数据点。
其基本语法是,[X, Y] = meshgrid(x, y),其中x和y分别表示横轴和纵轴的数据点,X和Y分别表示生成的二维网格数据点。
meshgrid函数常用于三维曲面的绘制,也可以用于生成二维数组。
4. fft函数。
fft函数用于进行快速傅里叶变换,它可以将时域信号转换为频域信号。
其基本语法是,Y = fft(X),其中X表示输入的时域信号,Y表示输出的频域信号。
fft函数常用于信号处理和频谱分析。
5. polyfit函数。
polyfit函数用于进行多项式拟合,它可以根据给定的数据点拟合出一个多项式模型。
其基本语法是,p = polyfit(x, y, n),其中x和y表示数据点,n表示拟合的多项式阶数,p表示拟合出的多项式系数。
matlab数字图像处理函数大全
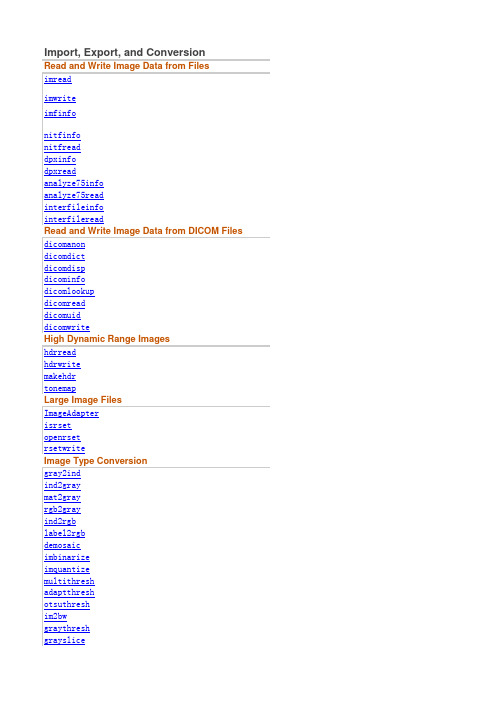
Import, Export, and ConversionDisplay and ExplorationGeometric Transformation, Spatial ReferencingImage EnhancementImage AnalysisRead image from graphics fileWrite image to graphics fileInformation about graphics fileRead metadata from National Imagery Transmission Format (NITF) file Read image from NITF fileRead metadata from DPX fileRead DPX imageRead metadata from header file of Analyze 7.5 data setRead image data from image file of Analyze 7.5 data setRead metadata from Interfile fileRead images in Interfile formatAnonymize DICOM fileGet or set active DICOM data dictionaryDisplay DICOM file structureRead metadata from DICOM messageFind attribute in DICOM data dictionaryRead DICOM imageGenerate DICOM unique identifierWrite images as DICOM filesRead high dynamic range (HDR) imageWrite Radiance high dynamic range (HDR) image fileCreate high dynamic range imageRender high dynamic range image for viewingInterface for image I/OCheck if file is R-SetOpen R-Set fileCreate reduced resolution data set from image fileConvert grayscale or binary image to indexed imageConvert indexed image to grayscale imageConvert matrix to grayscale imageConvert RGB image or colormap to grayscaleConvert indexed image to RGB imageConvert label matrix into RGB imageConvert Bayer pattern encoded image to truecolor imageBinarize image by thresholdingQuantize image using specified quantization levels and output values Multilevel image thresholds using Otsu's methodAdaptive image threshold using local first-order statisticsGlobal histogram threshold using Otsu's methodConvert image to binary image, based on thresholdGlobal image threshold using Otsu's methodConvert grayscale image to indexed image using multilevel thresholdingConvert image to double precisionConvert image to 16-bit signed integersConvert image to Java buffered imageConvert image to single precisionConvert image to 16-bit unsigned integersConvert image to 8-bit unsigned integersCreate checkerboard imageCreate head phantom imageAdd noise to imageDisplay imageDisplay multiple image frames as rectangular montage Display multiple images in single figureMake movie from multiframe imagePlay movies, videos, or image sequencesDisplay image as texture-mapped surfaceGet values of Image Processing Toolbox preferencesDisplay Image Processing Toolbox Preferences dialog boxSet Image Processing Toolbox preferences or display valid values Image Viewer appImage Information toolAdjust Contrast toolDisplay Range toolDistance toolPixel Information toolPixel Information tool without text labelPixel Region toolMagnification box for scroll panelOverview tool for image displayed in scroll panelGet values of Image Processing Toolbox preferencesDisplay Image Processing Toolbox Preferences dialog boxSet Image Processing Toolbox preferences or display valid values Image Information toolChoose Colormap toolAdjust Contrast toolCrop imageDisplay Range toolDistance toolPixel Information toolPixel Information tool without text labelPixel Region toolPixel Region tool panelMagnification box for scroll panelOverview tool for image displayed in scroll panelOverview tool panel for image displayed in scroll panelSave Image ToolScroll panel for interactive image navigationCreate draggable ellipseCreate draggable freehand regionCreate draggable, resizable lineCreate draggable pointCreate draggable, resizable polygonCreate draggable rectangleRegion-of-interest (ROI) base classSelect polyline with mouseSpecify points with mouseSpecify rectangle with mouseImage data from axesImage model object from image objectImage Model objectConvert axes coordinates to pixel coordinatesInformation about image attributesGet handle to current axes containing imageGet handle to current figure containing imageOpen Image dialog boxGet all image handlesAdd function handle to callback listCheck validity of handleGet Application Programmer Interface (API) for handleRetrieve pointer behavior from HG objectDirectories containing IPT and MATLAB iconsCreate pointer manager in figureDelete function handle from callback listStore pointer behavior structure in Handle Graphics object Align figure windowsCreate rectangularly bounded drag constraint functionAdjust display size of imagencing, and Image RegistrationCrop imageResize imageRotate imageTranslate imageImage pyramid reduction and expansionApply geometric transformation to imageFit geometric transformation to control point pairsApply 2-D spatial transformation to imageFind output bounds for spatial transformationFlip input and output roles of TFORM structureCreate resampling structureCreate spatial transformation structure (TFORM)Apply spatial transformation to N-D arrayApply forward spatial transformationApply inverse spatial transformationCreate checkerboard image2-D Affine Geometric Transformation3-D Affine Geometric Transformation2-D Projective Geometric Transformation2-D piecewise linear geometric transformation2-D Polynomial Geometric Transformation2-D Local Weighted Mean Geometric TransformationApply geometric transformation to imageIntensity-based image registrationEstimate geometric transformation that aligns two 2-D or 3-D images Display imageCompare differences between imagesComposite of two imagesReference 2-D image to world coordinatesReference 3-D image to world coordinatesIntensity-based image registrationConfigurations for intensity-based registrationEstimate geometric transformation that aligns two 2-D or 3-D images Estimates geometric transformation that aligns two 2-D images using phase Estimate displacement field that aligns two 2-D or 3-D images Composite of two imagesCompare differences between imagesMattes mutual information metric configuration objectMean square error metric configuration objectRegular step gradient descent optimizer configuration objectOne-plus-one evolutionary optimizer configuration objectControl Point Selection ToolFit geometric transformation to control point pairsTune control-point locations using cross correlationConvert CPSTRUCT to valid pairs of control pointsNormalized 2-D cross-correlationInfer spatial transformation from control point pairsAdjust image intensity values or colormapAdjust Contrast toolSharpen image using unsharp maskingEnhance contrast using histogram equalizationContrast-limited adaptive histogram equalization (CLAHE)Adjust histogram of image to match N-bin histogram of reference image Apply decorrelation stretch to multichannel imageFind limits to contrast stretch imageConvert integer values using lookup tableAdd noise to imageN-D filtering of multidimensional images2-D Gaussian filtering of images3-D Gaussian filtering of 3-D imagesCreate predefined 2-D filterGuided filtering of imagesNormalized 2-D cross-correlation2-D adaptive noise-removal filtering2-D median filtering2-D order-statistic filteringLocal standard deviation of imageLocal range of imageLocal entropy of grayscale imageGeneral sliding-neighborhood operationsCreate Gabor filter or Gabor filter bankApply Gabor filter or set of filters to 2-D image2-D box filtering of images3-D box filtering of 3-D imagesCalculate integral imageCalculate 3-D integral image2-D box filtering of integral images3-D box filtering of 3-D integral imagesExtract objects from binary image by sizeExtract objects from binary image using properties Pad array2-D frequency response2-D FIR filter using frequency sampling2-D FIR filter using frequency transformation2-D FIR filter using 1-D window method2-D FIR filter using 2-D window method2-D convolution matrixBinary hit-miss operationMorphological operations on binary images Ultimate erosionRemove small objects from binary imageBottom-hat filteringSuppress light structures connected to image border Morphologically close imageDilate imageErode imageExtended-maxima transformExtended-minima transformFill image regions and holesH-maxima transformH-minima transformImpose minimaMorphologically open imageMorphological reconstructionRegional maximaRegional minimaTop-hat filteringWatershed transformCreate connectivity arrayCheck validity of connectivity argumentNeighborhood operations on binary images using lookup tables Nonlinear filtering using lookup tablesCreate lookup table for use with bwlookupMorphological structuring elementMorphological offset structuring elementDeblur image using blind deconvolutionDeblur image using Lucy-Richardson methodDeblur image using regularized filterDeblur image using Wiener filterTaper discontinuities along image edgesConvert optical transfer function to point-spread function Convert point-spread function to optical transfer functionPad arraySpecify polygonal region of interest (ROI)Convert region of interest (ROI) polygon to region maskFill in specified regions in image using inward interpolation Select region of interest (ROI) based on colorFilter region of interest (ROI) in imageCreate draggable ellipseCreate draggable freehand regionCreate draggable, resizable polygonCreate draggable rectangleRegion-of-interest (ROI) base classInterface for image I/ODistinct block processing for imageDetermine optimal block size for block processingGeneral sliding-neighborhood operationsRearrange matrix columns into blocksColumnwise neighborhood operationsRearrange image blocks into columnsAbsolute difference of two imagesAdd two images or add constant to imageLinear combination of color channelsComplement imageDivide one image into another or divide image by constant Linear combination of imagesMultiply two images or multiply image by constantSubtract one image from another or subtract constant from image Trace region boundaries in binary imageTrace object in binary imagePlot region boundariesFind edges in intensity imageFind circles using circular Hough transformCreate circleGradient magnitude and direction of an imageDirectional gradients of an imageFind 3-D gradient magnitude and direction of imagesFind the directional gradients of a 3-D imageHough transformExtract line segments based on Hough transformIdentify peaks in Hough transformQuadtree decompositionBlock values in quadtree decompositionSet block values in quadtree decompositionMeasure properties of image regionsArea of objects in binary imageExtract objects from binary image by sizeFind connected components in binary imageGenerate convex hull image from binary imageDistance transform of binary imageGeodesic distance transform of binary imageEuler number of binary imageFind perimeter of objects in binary imageExtract objects from binary image using propertiesSelect objects in binary imageGray-weighted distance transform of grayscale imageCreate contour plot of image dataHistogram of image dataPixel color valuesPixel-value cross-sections along line segments2-D correlation coefficientAverage or mean of matrix elementsStandard deviation of matrix elementsLabel connected components in 2-D binary imageLabel connected components in binary imageCreate label matrix from bwconncomp structurePack binary imageUnpack binary imageEntropy of grayscale imageLocal entropy of grayscale imageLocal range of imageLocal standard deviation of imageCreate gray-level co-occurrence matrix from imageProperties of gray-level co-occurrence matrixMean-squared errorPeak Signal-to-Noise Ratio (PSNR)Structural Similarity Index (SSIM) for measuring image qualitySegment image into foreground and background using active contour Binary image segmentation using Fast Marching MethodSegment image into two or three regions using geodesic distance-based colorCalculate weights for image pixels based on image gradient Calculate weights for image pixels based on grayscale intensity difference Select contiguous image region with similar gray valuesGlobal image threshold using Otsu's methodMultilevel image thresholds using Otsu's methodGlobal histogram threshold using Otsu's methodAdaptive image threshold using local first-order statisticsFind region boundaries of segmentation2-D superpixel oversegmentation of imagesBurn binary mask into 2-D imageConvert label matrix to cell array of linear indicesDistance transform of binary imageGeodesic distance transform of binary imageGray-weighted distance transform of grayscale imageHough transform2-D discrete cosine transformDiscrete cosine transform matrixConvert fan-beam projections to parallel-beamFan-beam transform2-D inverse discrete cosine transformInverse fan-beam transformInverse Radon transformConvert parallel-beam projections to fan-beamRadon transform2-D fast Fourier transformShift zero-frequency component to center of spectrum2-D inverse fast Fourier transformInverse FFT shiftConvert RGB to CIE 1976 L*a*b*Convert RGB color values to NTSC color spaceConvert RGB to CIE 1931 XYZConvert RGB color values to YCbCr color spaceConvert CIE 1976 L*a*b* to RGBConvert CIE 1976 L*a*b* to CIE 1931 XYZConvert CIE 1931 XYZ to CIE 1976 L*a*b*Convert CIE 1931 XYZ to RGBConvert YCbCr color values to RGB color spaceConvert NTSC values to RGB color spaceConvert L*a*b* data to doubleConvert L*a*b* data to uint16Convert L*a*b* data to uint8Convert XYZ color values to doubleConvert XYZ color values to uint16Search for ICC profilesRead ICC profileFind system default ICC profile repositoryWrite ICC color profile to disk fileTrue for valid ICC color profileCreate color transformation structureApply device-independent color space transformation Approximate indexed image by reducing number of colors XYZ color values of standard illuminantsAdaptive image threshold using local first-order statistics Find region boundaries of segmentationRemove small objects from binary imageTrace region boundaries in binary imageFind connected components in binary imageDistance transform of binary imageEuler number of binary imageLabel connected components in 2-D binary image Nonlinear filtering using lookup tables Morphological operations on binary imagesPack binary imageFind perimeter of objects in binary imageSelect objects in binary imageTrace object in binary imageUnpack binary imageCreate connectivity arrayConvert Bayer pattern encoded image to truecolor image Find edges in intensity imageFit geometric transformation to control point pairs Create predefined 2-D filterDefault display range of image based on its classSelect contiguous image region with similar gray values Enhance contrast using histogram equalizationHough transformExtract line segments based on Hough transform Identify peaks in Hough transformConvert HSV colormap to RGB colormapConvert image to double precisionConvert image to 16-bit signed integersConvert image to single precisionConvert image to 16-bit unsigned integersConvert image to 8-bit unsigned integersAbsolute difference of two imagesAdjust image intensity values or colormapBinarize image by thresholdingBottom-hat filtering2-D box filtering of imagesSuppress light structures connected to image border Morphologically close imageComplement imageCrop imageDilate imageErode imageExtended-maxima transformExtended-minima transformFill image regions and holesN-D filtering of multidimensional imagesFind circles using circular Hough transformApply Gabor filter or set of filters to 2-D image2-D Gaussian filtering of imagesFind 3-D gradient magnitude and direction of imagesFind the directional gradients of a 3-D imageHistogram of image dataH-maxima transformH-minima transformLinear combination of imagesMean-squared errorMorphologically open imageBurn binary mask into 2-D imageImage pyramid reduction and expansionQuantize image using specified quantization levels and output values Read image from graphics fileMorphological reconstructionRegional maximaRegional minimaResize imageRotate imageTop-hat filteringTranslate imageApply geometric transformation to image2-D box filtering of integral imagesCalculate integral imageConvert integer values using lookup tableCheck validity of colormapCheck validity of connectivity argumentConvert CIE 1976 L*a*b* to RGBConvert label matrix into RGB imageConvert label matrix to cell array of linear indicesAverage or mean of matrix elements2-D median filteringMultilevel image thresholds using Otsu's method2-D order-statistic filteringGlobal histogram threshold using Otsu's methodPad arrayPeak Signal-to-Noise Ratio (PSNR)Measure properties of image regionsConvert RGB image or colormap to grayscaleConvert RGB colormap to HSV colormapConvert RGB to CIE 1976 L*a*b*Convert RGB color values to YCbCr color spaceFind limits to contrast stretch image2-D superpixel oversegmentation of imagesWatershed transformConvert YCbCr color values to RGB color spaceReference 2-D image to world coordinatesReference 3-D image to world coordinates2-D Affine Geometric Transformation2-D Projective Geometric TransformationMorphological structuring elementMorphological offset structuring elementDistance transform of binary imageLabel connected components in 2-D binary image Nonlinear filtering using lookup tablesMorphological operations on binary images2-D correlation coefficientFind edges in intensity imageEnhance contrast using histogram equalizationConvert image to double precisionConvert image to single precisionConvert image to 8-bit unsigned integersConvert image to 16-bit unsigned integersAbsolute difference of two imagesAdjust image intensity values or colormapBottom-hat filteringMorphologically close imageComplement imageDilate imageErode imageFill image regions and holesN-D filtering of multidimensional imagesGradient magnitude and direction of an image Directional gradients of an imageHistogram of image dataLinear combination of imagesAdd noise to imageConvert YCbCr color values to RGB color space Morphologically open imageMorphological reconstructionEstimate displacement field that aligns two 2-D or 3-D images Resize imageRotate imageDisplay imageTop-hat filteringInverse Radon transformConvert matrix to grayscale imageAverage or mean of matrix elements2-D median filteringNormalized 2-D cross-correlationPad arrayRadon transformMeasure properties of image regionsConvert RGB image or colormap to grayscaleConvert RGB color values to YCbCr color spaceStandard deviation of matrix elementsLocal standard deviation of imageFind limits to contrast stretch image从图形文件读取图像写入图像到图形文件关于图形文件的信息从国家图像传输格式的元数据(NITF)文件从NITF文件读取图像读取DPX文件元数据读取DPX图像从分析7.5数据集的头文件读取元数据从分析7.5数据集的图像文件中读取图像数据从归档文件元数据在内部文件格式读取图像匿名DICOM文件获取或设置活动DICOM数据字典显示DICOM文件结构读取DICOM消息元数据发现在DICOM数据字典属性读取DICOM图像生成DICOM的唯一标识符写图像的DICOM文件读高动态范围(HDR)图像写下光辉的高动态范围(HDR)图像文件创建高动态范围图像用于观看的高动态范围图像图像I / O接口检查文件是否存在与r-组开放与r-组文件从图像文件创建减少的分辨率数据集将灰度或二值图像转换为索引图像将索引图像转换为灰度图像转换矩阵到灰度图像将RGB图像的灰度或颜色表索引图像的RGB图像转换转换成RGB图像标签矩阵Bayer编码图像转换为彩色图像二值化图像的阈值分割量化图像使用指定的量化电平和输出值采用多级图像阈值Otsu方法采用局部一阶统计的自适应图像阈值使用全局直方图阈值Otsu方法基于阈值的图像转换成二值图像使用全局阈值Otsu方法采用多层阈值化方法将灰度图像转换为索引图像将图像转换为双精度将图像转换为16位有符号整数将图像转换成java缓冲图像将图像转换为单精度将图像转换为16位无符号整数将图像转换为8位无符号整数创建棋盘格图像创建头部影像添加噪声到图像显示图像显示多个图像帧矩形蒙太奇在单个图形中显示多个图像从多帧图像的电影播放电影、视频或图像序列显示图像作为纹理映射的表面获取图像处理工具箱的首选项显示图像处理工具箱首选项对话框设置图像处理工具箱的首选项或显示有效值图像查看器应用程序图像信息的工具对比度调整工具显示范围的工具距离工具像素信息的工具无文本标签的像素信息工具像素区域的工具用于滚动面板的放大盒在滚动面板中显示的图像的概述工具获取图像处理工具箱的首选项显示图像处理工具箱首选项对话框设置图像处理工具箱的首选项或显示有效值图像信息的工具选择映射工具对比度调整工具作物图像显示范围的工具距离工具像素信息的工具无文本标签的像素信息工具像素区域的工具像素区域工具面板用于滚动面板的放大盒在滚动面板中显示的图像的概述工具滚动面板中显示的图像的工具面板保存图像的工具用于交互式图像导航的滚动面板创建可拖动椭圆创建可拖动自由区域创建可拖动,可调整大小的线创建可拖动点创建可拖动,可调整大小的多边形创建可拖动矩形感兴趣区域(感兴趣区域)基类用鼠标选择多段线用鼠标指定点用鼠标指定矩形从轴的图像数据图像对象的图像模型对象图像模型对象将坐标轴转换为像素坐标关于图像属性的信息获取当前包含图像的轴的句柄获取当前图像包含图像的句柄打开图像对话框获取所有图像处理添加函数句柄到回调列表检查处理的有效性获取处理的应用程序程序员接口(接口)从汞对象检索指针行为目录包含了IPT和Matlab的图标创建图形中的指针管理器从回调列表中删除函数句柄句柄图形对象中的存储指针行为结构排列图的窗口创建矩形拖动约束函数有界调整图像的显示大小作物图像调整图像大小旋转图像转换图像图像金字塔的还原与扩展将几何变换应用于图像拟合控制点对的几何变换二维空间变换在图像中的应用查找空间变换的输出范围输入和输出翻转平台结构的作用创建重采样结构创造空间转换结构(平台)将空间变换N-D数组应用前向空间变换应用逆空间变换创建棋盘格图像二维仿射几何变换三维仿射几何变换二维射影几何变换二维分段线性几何变换二维多项式几何变换二维局部加权平均几何变换将几何变换应用于图像基于强度的图像配准估计对齐两个二维或三维图像的几何变换显示图像比较图像之间的差异两幅图像的复合参考二维图像到世界坐标参考三维图像到世界坐标基于强度的图像配准基于强度的注册的配置估计对齐两个二维或三维图像的几何变换使用相位相关的两个二维图像的几何变换估计估计对齐两个二维或三维图像的位移场两幅图像的复合比较图像之间的差异Mattes互信息度量的配置对象均方误差度量配置对象正规步长梯度下降优化配置对象一加一进化优化配置对象控制点选择工具拟合控制点对的几何变换使用交叉相关的调整控制点位置cpstruct转换控制点的有效对标准化二维互相关从控制点对的空间变换调整图像的灰度值或颜色表对比度调整工具利用反锐化掩模图像锐化采用直方图均衡化增强对比度对比度自适应直方图均衡化(CLAHE)调整直方图的图像与参考图像n-bin直方图申请去相关拉伸的多通道图像查找对比度拉伸图像的限制使用查找表转换整数值添加噪声到图像N维的多维图像滤波二维图像的二维高斯滤波三维图像的三维高斯滤波创建预定义的二维滤波器图像引导滤波标准化二维互相关二维自适应噪声滤除二维中值滤波二维阶统计滤波图像局部标准偏差局部图像范围灰度图像局部熵一般滑动邻域运算Gabor滤波器和Gabor滤波器组的创建应用Gabor滤波器或滤波器组二维图像二维图像的二维图像滤波三维图像的三维盒滤波计算积分图像计算三维积分图像积分图像的二维箱滤波三维整体图像的三维箱滤波通过大小从二值图像中提取对象使用属性从二值图像中提取对象焊盘阵列二维频率响应采用频率采样的二维滤波器采用频率变换的二维滤波器二维FIR滤波器采用一维窗口的方法采用二维窗法的二维二维滤波器二维卷积矩阵二进制命中错误操作二值图像的形态学运算终极侵蚀从二值图像中删除小对象帽子底部过滤抑制连接到图像边缘的光结构形态接近的图像放大图像腐蚀图像扩展极大值变换扩展最小变换填充图像区域和孔h-maxima变换利用H-minima变换强制最小形态上打开的图像形态重构区域极值局部极小顶帽滤波分水岭变换创建连接的阵列检查连通性参数的有效性使用查找表的二值图像的邻域运算使用查找表的非线性滤波创建bwlookup使用查找表形态学结构元素形态学偏移结构元素利用盲反卷积去模糊图像用露西理查德森的方法去模糊图像利用正则化滤波复原图像使用维纳滤波复原图像沿图像边缘的锥度不连续性将光学传递函数转换为点扩散函数转换点扩展函数到光传输函数焊盘阵列指定感兴趣区域(投资回报率)将感兴趣区域(感兴趣区域)的多边形转换为区域掩模用内插法填充图像中的指定区域基于颜色的选择感兴趣区域(感兴趣区域)图像中的感兴趣区域(感兴趣区域)创建可拖动椭圆创建可拖动自由区域创建可拖动,可调整大小的多边形创建可拖动矩形感兴趣区域(感兴趣区域)基类图像I / O接口图像的不同块处理确定块处理的最佳块大小一般滑动邻域运算将矩阵列重新排列成块纵列邻域操作将图像块重新排列成列两幅图像的绝对差添加两个图像或添加常量到图像彩色通道的线性组合补充图像用常数将一幅图像分割成另一幅图像图像的线性组合用常数相乘的两幅图像或多幅图像从另一个或减去一个图像减去一个图像二元图像中的迹区域边界二进制图像中的跟踪对象绘图区域的边界在强度图像中查找边缘发现使用Hough变换圆创建圈子图像的梯度幅值和方向图像的方向梯度查找图像的三维梯度幅值和方向查找三维图像的方向梯度Hough变换基于Hough变换提取直线段确定峰Hough变换四叉树分解在四叉树分解块值在四叉树分解模块设置的值图像区域的测量特性二值图像中的对象区域通过大小从二值图像中提取对象查找二进制图像中的连接组件从二值图像生成凸壳图像二值图像的距离变换二值图像的测地距离变换二值图像的欧拉数在二值图像中查找对象的周长使用属性从二值图像中提取对象在二值图像中选择对象灰度图像的灰度加权距离变换创建图像数据的等高线图图像数据直方图像素的颜色值沿线段的像素值的横截面二维相关系数矩阵元素的平均值或平均值矩阵元素的标准偏差二维二值图像中的标签连接部件二值图像中的标签连接组件从bwconncomp创建标签矩阵结构包的二进制图像打开二进制图像灰度图像熵灰度图像局部熵局部图像范围图像局部标准偏差从图像创建灰度共生矩阵灰度共生矩阵的性质均方误差峰值信噪比(PSNR)结构相似性指数(SSIM)测量图像质量用主动轮廓分割成前景和背景的图像采用快速行进法的二值图像分割用基于测地距离的彩色分割的两个或三个区域的分割图像基于图像梯度的图像像素权重计算基于灰度强度差的图像像素权重计算选择具有相似灰度值的连续图像区域使用全局阈值Otsu方法采用多级图像阈值Otsu方法使用全局直方图阈值Otsu方法采用局部一阶统计的自适应图像阈值查找区域边界的分割二维超像素oversegmentation的图像将二元掩模烧成二维图像将标签矩阵转换为线性指标的单元阵列图像变换二值图像的距离变换二值图像的测地距离变换灰度图像的灰度加权距离变换Hough变换二维离散余弦变换离散余弦变换矩阵将扇形束投影转换成平行光束扇束变换二维逆离散余弦变换逆扇形束变换逆Radon变换将平行光束投影转换成扇形光束Radon变换二维快速傅立叶变换将零频分量移到光谱中心二维逆快速傅立叶变换逆FFT转换颜色转换转换RGB与CIE 1976 L*a*b*将RGB颜色值的NTSC色彩空间转换RGB与CIE 1931 XYZ转换到YCbCr色彩空间RGB颜色值1976将CIE L*a*b*到RGB1976将CIE L*a*b*到CIE 1931 XYZ将CIE 1931 XYZ CIE 1976 L*a*b*CIE 1931 XYZ到RGB的转换YCbCr颜色值转换到RGB颜色空间转换成NTSC值RGB颜色空间将L * A * B *数据转换为双将L*a*b*数据uint16将L*a*b*数据卡片XYZ颜色值转换为双将XYZ颜色值uint16搜索国际商会简介读的ICC配置文件查找系统默认的国际刑事法院配置文件库将颜色配置文件写入磁盘文件真正的有效的国际刑事法院颜色配置文件创建颜色转换结构应用设备独立的颜色空间变换通过减少颜色数的近似索引图像标准照明体XYZ颜色值generation采用局部一阶统计的自适应图像阈值查找区域边界的分割从二值图像中删除小对象二元图像中的迹区域边界查找二进制图像中的连接组件二值图像的距离变换二值图像的欧拉数二维二值图像中的标签连接部件使用查找表的非线性滤波二值图像的形态学运算包的二进制图像在二值图像中查找对象的周长在二值图像中选择对象二进制图像中的跟踪对象打开二进制图像创建连接的阵列Bayer编码图像转换为彩色图像在强度图像中查找边缘拟合控制点对的几何变换创建预定义的二维滤波器基于它的类的图像的默认显示范围选择具有相似灰度值的连续图像区域采用直方图均衡化增强对比度Hough变换基于Hough变换提取直线段确定峰Hough变换转换到RGB的色度HSV颜色图将图像转换为双精度将图像转换为16位有符号整数将图像转换为单精度将图像转换为16位无符号整数将图像转换为8位无符号整数两幅图像的绝对差调整图像的灰度值或颜色表二值化图像的阈值分割帽子底部过滤二维图像的二维图像滤波抑制连接到图像边缘的光结构形态接近的图像补充图像作物图像放大图像腐蚀图像扩展极大值变换扩展最小变换填充图像区域和孔N维的多维图像滤波发现使用Hough变换圆应用Gabor滤波器或滤波器组二维图像二维图像的二维高斯滤波查找图像的三维梯度幅值和方向查找三维图像的方向梯度图像数据直方图h-maxima变换利用H-minima变换图像的线性组合均方误差形态上打开的图像将二元掩模烧成二维图像图像金字塔的还原与扩展量化图像使用指定的量化电平和输出值从图形文件读取图像形态重构区域极值局部极小调整图像大小旋转图像顶帽滤波转换图像将几何变换应用于图像积分图像的二维箱滤波计算积分图像使用查找表转换整数值检查的有效性信息检查连通性参数的有效性1976将CIE L*a*b*到RGB转换成RGB图像标签矩阵将标签矩阵转换为线性指标的单元阵列矩阵元素的平均值或平均值二维中值滤波采用多级图像阈值Otsu方法二维阶统计滤波使用全局直方图阈值Otsu方法焊盘阵列峰值信噪比(PSNR)图像区域的测量特性将RGB图像的灰度或颜色表将RGB颜色表HSV色图转换RGB与CIE 1976 L*a*b*转换到YCbCr色彩空间RGB颜色值查找对比度拉伸图像的限制二维超像素oversegmentation的图像分水岭变换YCbCr颜色值转换到RGB颜色空间参考二维图像到世界坐标参考三维图像到世界坐标二维仿射几何变换二维射影几何变换形态学结构元素形态学偏移结构元素GPU 计算二值图像的距离变换二维二值图像中的标签连接部件使用查找表的非线性滤波二值图像的形态学运算二维相关系数在强度图像中查找边缘采用直方图均衡化增强对比度将图像转换为双精度将图像转换为单精度将图像转换为8位无符号整数将图像转换为16位无符号整数两幅图像的绝对差调整图像的灰度值或颜色表帽子底部过滤形态接近的图像补充图像放大图像腐蚀图像填充图像区域和孔N维的多维图像滤波图像的梯度幅值和方向图像的方向梯度图像数据直方图图像的线性组合添加噪声到图像YCbCr颜色值转换到RGB颜色空间形态上打开的图像形态重构估计对齐两个二维或三维图像的位移场调整图像大小旋转图像显示图像顶帽滤波逆Radon变换转换矩阵到灰度图像矩阵元素的平均值或平均值二维中值滤波标准化二维互相关焊盘阵列Radon变换图像区域的测量特性将RGB图像的灰度或颜色表转换到YCbCr色彩空间RGB颜色值矩阵元素的标准偏差图像局部标准偏差查找对比度拉伸图像的限制。
MATLAB 图像处理命令使用
MATLAB 图像处理命令使用1.MATLAB中图像处理的一些简单函数A、imreadimread函数用于读入各种图像文件,其一般的用法为[X,MAP]=imread(‘filename’,‘fmt’)其中,X,MAP分别为读出的图像数据和颜色表数据,fmt为图像的格式,filename为读取的图像文件(可以加上文件的路径)。
例:[X,MAP]=imread(’flowers.tif’,’tif’);比较读取二值图像,灰度图像,索引图像,彩色图像的X和MAP的特点,可以利用size 函数用来显示数组的维数,了解数据的特点。
B=size(a) 返回数组a 的维数。
B、imwriteimwrite函数用于输出图像,其语法格式为:imwrite(X,map,filename,fmt)imwrite(X,map,filename,fmt)按照fmt指定的格式将图像数据矩阵X和调色板map写入文件filename。
C、imfinfoimfinfo函数用于读取图像文件的有关信息,其语法格式为imfinfo(filename,fmt)imfinfo函数返回一个结构info,它反映了该图像的各方面信息,其主要数据包括:文件名(路径)、文件格式、文件格式版本号、文件的修改时间、文件的大小、文件的长度、文件的宽度、每个像素的位数、图像的类型等。
2.MATLAB中图像文件的显示imshowimshow函数是最常用的显示各种图像的函数,其语法如下:imshow(X,map)其中X是图像数据矩阵,map是其对应的颜色矩阵,若进行图像处理后不知道图像数据的值域可以用[]代替map。
(1)二进制(二值)图像显示方法,在MATLAB中一幅二值图像是uint8或双精度的,该矩阵仅包含0和1。
如果希望工具箱中的函数能将图像理解为二进制的,那么所有数据都要是逻辑数据,必须对其进行设置(将所有数据标志均设置on).可以对数据利用“~”取反操作实现图像逆转即黑白反色。
Matlab中图像处理常用函数的用法
Matlab中常见函数的用法1 size()函数1)s=size(A),当只有一个输出参数时,返回一个行向量,该行向量的第一个元素时矩阵的行数,第二个元素是矩阵的列数。
2)[r,c]=size(A),当有两个输出参数时,size函数将矩阵的行数返回到第一个输出变量r,将矩阵的列数返回到第二个输出变量c。
3)size(A,n)如果在size函数的输入参数中再添加一项n,并用1、2或者3为n赋值,则 size将返回矩阵的行数或列数。
其中r=size(A,1)该语句返回的时矩阵A的行数, c=size(A,2) 该语句返回的时矩阵A的列数。
如果A为一个二维数组,则可以将其看成一个第三维为1的数组,即size(A,3)的返回值为1。
2 padarray()函数B = padarray(A,padsize,padval,direction)A为输入图像,B为填充后的图像,padsize给出了给出了填充的行数和列数,通常用[r c]来表示。
padval和direction分别表示填充方法和方向。
它们的具体值和描述如下:Padval选项:'symmetric'表示图像大小通过围绕边界进行镜像反射来扩展;'replicate'表示图像大小通过复制外边界中的值来扩展;'circular'图像大小通过将图像看成是一个二维周期函数的一个周期来进行扩展。
Direction选项:'pre'表示在每一维的第一个元素前填充;'post'表示在每一维的最后一个元素后填充;'both'表示在每一维的第一个元素前和最后一个元素后填充,此项为默认值。
若参量中不包括direction,则默认值为'both';若参量中不包含padval,则默认用0来填充。
若参量中不包括任何参数,则默认填充为零且方向为'both'。
MATLAB图像处理函数大全

Matlab图像处理函数大全(一)图像增强1. 直方图均衡化的Matlab 实现1.1 imhist 函数功能:计算和显示图像的色彩直方图格式:imhist(I,n)imhist(X,map)说明:imhist(I,n) 其中,n 为指定的灰度级数目,缺省值为256;imhist(X,map) 就算和显示索引色图像X 的直方图,map 为调色板。
用stem(x,counts) 同样可以显示直方图。
1.2 imcontour 函数功能:显示图像的等灰度值图格式:imcontour(I,n),imcontour(I,v)说明:n 为灰度级的个数,v 是有用户指定所选的等灰度级向量。
1.3 imadjust 函数功能:通过直方图变换调整对比度格式:J=imadjust(I,[low high],[bottom top],gamma)newmap=imadjust(map,[low high],[bottom top],gamma)说明:J=imadjust(I,[low high],[bottom top],gamma) 其中,gamma 为校正量r,[low high] 为原图像中要变换的灰度范围,[bottom top] 指定了变换后的灰度范围;newmap=imadjust(map,[low high],[bottom top],gamma) 调整索引色图像的调色板map 。
此时若[low high] 和[bottom top] 都为2×3的矩阵,则分别调整R、G、B 3个分量。
1.4 histeq 函数功能:直方图均衡化格式:J=histeq(I,hgram)J=histeq(I,n)[J,T]=histeq(I,...)newmap=histeq(X,map,hgram)newmap=histeq(X,map)[new,T]=histeq(X,...)说明:J=histeq(I,hgram) 实现了所谓“直方图规定化”,即将原是图象I 的直方图变换成用户指定的向量hgram 。
matlab图像处理命令汇总

matlab图像处理命令汇总1.applylut (5)2.bestblk (5)3.blkproc (5)4.brighten (5)5.bwarea (5)6.bweuler. (6)7.bwfill (6)8.bwlabel (6)9.bwmorph (6)10.bwperim (7)11.bwselect (7)12.cmpermute (7)13.cmunique (8)14.col2im (8)15.colfilt (8)16.colorbar (8)17.conv2二维卷积操作. (9)18.convmtx2 (9)19.convn (9)20.corr2 (9)21.dct2 (9)22.dctmtx (10)23.dilate (10)24.dither (10)25.double (10)26.edge (11)27.erode (11)28.fft2 (12)29.fftn (12)30.fftshift (12)31.filter2 (13)32.freqspace (13)33.freqz2 (13)34.fsamp2 (13)35.fspecial (14)36.ftrans2 (14)37.fwind1 (14)38.fwind2 (15)39.getimage (15)40.gray2ind (15)41.grayslice (16)42.histeq (16)44.idct2 (17)45.ifft2 (17)46.ifftn (17)47.sim2bw (17)48.im2col (18)49.im2double (18)50.im2uint8 (18)51.im2uint16 (18)52.imadjust (19)53.imapprox (19)55.imcrop (20)56.imfeature (20)57.imfinfo (20)58.imhist (20)59.immovie (21)60.imnoise (21)61.impixel (21)63.imread (22)64.imresize (23)65.imrotate (23)66.imshow (23)67.imwrite (24)68.ind2gray (24)69.ind2rgb (24)70.iptgetpref (25)71.iptsetpref (25)72.iradon (25)73.isbw (25)74.isgray (26)75.isind (26)76.isrgb (26)77.makelut (26)78.mat2gray (26)79.mean2 (27)80.medfilt2 (27)81.montage (27)82.nlfilter (28)83.ntsc2rgb (28)84.ordfilt2 (28)85.phantom (28)86.pixval (29)87.qtdecomp (29)88.qtgetblk (29)90.radon (30)91.rgb2gray (30)92.rgb2hsv (30)93.rgb2ind (30)94.rgb2ntsc (31)95.rgb2ycbcr (31)96.rgbplot (31)97.roicolor (31)98.roifill (32)99.roifilt2 (32)100.roipoly (32)101.std2 (33)102.subimage (33)103.truesize (33)104.uint8 (34)105.uint16 (34)106.warp (34)107.wiener2 (34)108.ycbcr2rgb (35)109.zoom (35)110. fft2: (35)111.ifft2: (35)112. imnoise: (36)113. fspecial: (36)114.imhist (36)115.histeq (36)116.imadjust (36)117.log (36)118.filter2 (36)119. conv2 (37)120.medfilt2 (37)121. Sobel算子锐化图像 (37)122.利用拉氏算子锐化图像 (37)123. sobel算子图像边缘检测 (37)124.prewitt算子图像边缘检测 (37)125.roberts算子图像边缘检测 (38)126.log算子图像边缘检测 (38)127.canny算子图像边缘检测 (38)128.Zero-Cross算子图像边缘检测 (38)129. imdilate膨胀: (38)130.imerode执行腐蚀 (38)131. imopen开运算 (38)132. imclose闭运算 (38)133. imhist :计算和显示图像的色彩直方图 (39)134. imcontour :显示图像的等灰度值图 (39)135. imadjust :通过直方图变换调整对比度 (39)136. histeq :直方图均衡化 (39)137. imnoise 函数 (39)138.conv2 函数:计算二维卷积 (40)139. conv :计算多维卷积 (40)140.filter2:计算二维线型数字滤波,它与函数fspecial 连用 (40)141.fspecial :产生预定义滤波器 (40)142. imfilter:真彩色增强 (41)143. 离散傅立叶变换的Matlab 实现fft、fft2 和fftn (41)144.离散余弦变换的Matlab 实现dCT2 dict2 dctmtx (41)145. 图像小波变换的Matlab 实现dwt idwt wcodemat dwt2 wavedec2 idwt2 (42)146.图像处理工具箱 (44)147.MATLAB图像类型转换 (46)148.图像文件的读写和查询 (46)149. 图像文件的显示 (47)1.applylut功能: 在二进制图像中利用lookup表进行边沿操作. 语法: A = applylut(BW,lut)举例lut = makelut('sum(x(:)) == 4',2);BW1 = imread('text.tif');BW2 = applylut(BW1,lut);imshow(BW1)figure, imshow(BW2)2.bestblk功能: 确定进行块操作的块大小.语法: siz = bestblk([m n],k)[mb,nb] = bestblk([m n],k)3.blkproc功能: 实现图像的显式块操作.语法: B = blkproc(A,[m n],fun)B = blkproc(A,[m n],fun,P1,P2,...)B = blkproc(A,[m n],[mborder nborder],fun,...)B = blkproc(A,'indexed',...)举例I = imread('alumgrns.tif');I2 = blkproc(I,[8 8],'std2(x)*ones(size(x))');imshow(I)figure, imshow(I2,[]);相关命令:colfilt, nlfilter,inline4.brighten功能: 增加或降低颜色映像表的亮度.语法: brighten(beta)newmap = brighten(beta)newmap = brighten(map,beta)brighten(fig,beta)相关命令:imadjust, rgbplot5.bwarea功能: 计算二进制图像对象的面积.语法: total = bwarea(BW)举例BW = imread('circles.tif'); imshow(BW);bwarea(BW)ans =15799相关命令:bweuler, bwperim6.bweuler.功能: 计算二进制图像的欧拉数.语法: eul = bweuler(BW,n)相关命令:bwmorph, bwperim7.bwfill功能: 填充二进制图像的背景色.语法: BW2 = bwfill(BW1,c,r,n)BW2 = bwfill(BW1,n)[BW2,idx] = bwfill(...)BW2 = bwfill(x,y,BW1,xi,yi,n)[x,y,BW2,idx,xi,yi] = bwfill(...)BW2 = bwfill(BW1,'holes',n)[BW2,idx] = bwfill(BW1,'holes',n)8.bwlabel功能: 标注二进制图像中已连接的部分. 语法: L = bwlabel(BW,n)[L,num] = bwlabel(BW,n)相关命令:bweuler, bwselect9.bwmorph功能: 提取二进制图像的轮廓.语法: BW2 = bwmorph(BW1,operation) BW2 = bwmorph(BW1,operation,n)举例BW1 = imread('circles.tif');imshow(BW1);BW2 = bwmorph(BW1,'remove');BW3 = bwmorph(BW1,'skel',Inf);imshow(BW2)figure, imshow(BW3)相关命令:bweuler, bwperim, dilate, erode10.bwperim功能: 计算二进制图像中对象的周长. 语法: BW2 = bwperim(BW1,n)举例BW1 = imread('circbw.tif');BW2 = bwperim(BW1,8);imshow(BW1)figure, imshow(BW2)附录MATLAB图像处理命令325相关命令:bwarea, bweuler, bwfill11.bwselect功能: 在二进制图像中选择对象.语法: BW2 = bwselect(BW1,c,r,n)BW2 = bwselect(BW1,n)[BW2,idx] = bwselect(...)举例BW1 = imread('text.tif');c = [16 90 144];r = [85 197 247];BW2 = bwselect(BW1,c,r,4);imshow(BW1)figure, imshow(BW2)相关命令:bwfill, bwlabel, impixel, roipoly, roifill 12.cmpermute功能: 调整颜色映像表中的颜色.语法: [Y,newmap] = cmpermute(X,map) [Y,newmap] = cmpermute(X,map,index) 举例To order a colormap by luminance, use: ntsc = rgb2ntsc(map);[dum,index] = sort(ntsc(:,1));[Y,newmap] = cmpermute(X,map,index);相关命令:randperm13.cmunique功能: 查找颜色映像表中特定的颜色及相应的图像. 语法: [Y,newmap] = cmunique(X,map)[Y,newmap] = cmunique(RGB)[Y,newmap] = cmunique(I)相关命令:gray2ind, rgb2ind14.col2im功能: 将矩阵的列重新组织到块中.语法: A = col2im(B,[m n],[mm nn],block_type)A = col2im(B,[m n],[mm nn])相关命令:blkproc, colfilt, im2col, nlfilter15.colfilt功能: 利用列相关函数进行边沿操作.语法: B = colfilt(A,[m n],block_type,fun)B = colfilt(A,[m n],block_type,fun,P1,P2,...)B = colfilt(A,[m n],[mblock nblock],block_type,fun,...)B = colfilt(A,'indexed',...)相关命令:blkproc, col2im, im2col, nlfilter16.colorbar功能: 显示颜色条.语法: colorbar('vert')colorbar('horiz')colorbar(h)colorbarh = colorbar(...)举例I = imread('blood1.tif');h = fspecial('log');I2 = filter2(h,I);imshow(I2,[]), colormap(jet(64)), colorbar17.conv2二维卷积操作.功能: 进行二维卷积操作.语法: C = conv2(A,B)C = conv2(hcol,hrow,A)C = conv2(...,shape)相关命令:filter218.convmtx2功能: 计算二维卷积矩阵.语法: T = convmtx2(H,m,n)T = convmtx2(H,[m n])相关命令:conv219.convn功能: 计算n维卷积.语法: C = convn(A,B)C = convn(A,B,shape)相关命令:conv220.corr2功能: 计算两个矩阵的二维相关系数.附录MATLAB图像处理命令329语法: r = corr2(A,B)相关命令:std221.dct2功能: 进行二维离散余弦变换.语法: B = dct2(A)B = dct2(A,m,n)B = dct2(A,[m n])举例RGB = imread('autumn.tif');I = rgb2gray(RGB);J = dct2(I);imshow(log(abs(J)),[]), colormap(jet(64)), colorbarJ(abs(J) < 10) = 0;K = idct2(J)/255;imshow(K)相关命令:fft2, idct2, ifft222.dctmtx功能: 计算离散余弦变换矩阵.语法: D = dctmtx(n)相关命令:dct223.dilate功能: 放大二进制图像.语法: BW2 = dilate(BW1,SE)BW2 = dilate(BW1,SE,alg)BW2 = dilate(BW1,SE,...,n)举例BW1 = imread('text.tif');SE = ones(6,2);BW2 = dilate(BW1,SE);imshow(BW1)figure, imshow(BW2)相关命令:bwmorph, erode24.dither功能: 通过抖动增加外观颜色分辨率,转换图像. 语法: X = dither(RGB,map)BW = dither(I)相关命令:rgb2ind25.double功能: 转换数据为双精度型.语法:B = double(A)举例A = imread('saturn.tif');B = sqrt(double(A));相关命令:im2double, im2uint, uint826.edge功能: 识别强度图像中的边界.语法: BW = edge(I,'sobel')BW = edge(I,'sobel',thresh)BW = edge(I,'sobel',thresh,direction)[BW,thresh] = edge(I,'sobel',...)BW = edge(I,'prewitt')BW = edge(I,'prewitt',thresh)BW = edge(I,'prewitt',thresh,direction) [BW,thresh] = edge(I,'prewitt',...)BW = edge(I,'roberts')BW = edge(I,'roberts',thresh)[BW,thresh] = edge(I,'roberts',...)BW = edge(I,'log')BW = edge(I,'log',thresh)BW = edge(I,'log',thresh,sigma)[BW,threshold] = edge(I,'log',...)BW = edge(I,'zerocross',thresh,h)[BW,thresh] = edge(I,'zerocross',...)BW = edge(I,'canny')BW = edge(I,'canny',thresh)BW = edge(I,'canny',thresh,sigma)MATLAB高级应用——图形及影像处理332 [BW,threshold] = edge(I,'canny',...)举例I = imread('rice.tif');BW1 = edge(I,'prewitt');BW2 = edge(I,'canny');imshow(BW1);figure, imshow(BW2)27.erode功能: 弱化二进制图像的边界.语法:BW2 = erode(BW1,SE)BW2 = erode(BW1,SE,alg)BW2 = erode(BW1,SE,...,n)举例BW1 = imread('text.tif');SE = ones(3,1);BW2 = erode(BW1,SE);imshow(BW1)figure, imshow(BW2)相关命令:bwmorph, dilate附录MATLAB图像处理命令33328.fft2功能: 进行二维快速傅里叶变换.语法:B = fft2(A)B = fft2(A,m,n)举例load imdemos saturn2imshow(saturn2)B = fftshift(fft2(saturn2));imshow(log(abs(B)),[]), colormap(jet(64)), colorbar相关命令:dct2, fftshift, idct2, ifft229.fftn功能: 进行n维快速傅里叶变换.语法: B = fftn(A)B = fftn(A,siz)相关命令:fft2, ifftn30.fftshift功能: 把快速傅里叶变换的DC组件移到光谱中心. 语法:B = fftshift(A)举例B = fftn(A);C = fftshift(B);相关命令:fft2, fftn, ifftshift31.filter2功能: 进行二维线性过滤操作.语法: B = filter2(h,A)B = filter2(h,A,shape)相关命令:conv2, roifilt232.freqspace功能: 确定二维频率响应的频率空间.语法: [f1,f2] = freqspace(n)[f1,f2] = freqspace([m n])[x1,y1] = freqspace(...,'meshgrid')f = freqspace(N)f = freqspace(N,'whole')相关命令:fsamp2, fwind1, fwind233.freqz2功能: 计算二维频率响应.语法: [H,f1,f2] = freqz2(h,n1,n2)[H,f1,f2] = freqz2(h,[n2 n1])[H,f1,f2] = freqz2(h,f1,f2)[H,f1,f2] = freqz2(h)[...] = freqz2(h,...,[dx dy])[...] = freqz2(h,...,dx)freqz2(...)举例Hd = zeros(16,16);Hd(5:12,5:12) = 1;Hd(7:10,7:10) = 0;h = fwind1(Hd,bartlett(16));colormap(jet(64))freqz2(h,[32 32]); axis ([-1 1 -1 1 0 1]) 34.fsamp2功能: 用频率采样法设计二维FIR过滤器. 语法:h = fsamp2(Hd)h = fsamp2(f1,f2,Hd,[m n])举例[f1,f2] = freqspace(21,'meshgrid');Hd = ones(21);r = sqrt(f1.^2 + f2.^2);Hd((r0.5)) = 0;colormap(jet(64))mesh(f1,f2,Hd)相关命令:conv2, filter2, freqspace, ftrans2, fwind1, fwind2 35.fspecial功能: 创建预定义过滤器.语法:h = fspecial(type)h = fspecial(type,parameters)举例I = imread('saturn.tif');h = fspecial('unsharp',0.5);I2 = filter2(h,I)/255;imshow(I)figure, imshow(I2)相关命令:conv2, edge, filter2, fsamp2, fwind1, fwind236.ftrans2功能: 通过频率转换设计二维FIR过滤器.语法:h = ftrans2(b,t)h = ftrans2(b)举例colormap(jet(64))b = remez(10,[0 0.05 0.15 0.55 0.65 1],[0 0 1 1 0 0]); [H,w] = freqz(b,1,128,'whole');plot(w/pi-1,fftshift(abs(H)))相关命令:conv2, filter2, fsamp2, fwind1, fwind237.fwind1功能: 用一维窗口方法设计二维FIR过滤器.语法:h = fwind1(Hd,win)h = fwind1(Hd,win1,win2)h = fwind1(f1,f2,Hd,...)举例[f1,f2] = freqspace(21,'meshgrid');Hd = ones(21);r = sqrt(f1.^2 + f2.^2);Hd((r0.5)) = 0;colormap(jet(64))mesh(f1,f2,Hd)相关命令:conv2, filter2, fsamp2, freqspace, ftrans2, fwind2 38.fwind2功能: 用二维窗口方法设计二维FIR过滤器. 语法:h = fwind2(Hd,win)h = fwind2(f1,f2,Hd,win)举例[f1,f2] = freqspace(21,'meshgrid');Hd = ones(21);r = sqrt(f1.^2 + f2.^2);Hd((r0.5)) = 0;colormap(jet(64))mesh(f1,f2,Hd)相关命令:conv2, filter2, fsamp2, freqspace, ftrans2, fwind1 39.getimage功能: 从坐标轴取得图像数据.语法:A = getimage(h)[x,y,A] = getimage(h)[...,A,flag] = getimage(h)[...] = getimage举例imshow rice.tifI = getimage;40.gray2ind功能: 转换灰度图像为索引图像.语法:[X,map] = gray2ind(I,n)相关命令:ind2gray41.grayslice功能: 从灰度图像创建索引图像.语法:X = grayslice(I,n)X = grayslice(I,v)举例I = imread('ngc4024m.tif');X = grayslice(I,16);imshow(I)figure, imshow(X,jet(16))相关命令:gray2ind42.histeq功能: 用柱状图均等化增强对比.语法:J = histeq(I,hgram)J = histeq(I,n)[J,T] = histeq(I,...)举例I = imread('tire.tif');J = histeq(I);imshow(I)figure, imshow(J)imhist(I,64)figure; imhist(J,64)相关命令:brighten, imadjust, imhist43.hsv2rgb功能: 转换HSV值为RGB颜色空间.语法:rgbmap = hsv2rgb(hsvmap)RGB = hsv2rgb(HSV)相关命令:MATLAB高级应用——图形及影像处理340 rgb2hsv, rgbplot功能: 计算二维离散反余弦变换. 语法:B = idct2(A)B = idct2(A,m,n)B = idct2(A,[m n])相关命令:dct2, dctmtx, fft2, ifft245.ifft2功能: 计算二维快速傅里叶反变换. 语法:B = ifft2(A)B = ifft2(A,m,n)相关命令:fft2, fftshift, idct246.ifftn功能: 计算n维快速傅里叶反变换. 语法:B = ifftn(A)B = ifftn(A,siz)相关命令:fft2, fftn, ifft247.sim2bw功能: 转换图像为二进制图像.语法:BW = im2bw(I,level)BW = im2bw(X,map,level)BW = im2bw(RGB,level)举例load treesBW = im2bw(X,map,0.4);imshow(X,map)figure, imshow(BW)相关命令:ind2gray, rgb2gray功能: 重调图像,块为列.语法:B = im2col(A,[m n],block_type)B = im2col(A,[m n])B = im2col(A,'indexed',...)相关命令:blkproc, col2im, colfilt, nlfilter49.im2double功能: 转换图像矩阵为双精度型.语法:I2 = im2double(I1)RGB2 = im2double(RGB1)BW2 = im2double(BW1)X2 = im2double(X1,'indexed')相关命令:double, im2uint8, uint850.im2uint8功能: 转换图像阵列为8位无符号整型.语法:I2 = im2uint8(I1)RGB2 = im2uint8(RGB1)BW2 = im2uint8(BW1)X2 = im2uint8(X1,'indexed')MATLAB高级应用——图形及影像处理342相关命令:im2uint16, double, im2double, uint8, imapprox, uint16 51.im2uint16功能: 转换图像阵列为16位无符号整型.语法:I2 = im2uint16(I1)RGB2 = im2uint16(RGB1)X2 = im2uint16(X1,'indexed')相关命令:im2uint8, double, im2double, uint8, uint16, imapprox功能: 调整图像灰度值或颜色映像表.语法:J = imadjust(I,[low high],[bottom top],gamma) newmap = imadjust(map,[low high],[bottom top],gamma) RGB2 = imadjust(RGB1,...)举例I = imread('pout.tif');J = imadjust(I,[0.3 0.7],[]);imshow(I)figure, imshow(J)相关命令:brighten, histeq53.imapprox功能: 对索引图像进行近似处理.语法:[Y,newmap] = imapprox(X,map,n)附录MATLAB图像处理命令343[Y,newmap] = imapprox(X,map,tol)Y = imapprox(X,map,newmap)[...] = imapprox(...,dither_option)相关命令:cmunique, dither, rgb2ind54.imcontour功能: 创建图像数据的轮廓图.语法:imcontour(I,n)imcontour(I,v)imcontour(x,y,...)imcontour(...,LineSpec)[C,h] = imcontour(...)举例I = imread('ic.tif');imcontour(I,3)相关命令:clabel, contour, LineSpec55.imcrop功能: 剪切图像.语法: I2 = imcrop(I)X2 = imcrop(X,map)RGB2 = imcrop(RGB)I2 = imcrop(I,rect)X2 = imcrop(X,map,rect)RGB2 = imcrop(RGB,rect)MATLAB高级应用——图形及影像处理344 [...] = imcrop(x,y,...)[A,rect] = imcrop(...)[x,y,A,rect] = imcrop(...)举例I = imread('ic.tif');I2 = imcrop(I,[60 40 100 90]);imshow(I)figure, imshow(I2)相关命令:zoom56.imfeature功能: 计算图像区域的特征尺寸.语法:stats = imfeature(L,measurements)stats = imfeature(L,measu rements,n)相关命令:bwlabel57.imfinfo功能: 返回图形文件信息.语法:info = imfinfo(filename,fmt)info = imfinfo(filename)相关命令:imread, imwrite58.imhist功能: 显示图像数据的柱状图.语法: imhist(I,n)imhist(X,map)[counts,x] = imhist(...)举例I = imread('pout.tif');imhist(I)相关命令:histeq59.immovie功能: 创建多帧索引图的电影动画.语法: mov = immovie(X,map)举例load mrimov = immovie(D,map);相关命令:montage60.imnoise功能: 增加图像的渲染效果.语法: J = imnoise(I,type)J = imnoise(I,type,parameters)举例I = imread('eight.tif');J = imnoise(I,'salt & pepper',0.02);imshow(I)figure, imshow(J)相关命令:rand61.impixel功能: 确定像素颜色值.语法:MATLAB高级应用——图形及影像处理348 P = impixel(I)P = impixel(X,map)P = impixel(RGB)P = impixel(I,c,r)P = impixel(X,map,c,r)P = impixel(RGB,c,r)[c,r,P] = impixel(...)P = impixel(x,y,I,xi,yi)P = impixel(x,y,X,map,xi,yi)P = impixel(x,y,RGB,xi,yi)[xi,yi,P] = impixel(x,y,...)举例RGB = imread('flowers.tif');c = [12 146 410];r = [104 156 129];pixels = impixel(RGB,c,r)pixels =61 59 101253 240 0237 37 44相关命令:improfile, pixval62.improfile功能: 沿线段计算剖面图的像素值.语法:c = improfilec = improfile(n)c = improfile(I,xi,yi)c = improfile(I,xi,yi,n)[cx,cy,c] = improfile(...)[cx,cy,c,xi,yi] = improfile(...)[...] = improfile(x,y,I,xi,yi)[...] = improfile(x,y,I,xi,yi,n)[...] = improfile(...,method)举例I = imread('alumgrns.tif');x = [35 338 346 103];y = [253 250 17 148];improfile(I,x,y), grid on相关命令:impixel, pixval63.imread功能: 从图形文件中读取图像.语法:A = imread(filename,fmt)[X,map] = imread(filename,fmt)[...] = imread(filename)[...] = imread(...,idx) (TIFF only)[...] = imread(...,ref) (HDF only)[...] = imread(...,'BackgroundColor',BG) (PNG only)[A,map,alpha] = imread(...) (PNG only)举例[X,map] = imread('flowers.tif',6);info = imfinfo('skull.hdf');[X,map] = imread('skull.hdf',info(4).Reference); bg = [255 0 0];A = imread('image.png','BackgroundColor',bg); MATLAB高级应用——图形及影像处理350 [A,map,alpha] = imread('image.png');相关命令:imfinfo, imwrite,fread,double,uint8,uint16 64.imresize功能: 改变图像大小.语法:B = imresize(A,m,method)B = imresize(A,[mrows ncols],method)B = imresize(...,method,n)B = imresize(...,method,h)65.imrotate功能: 旋转图像.语法:B = imrotate(A,angle,method)B = imrotate(A,angle,method,'crop')举例I = imread('ic.tif');J = imrotate(I,-4,'bilinear' 'crop');imshow(I)figure, imshow(J)相关命令:imcrop, imresize66.imshow功能: 显示图像.语法:附录MATLAB图像处理命令351imshow(I,n)imshow(I,[low high])imshow(BW)imshow(X,map)imshow(RGB)imshow(...,display_option)imshow(x,y,A,...)imshow filenameh = imshow(...)相关命令:getimage, imread, iptgetpref, iptsetpref, subimage, truesize, warp 67.imwrite功能: 把图像写入图形文件中.语法:imwrite(A,filename,fmt)imwrite(X,map,filename,fmt)imwrite(...,filename)imwrite(...,Param1,Val1,Param2,Val2...)举例imwrite(X,map,'flowers.hdf','Compression','none',...'WriteMode','append')相关命令:imfinfo, imread68.ind2gray功能: 把检索图像转化为灰度图像.语法:I = ind2gray(X,map)举例load treesI = ind2gray(X,map);imshow(X,map)figure,imshow(I)MATLAB高级应用——图形及影像处理352相关命令:gray2ind, imshow, rgb2ntsc69.ind2rgb功能: 转化索引图像为RGB真彩图像.语法:RGB = ind2rgb(X,map)相关命令:ind2gray, rgb2ind70.iptgetpref功能: 获取图像处理工具箱参数设置. 语法:value = iptgetpref(prefname)举例value = iptgetpref('ImshowAxesVisible') value =off相关命令:imshow, iptsetpref71.iptsetpref功能: 设置图像处理工具箱参数.语法:iptsetpref(prefname,value)举例iptsetpref('ImshowBorder','tight')相关命令:imshow, iptgetpref, truesize72.iradon功能: 进行反Radon变换.语法:I = iradon(P,theta)I = iradon(P,theta,interp,filter,d,n)[I,h] = iradon(...)举例P = phantom(128);R = radon(P,0:179);I = iradon(R,0:179,'nearest','Hann'); imshow(P)figure, imshow(I)相关命令:radon, phantom73.isbw功能: 判断是否为二进制图像.语法:flag = isbw(A)相关命令:isind, isgray, isrgb74.isgray功能: 判断是否为灰度图像.语法:flag = isgray(A)相关命令:isbw, isind, isrgb75.isind功能: 判断是否为索引图像.语法:flag = isind(A)相关命令:isbw, isgray, isrgb76.isrgb功能: 判读是否为RGB真彩图像.语法:flag = isrgb(A)相关命令:isbw, isgray, isind77.makelut功能: 创建一个用于applylut函数的lookup表. 语法:lut = makelut(fun,n)lut = makelut(fun,n,P1,P2,...)相关命令:applylut78.mat2gray功能: 转化矩阵为灰度图像.语法:I = mat2gray(A,[amin amax])I = mat2gray(A)举例I = imread('rice.tif');J = filter2(fspecial('sobel'),I);K = mat2gray(J);imshow(I)figure, imshow(K)相关命令:gray2ind79.mean2功能: 计算矩阵元素的平均值.语法:b = mean2(A)相关命令:std2, mean, std80.medfilt2功能: 进行二维中值过滤.语法:MATLAB高级应用——图形及影像处理356 B = medfilt2(A,[m n])B = medfilt2(A)B = medfilt2(A,'indexed',...)举例I = imread('eight.tif');J = imnoise(I,'salt & pepper',0.02);K = medfilt2(J);imshow(J)figure, imshow(K)相关命令:filter2, ordfilt2, wiener281.montage功能: 在矩形框中同时显示多幅图像.语法:montage(I)montage(BW)montage(X,map)montage(RGB)h = montage(...)举例load mrimontage(D,map)相关命令:82.nlfilter功能: 进行边沿操作.语法:B = nlfilter(A,[m n],fun)B = nlfilter(A,[m n],fun,P1,P2,...)B = nlfilter(A,'indexed',...)举例B = nlfilter(A,[3 3],'median(x(:))');相关命令:blkproc, colfilt83.ntsc2rgb功能: 转换NTSC的值为RGB颜色空间.语法:rgbmap = ntsc2rgb(yiqmap)RGB = ntsc2rgb(YIQ)相关命令:rgb2ntsc, rgb2ind, ind2rgb, ind2gray84.ordfilt2功能: 进行二维统计顺序过滤.语法:B = ordfilt2(A,order,domain)B = ordfilt2(A,order,domain,S)MATLAB高级应用——图形及影像处理358 B = ordfilt2(...,padopt)相关命令:medfilt285.phantom功能: 产生一个头部幻影图像.语法:P = phantom(def,n)P = phantom(E,n)[P,E] = phantom(...)举例P = phantom('Modified Shepp-Logan',200); imshow(P)radon, iradon86.pixval功能: 显示图像像素信息.语法:pixval onpixval offpixvalpixval(fig,option)相关命令:impixel, improfile87.qtdecomp功能: 进行四叉树分解.语法:S = qtdecomp(I)S = qtdecomp(I,threshold)S = qtdecomp(I,threshold,mindim)S = qtdecomp(I,threshold,[mindim maxdim])S = qtdecomp(I,fun)S = qtdecomp(I,fun,P1,P2,...)88.qtgetblk功能: 获取四叉树分解中的块值.语法:[vals,r,c] = qtgetblk(I,S,dim)MATLAB高级应用——图形及影像处理360 [vals,idx] = qtgetblk(I,S,dim)相关命令:qtdecomp, qtsetblk89.qtsetblk功能: 设置四叉树分解中的块值.语法:J = qtsetblk(I,S,dim,vals)相关命令:qtdecomp, qtgetblk功能: 计算Radon变换.语法:R = radon(I,theta)R = radon(I,theta,n)[R,xp] = radon(...)举例iptsetpref('ImshowAxesVisible','on')I = zeros(100,100);I(25:75,25:75) = 1;theta = 0:180;[R,xp] = radon(I,theta);imshow(theta,xp,R,[]), colormap(hot), colorbar相关命令:iradon, phantom91.rgb2gray功能: 转换RGB图像或颜色映像表为灰度图像. 语法:I = rgb2gray(RGB)newmap = rgb2gray(map)相关命令:MATLAB高级应用——图形及影像处理362 ind2gray, ntsc2rgb, rgb2ind, rgb2ntsc92.rgb2hsv功能: 转化RGB值为HSV颜色空间.语法:hsvmap = rgb2hsv(rgbmap)HSV = rgb2hsv(RGB)相关命令:hsv2rgb, rgbplot93.rgb2ind功能: 转化RGB图像为索引图像.语法:[X,map] = rgb2ind(RGB,tol)[X,map] = rgb2ind(RGB,n)X = rgb2ind(RGB,map)[...] = rgb2ind(...,dither_option)举例RGB = imread('flowers.tif');[X,map] = rgb2ind(RGB,128);imshow(X,map)相关命令:cmunique, dither, imapprox, ind2rgb, rgb2gray 94.rgb2ntsc功能: 转化RGB的值为NTSC颜色空间. 语法:yiqmap = rgb2ntsc(rgbmap)YIQ = rgb2ntsc(RGB)相关命令:ntsc2rgb, rgb2ind, ind2rgb, ind2gray95.rgb2ycbcr功能: 转化RGB的值为YcbCr颜色空间. 语法:ycbcrmap = rgb2ycbcr(rgbmap)YCBCR = rgb2ycbcr(RGB)相关命令:ntsc2rgb, rgb2ntsc, ycbcr2rgb96.rgbplot功能: 划分颜色映像表.语法:rgbplot(map)举例rgbplot(jet)相关命令:colormap97.roicolor功能: 选择感兴趣的颜色区.语法:BW = roicolor(A,low,high)BW = roicolor(A,v)举例I = imread('rice.tif');BW = roicolor(I,128,255);imshow(I);figure, imshow(BW)相关命令:roifilt2, roipoly98.roifill功能: 在图像的任意区域中进行平滑插补. 语法:J = roifill(I,c,r)J = roifill(I)J = roifill(I,BW)[J,BW] = roifill(...)J = roifill(x,y,I,xi,yi)[x,y,J,BW,xi,yi] = roifill(...)举例I = imread('eight.tif');c = [222 272 300 270 221 194];r = [21 21 75 121 121 75];J = roifill(I,c,r);imshow(I)figure, imshow(J)相关命令:roifilt2, roipoly99.roifilt2功能: 过滤敏感区域.语法:J = roifilt2(h,I,BW)J = roifilt2(I,BW,fun)J = roifilt2(I,BW,fun,P1,P2,...)举例h = fspecial('unsharp');J = roifilt2(h,I,BW);imshow(J)相关命令:filter2, roipoly100.roipoly功能: 选择一个敏感的多边形区域.语法:BW = roipoly(I,c,r)BW = roipoly(I)BW = roipoly(x,y,I,xi,yi)[BW,xi,yi] = roipoly(...)[x,y,BW,xi,yi] = roipoly(...)举例I = imread('eight.tif');c = [222 272 300 270 221 194];r = [21 21 75 121 121 75];BW = roipoly(I,c,r);imshow(I)figure, imshow(BW)相关命令:roifilt2, roicolor, roifill101.std2功能: 计算矩阵元素的标准偏移. 语法:b = std2(A)相关命令:corr2, mean2102.subimage功能: 在一幅图中显示多个图像. 语法:subimage(X,map)subimage(I)subimage(BW)subimage(RGB)subimage(x,y,...)h = subimage(...)举例load trees[X2,map2] = imread('forest.tif'); subplot(1,2,1), subimage(X,map) subplot(1,2,2), subimage(X2,map2) 相关命令:附录MATLAB图像处理命令367 103.truesize功能: 调整图像显示尺寸.语法: truesize(fig,[mrows mcols])truesize(fig)相关命令:imshow, iptsetpref, iptgetpref104.uint8功能: 转换数据为8位无符号整型.语法:B = uint8(A)相关命令:double, im2double, im2uint8105.uint16功能: 转换数据为16位无符号整型.语法: I = uint16(X)相关命令:double, datatypes, uint8, uint32, int8, int16, int32. 106.warp功能: 将图像显示到纹理映射表面.语法:warp(X,map)warp(I,n)warp(BW)warp(RGB)warp(z,...)warp(x,y,z,...)h = warp(...)举例[x,y,z] = cylinder;I = imread('testpat1.tif');warp(x,y,z,I);相关命令:imshow107.wiener2功能: 进行二维适应性去噪过滤处理.语法:J = wiener2(I,[m n],noise)[J,noise] = wiener2(I,[m n])举例I = imread('saturn.tif');J = imnoise(I,'gaussian',0,0.005);K = wiener2(J,[5 5]);imshow(J)figure, imshow(K)相关命令:filter2, medfilt2108.ycbcr2rgb功能: 转化YcbCr值为RGB颜色空间.语法:rgbmap = ycbcr2rgb(ycbcrmap)RGB = ycbcr2rgb(YCBCR)相关命令:ntsc2rgb, rgb2ntsc, rgb2ycbcr109.zoom功能: 缩放图像.语法:zoom onzoom offzoom outzoom resetzoomzoom xonzoom yonzoom(factor)zoom(fig,option)相关命令:Imcrop110. fft2:fft2函数用于数字图像的二维傅立叶变换,如:i=imread('104_8.tif'); j=fft2(i);111.ifft2:ifft2函数用于数字图像的二维傅立叶反变换,如:i=imread('104_8.tif');j=fft2(i);k=ifft2(j);112. imnoise:用于对图像生成模拟噪声,如:i=imread('104_8.tif');j=imnoise(i,'gaussian',0,0.02);%模拟高斯噪声113. fspecial:用于产生预定义滤波器,如:h=fspecial('sobel');%sobel水平边缘增强滤波器h=fspecial('gaussian');%高斯低通滤波器h=fspecial('laplacian');%拉普拉斯滤波器h=fspecial('log');%高斯拉普拉斯(LoG)滤波器h=fspecial('average');%均值滤波器114.imhist函数用于数字图像的直方图显示,如:i=imread('104_8.tif');imhist(i);115.histeq函数用于数字图像的直方图均化,如:i=imread('104_8.tif');j=histeq(i);116.imadjust函数用于数字图像的对比度调整,如:i=imread('104_8.tif');j=imadjust(i,[0.3,0.7],[]);117.log函数用于数字图像的对数变换,如:i=imread('104_8.tif');j=double(i);k=log(j);118.filter2函数用于图像滤波,如:i=imread('104_8.tif');h=[1,2,1;0,0,0;-1,-2,-1];j=filter2(h,i);119. conv2线性滤波:利用二维卷积conv2滤波, 如: i=imread('104_8.tif');h=[1,1,1;1,1,1;1,1,1];h=h/9;j=conv2(i,h);120.medfilt2函数用于图像的中值滤波,如:i=imread('104_8.tif');j=medfilt2(i);121. Sobel算子锐化图像Sobel算子锐化图像, 如:i=imread('104_8.tif');h=[1,2,1;0,0,0;-1,-2,-1];%Sobel算子j=filter2(h,i);122.利用拉氏算子锐化图像i=imread('104_8.tif');j=double(i);h=[0,1,0;1,-4,0;0,1,0];%拉氏算子k=conv2(j,h,'same');m=j-k;123. sobel算子图像边缘检测i=imread('104_8.tif');j = edge(i,'sobel',thresh)124.prewitt算子图像边缘检测i=imread('104_8.tif');j = edge(i,'prewitt',thresh)。
- 1、下载文档前请自行甄别文档内容的完整性,平台不提供额外的编辑、内容补充、找答案等附加服务。
- 2、"仅部分预览"的文档,不可在线预览部分如存在完整性等问题,可反馈申请退款(可完整预览的文档不适用该条件!)。
- 3、如文档侵犯您的权益,请联系客服反馈,我们会尽快为您处理(人工客服工作时间:9:00-18:30)。
图像增强1. 直方图均衡化的 Matlab 实现1.1 imhist 函数功能:计算和显示图像的色彩直方图格式:imhist(I,n)imhist(X,map)说明:imhist(I,n) 其中,n 为指定的灰度级数目,缺省值为256;imhist(X,map) 就算和显示索引色图像 X 的直方图,map 为调色板。
用 stem(x,counts) 同样可以显示直方图。
1.2 imcontour 函数功能:显示图像的等灰度值图格式:imcontour(I,n),imcontour(I,v)说明:n 为灰度级的个数,v 是有用户指定所选的等灰度级向量。
1.3 imadjust 函数功能:通过直方图变换调整对比度格式:J=imadjust(I,[low high],[bottom top],gamma)newmap=imadjust(map,[low high],[bottom top],gamma)说明:J=imadjust(I,[low high],[bottom top],gamma) 其中,gamma 为校正量r,[low high] 为原图像中要变换的灰度范围,[bottom top] 指定了变换后的灰度范围;newmap=imadjust(map,[low high],[bottom top],gamma) 调整索引色图像的调色板 map 。
此时若 [low high] 和 [bottom top] 都为2×3的矩阵,则分别调整 R、G、B 3个分量。
1.4 histeq 函数功能:直方图均衡化格式:J=histeq(I,hgram)J=histeq(I,n)[J,T]=histeq(I,...)newmap=histeq(X,map,hgram)newmap=histeq(X,map)[new,T]=histeq(X,...)说明:J=histeq(I,hgram) 实现了所谓“直方图规定化”,即将原是图象 I 的直方图变换成用户指定的向量 hgram 。
hgram 中的每一个元素都在 [0,1] 中;J=histeq(I,n) 指定均衡化后的灰度级数 n ,缺省值为 64;[J,T]=histeq(I,...) 返回从能将图像 I 的灰度直方图变换成图像 J 的直方图的变换 T ;newmap=histeq(X,map) 和[new,T]=histeq(X,...) 是针对索引色图像调色板的直方图均衡。
2. 噪声及其噪声的 Matlab 实现imnoise 函数格式:J=imnoise(I,type)J=imnoise(I,type,parameter)说明:J=imnoise(I,type) 返回对图像 I 添加典型噪声后的有噪图像 J ,参数 type 和 parameter 用于确定噪声的类型和相应的参数。
3. 图像滤波的 Matlab 实现3.1 conv2 函数功能:计算二维卷积格式:C=conv2(A,B)C=conv2(Hcol,Hrow,A)C=conv2(...,'shape')说明:对于 C=conv2(A,B) ,conv2 的算矩阵 A 和 B 的卷积,若 [Ma,Na]=size(A), [Mb,Nb]=size(B), 则 size(C)=[Ma+Mb-1,Na+Nb-1]; C=conv2(Hcol,Hrow,A) 中,矩阵 A 分别与 Hcol 向量在列方向和 Hrow 向量在行方向上进行卷积;C=conv2(...,'shape') 用来指定 conv2 返回二维卷积结果部分,参数 shape 可取值如下:》full 为缺省值,返回二维卷积的全部结果;》same 返回二维卷积结果中与 A 大小相同的中间部分;valid 返回在卷积过程中,未使用边缘补 0 部分进行计算的卷积结果部分,当 size(A)>size(B) 时,size(C)=[Ma-Mb+1,Na-Nb+1]。
3.2 conv 函数功能:计算多维卷积格式:与 conv2 函数相同3.3 filter2函数功能:计算二维线型数字滤波,它与函数 fspecial 连用格式:Y=filter2(B,X)Y=filter2(B,X,'shape')说明:对于 Y=filter2(B,X) ,filter2 使用矩阵 B 中的二维 FIR 滤波器对数据 X 进行滤波,结果 Y 是通过二维互相关计算出来的,其大小与 X 一样;对于Y=filter2(B,X,'shape') ,filter2 返回的 Y 是通过二维互相关计算出来的,其大小由参数 shape 确定,其取值如下:》full 返回二维相关的全部结果,size(Y)>size(X);》same 返回二维互相关结果的中间部分,Y 与 X 大小相同;》valid 返回在二维互相关过程中,未使用边缘补 0 部分进行计算的结果部分,有 size(Y)<size(X) 。
3.4 fspecial函数功能:产生预定义滤波器格式:H=fspecial(type)H=fspecial('gaussian',n,sigma) 高斯低通滤波器H=fspecial('sobel') Sobel 水平边缘增强滤波器H=fspecial('prewitt') Prewitt 水平边缘增强滤波器H=fspecial('laplacian',alpha) 近似二维拉普拉斯运算滤波器H=fspecial('log',n,sigma) 高斯拉普拉斯(LoG)运算滤波器H=fspecial('average',n) 均值滤波器H=fspecial('unsharp',alpha) 模糊对比增强滤波器说明:对于形式 H=fspecial(type) ,fspecial 函数产生一个由 type 指定的二维滤波器 H ,返回的 H 常与其它滤波器搭配使用。
4. 彩色增强的 Matlab 实现4.1 imfilter函数功能:真彩色增强格式:B=imfilter(A,h)说明:将原始图像 A 按指定的滤波器 h 进行滤波增强处理,增强后的图像 B 与 A 的尺寸和类型相同。
图像的变换1. 离散傅立叶变换的 Matlab 实现Matlab 函数 fft、fft2 和 fftn 分别可以实现一维、二维和 N 维 DFT 算法;而函数 ifft、ifft2 和 ifftn 则用来计算反 DFT 。
这些函数的调用格式如下: A=fft(X,N,DIM)其中,X 表示输入图像;N 表示采样间隔点,如果 X 小于该数值,那么 Matlab 将会对 X 进行零填充,否则将进行截取,使之长度为 N ;DIM 表示要进行离散傅立叶变换。
A=fft2(X,MROWS,NCOLS)其中,MROWS 和 NCOLS 指定对 X 进行零填充后的 X 大小。
A=fftn(X,SIZE)其中,SIZE 是一个向量,它们每一个元素都将指定 X 相应维进行零填充后的长度。
函数 ifft、ifft2 和 ifftn的调用格式于对应的离散傅立叶变换函数一致。
例子:图像的二维傅立叶频谱% 读入原始图像I=imread('lena.bmp');imshow(I)% 求离散傅立叶频谱J=fftshift(fft2(I));figure;imshow(log(abs(J)),[8,10])2. 离散余弦变换的 Matlab 实现2.1. dct2 函数功能:二维 DCT 变换格式:B=dct2(A)B=dct2(A,m,n)B=dct2(A,[m,n])说明:B=dct2(A) 计算 A 的 DCT 变换 B ,A 与 B 的大小相同;B=dct2(A,m,n) 和B=dct2(A,[m,n]) 通过对 A 补 0 或剪裁,使 B 的大小为m×n。
2.2. dict2 函数功能:DCT 反变换格式:B=idct2(A)B=idct2(A,m,n)B=idct2(A,[m,n])说明:B=idct2(A) 计算 A 的 DCT 反变换 B ,A 与 B 的大小相同;B=idct2(A,m,n) 和 B=idct2(A,[m,n]) 通过对 A 补 0 或剪裁,使 B 的大小为m×n。
2.3. dctmtx函数功能:计算 DCT 变换矩阵格式:D=dctmtx(n)说明:D=dctmtx(n) 返回一个n×n 的 DCT 变换矩阵,输出矩阵 D 为 double 类型。
3. 图像小波变换的 Matlab 实现3.1 一维小波变换的 Matlab 实现(1) dwt 函数功能:一维离散小波变换格式:[cA,cD]=dwt(X,'wname')[cA,cD]=dwt(X,Lo_D,Hi_D)说明:[cA,cD]=dwt(X,'wname') 使用指定的小波基函数 'wname' 对信号 X 进行分解,cA、cD 分别为近似分量和细节分量;[cA,cD]=dwt(X,Lo_D,Hi_D) 使用指定的滤波器组Lo_D、Hi_D 对信号进行分解。
(2) idwt 函数功能:一维离散小波反变换格式:X=idwt(cA,cD,'wname')X=idwt(cA,cD,Lo_R,Hi_R)X=idwt(cA,cD,'wname',L)X=idwt(cA,cD,Lo_R,Hi_R,L)说明:X=idwt(cA,cD,'wname') 由近似分量 cA 和细节分量 cD 经小波反变换重构原始信号 X 。
'wname' 为所选的小波函数X=idwt(cA,cD,Lo_R,Hi_R) 用指定的重构滤波器 Lo_R 和 Hi_R 经小波反变换重构原始信号 X 。
X=idwt(cA,cD,'wname',L) 和 X=idwt(cA,cD,Lo_R,Hi_R,L) 指定返回信号X 中心附近的 L 个点。
3.2 二维小波变换的 Matlab 实现二维小波变换的函数-------------------------------------------------函数名函数功能---------------------------------------------------dwt2 二维离散小波变换wavedec2 二维信号的多层小波分解idwt2 二维离散小波反变换waverec2 二维信号的多层小波重构wrcoef2 由多层小波分解重构某一层的分解信号upcoef2 由多层小波分解重构近似分量或细节分量detcoef2 提取二维信号小波分解的细节分量appcoef2 提取二维信号小波分解的近似分量upwlev2 二维小波分解的单层重构dwtpet2 二维周期小波变换idwtper2 二维周期小波反变换-------------------------------------------------------------(1) wcodemat 函数功能:对数据矩阵进行伪彩色编码格式:Y=wcodemat(X,NB,OPT,ABSOL)Y=wcodemat(X,NB,OPT)Y=wcodemat(X,NB)Y=wcodemat(X)说明:Y=wcodemat(X,NB,OPT,ABSOL) 返回数据矩阵 X 的编码矩阵 Y ;NB 伪编码的最大值,即编码范围为 0~NB,缺省值 NB=16;OPT 指定了编码的方式(缺省值为 'mat'),即:OPT='row' ,按行编码OPT='col' ,按列编码OPT='mat' ,按整个矩阵编码ABSOL 是函数的控制参数(缺省值为 '1'),即:ABSOL=0 时,返回编码矩阵ABSOL=1 时,返回数据矩阵的绝对值 ABS(X)(2) dwt2 函数功能:二维离散小波变换格式:[cA,cH,cV,cD]=dwt2(X,'wname')[cA,cH,cV,cD]=dwt2(X,Lo_D,Hi_D)说明:[cA,cH,cV,cD]=dwt2(X,'wname')使用指定的小波基函数 'wname' 对二维信号X 进行二维离散小波变幻;cA,cH,cV,cD 分别为近似分量、水平细节分量、垂直细节分量和对角细节分量;[cA,cH,cV,cD]=dwt2(X,Lo_D,Hi_D) 使用指定的分解低通和高通滤波器Lo_D 和 Hi_D 分解信号 X 。