Categories and Subject Descriptors
IE论文——精选推荐

A virtual network laboratory for learning IP networkingLluís FàbregaJordi MassaguerTeodor JovéDavid MéridaInstitut d’Informàtica i Aplicacions (IIiA)Universitat de Girona (UdG)Lluís Santaló Av., 17071 Girona, SPAIN+34 972418475{ fabrega | jmassa | teo | dmerida }@eia.udg.esABSTRACTIn this paper, a network laboratory for distance learning of basic concepts in IP networking is presented. Through a web interface,students can choose various configurations of a real private network (number of routers and subnetworks, use of IPv4/IPv6,etc.), and learn about them using Linux network commands. The utilization of the virtual laboratory and how it is implemented are described.Categories and Subject DescriptorsK.3.1 [Computers and Education ]: Computer uses in education–distance learning.General TermsDesign, Experimentation.KeywordsRemote laboratory, networking.1. INTRODUCTIONThe possibilities offered by the use of Internet in teaching activities are increasingly important. However, the physical presence of students in laboratories is required when the subject has a practical component, and this makes distance learning more difficult. Virtual laboratories can be used to overcome this situation.We have built a virtual network laboratory for distance learning of IP networking concepts such as IP addressing, routing tables,address resolution between IP and Ethernet, and the combined use of IPv4 and IPv6. Students access the virtual laboratory through a web interface and can change the network configuration by choosing one of the available preset configurations. Then, using Linux network commands, they can learn about these configurations and how to test the network.The virtual network laboratory is a private IP over an Ethernet network. It consists of several PCs (with one or more Ethernet cards) connected through a configurable Ethernet switch. One ofthese PCs, which is connected to the Internet, runs the web server and performs the different network configurations upon receiving a student’s request.The paper is organized as follows. In section 2 we describe the user interface of the virtual laboratory and some examples of lab classes to show how it can be used. Section 3 deals with the implementation of the virtual laboratory, the composition of the physical network and the remote configuration method used for the switch and for IPv4 and IPv6 in the PCs. Conclusions and future work conclude the paper.2. LEARNING IN THE VIRTUAL LABThe virtual network uses IP over an Ethernet and consists of four nodes. These nodes can be grouped to build IP subnetworks in different topologies, so they act as a host or router depending on the topology. The student can choose between four available topologies (see Figure 1).Our objective was to build a tool whereby remote students could learn the basic concepts of IP networking and related Linux network commands. We want them to learn the following:-IP addresses within an IP subnetwork share a common prefix that defines the subnetwork address.-The composition of the routing tables in hosts and routers,which defines the next node to send a packet depending on the IP subnetwork where the destination host belongs.Permission to make digital or hard copies of all or part of this work for personal or classroom use is granted without fee provided that copies are not made or distributed for profit or commercial advantage and that copies bear this notice and the full citation on the first page. To copy otherwise, or republish, to post on servers or to redistribute to lists,requires prior specific permission and/or a fee.ITiCSE’02, June 24-26, 2002, Aarhus, DenmarkCopyright 2002 ACM 1-58113-499-1/02/0006…$5.00.Figure 1. The configured network topologies.host routerD subnet A BCDsubnet subnet C A B 12B subnet subnet subnetC A D34Dsubnet subnet subnet B C A-Address resolution between Ethernet and IP.-The main differences between the addressing scheme in IPv4 and IPv6.-The issues derived from the combined utilization of IPv6and IPv4, and the need for tunneling that allows hosts to send IPv6 packets through IPv4 networks.-The Linux commands for network administration such as ifconfig for interface addressing, route for the routing tables,traceroute for the routing path between two nodes, ping for checking connectivity, arp for the address resolution table,and others.In a lab class the student first chooses one of the available network configurations and then studies it by using Linux network commands. Section 2.1 describes the user interface and section 2.3 shows some examples of lab classes.2.1 The user interfaceStudents access the virtual laboratory through a web interface after an authentication phase. Then they choose one of the following options, “topologies”, “protocols”, “tunneling”,“commands” or “exit”:-The “topologies” option allows the student to choose one of several network topologies that differ in the number of IP subnetworks (1, 2 or 3) and therefore in the number of routers (see Figure 1).-Using “protocols”, the student can choose to configure each network node either with only IPv4 or with both IPv4 and IPv6. Predefined addresses are assigned to each node.-Using “tunneling”, the student can choose one of several network configurations where some nodes use IPv4 and others IPv6, which have configured the required tunnels to work properly (see Figure 2).-With “commands”, the student can choose any of the nodes of the network and then study how it is configured by using Linux network commands. The student is not allowed to change any configuration parameter, but can test it.2.2 Some examples of lab classesThe basic scheme of a lab class is first to choose one of the network configurations using the appropriate options (“topology”,“protocols”, and “tunneling”), and second, to study it using Linux network commands (“commands” option).A first example is the study of IP addressing and routing tables using the 4th topology in Figure 1 (three subnetworks and one router) with IPv4 in all the nodes. This results in the configuration of IP addresses and the routing table in each node. Then, using the ifconfig command, students can see the IP addressing used, by using route , the contents of the routing table, and by using traceroute , the routing path between two nodes.A second example is the study of the address resolution between IP and Ethernet using the third topology in Figure 1 (three subnetworks and two routers) with IPv4 in all nodes. The use of arp in each node allows the student to see the contents of the ARP (Address Resolution Protocol) table listing IP and Ethernet addresses. Other commands like ping , traceroute , or route , would be also interesting for studying the configuration.The third example is the study of the combined use of IPv4 and IPv6 nodes. Here the chosen topology is the third one in Figure 1,IPv4 in the B and C nodes and IPv4/IPv6 in the A and D nodes.First, no tunnel configuration is selected. Then, students can see that there is no virtual interface created in the A and D nodes by using the ifconfig command, that the routing table is wrong by using route , and that there is no connectivity between the A and D nodes by using ping . After that, the tunnel configuration number 2(see Figure 2) is chosen and the network configuration is tested again to check the right behavior.3. IMPLEMENTATION 3.1 EquipmentThe network of the virtual laboratory consists of four PCs running the Linux operating system (kernel 2.2.12-20, RedHat 6.1distribution) and an Ethernet switch (Cisco Catalyst 2920XL with 24 ports). Each PC has one or more Ethernet cards connected to the switch as shown in Figure 3. It is a private network that is accessed from the Internet through the node A, which has two Ethernet cards, one connected to the private network and the other to the Internet. Node A does not forward packets from or to the private network and the Internet.The Ethernet switch is used to build the subnetworks of each topology. Through its configuration, each switch port is assignedFigure 2. The configured tunnels.123Figure 3. The physical network and the groups of portsfor the third topology.ABCDEthernet switchto a specific group of ports. The different groups are isolated, i.e. the switch does not provide connectivity between two nodes that belong to different groups of ports. In this way, “virtual” Ethernet subnetworks are built, as if the nodes of each subnetwork were physically connected to different Ethernet switches. The groups of ports for creating the third topology (see Figure 1) are shown in Figure 3.3.2The remote configurationThe remote configuration of the PCs and the Ethernet switch is made through a web server (Apache release 1.3.9 [1]) running in node A. Using a CGI (Common Gateway Interface), the web server executes different UNIX scripts files. In turn these scripts execute a Telnet client that connects to the Telnet server running in the target device (PC or switch), and then executes the necessary commands to configure it. The script files use the expect scripts language [2] that allows CGIs to interact with the Telnet client, so an interpreter of this language needs to be installed in node A. This is the usual method for the configuration. The next sections focus on the configuration of the switch and the nodes.3.3The switch configuration and topologies The four different network topologies (see Figure 1) are built by configuring the (virtual) subnetworks in the switch. The number of subnetworks varies from one to three, as does the number of hosts that belong to a subnetwork. Note that only one of the two interfaces of node A can belong to the different network topologies, while the other interface is always connected to the Internet.The switch configuration is made via Telnet by using some specific commands [4] for assigning ports to (virtual) subnetworks. As explained in section 3.2, this is carried out by expect scripts files, which use these commands for each configuration. An example file is shown in Figure 4. First a Telnet session is initiated and then the commands for assigning ports to subnetworks are executed.3.4IPv4 and IPv6 in the nodesThe user can choose a topology and the IP protocol version for each node, i.e. only IPv4 or both IPv4 and IPv6 (there are no only IPv6 nodes). IPv4 is the default option. According to the selected option and topology, a predefined IP address (IPv4 and/or IPv6) is assigned to each network interface of the node depending on the subnetwork it belongs to. The corresponding routing table of the node is then configured. Moreover, nodes with interfaces in different subnetworks act as IP routers, so packet forwarding must be enabled in them.Linux systems configure network aspects at the boot time by executing several UNIX scripts files and using the information written in several configuration files [3]. All nodes are dual, i.e. both IP versions are installed on them. In order to configure IPv6, we have added some specific UNIX script files and configuration files [5], which are the equivalents to the installed files for IPv4. The configuration files for IPv4 are the following: ifcfg-eth0, for information about the Ethernet interface 0, such as the assigned IPv4 address (and the corresponding files for each interface); the file static-routes, for adding static routes to the routing table; the file network, for enabling or disabling networking and forwarding; the file hosts, with the table that relates DNS names and IP addresses. Network configuration is made at the boot time by executing the script network.The configuration files for IPv6 are the following: network-ip6, for enabling or disabling networking and forwarding, and also for defining the files names where there is the information about the interfaces, the routing and the tunnels; the file network-ip6.conf (or the file name defined in network-ip6), for the interfaces (equivalent to ifcfg-ethx files in IPv4) and for the static routes of the routing table (equivalent to the static-route file in IPv4); the file tunnels.conf (or the file name defined in network-ip6) for setting up virtual interfaces that define the IPv6/IPv4 tunnels (see next section); the file hosts, with the table relating Domain Name Services (DNS) names and IPv6 addresses (the same file as in IPv4). Network configuration is performed at the boot time by executing the script network-ip6.init.For each one of the different PCs’ configurations we have created the corresponding specific files. For example, for the file ifcfg-eth0, we have created the files 1.ifcfg-eth0, 2.ifcfg-eth0 and 3.ifcfg-eth0, corresponding to network topologies 1, 2 and 3 respectively, and using IPv4. Remote configuration is performed by replacing these files (e.g., ifcfg-eth0 by 1.ifcfg-eth0), and then enforcing the system to a network reconfiguration (e.g., executing the script network). As explained in section 3.2, this is done through expect scripts via Telnet.3.5IPv4 and IPv6 interconnectionIn order to provide connectivity between IPv6 nodes through a path that involves IPv4 nodes, it is necessary to set up tunnels between them, i.e. IPv6 packets are encapsulated in IPv4 packets and IPv6 addresses are mapped to IPv4 addresses at the sending point [6]. This operation is undone at the receiving point. Tunnels are created between two nodes by configuring a network virtual interface at both ends. The interface encapsulates and sends the packets to a real interface (i.e. eth0), and it is used in the IPv6 routing tables for a specific route. In Figure 2 three examples of tunnels are shown:-In the first one, there are three IPv6 subnetworks and two IPv6 routers. The second subnetwork uses IPv6 over IPv4.A tunnel is created between theB andC routers for therouting path that connects the first and the third subnetworks.-In the second example there is a single IPv6 subnetwork with IPv6 over IPv4. A tunnel is created between the A andD hosts.-In the third example there are three IPv6 subnetworks and two IPv6 routers. The first subnetwork uses IPv6 over IPv4.A tunnel is created between A andB for the routing paththat connects the first subnetwork with the other ones.3.6Remote commands executionOur platform allows the students to execute commands in a remote way at any of the nodes, such as ifconfig, route,and traceroute. These commands are executed in a Telnet session as a non-root user using expect scripts. As mentioned in section 2.1, students can test any configuration parameter but they are not allowed to change them.4.CONCLUSIONS AND FUTURE WORK We have built a virtual network laboratory for learning basic concepts of IP networking and have shown how students can use it. Using a web interface, students can choose one of the available configurations and study them by using (and learning) the main Linux network commands.There are several areas for future work. One is to allow students not only to choose and study predefined configurations, but also to build it on demand. In this way students would create their own topologies, assign IP addresses, and configure the routing tables (graphically and/or through Linux commands).Another interesting possibility is using the Simple Network Management Protocol (SNMP) for configuration of the network laboratory. We are also planning to add an enhanced user management (e.g. session scheduling, the ability of saving the configuration for recovery in a future session), and a network monitor for capturing Ethernet packets in order to study TCP/IP protocols, such as e-mail, web, DNS and others.5.ACKNOWLEDGMENTSThis study was partially supported by the CICYT (Spanish Education Ministry) contract TEL-98-0408-C02-01 and the Acciones Integradas program ref. HI1998-0032.6.REFERENCES[1]The Apache Software Foundation. HTTP Apache Server,[2]Don Libes. Exploring Expect: A Tcl-Based Toolkit forAutomating Interactive Programs. O’Reilly and Associates(1995)[3]Richard Petersen. Linux - Manual de Referencia.Osborne/MacGraw-Hill (1997)[4]Cisco Systems, Inc. Cisco IOS Desktop Switching SoftwareConfiguration Guide – Catalyst 2900 Series XL Cisco IOSRelease 11.2(8)SA6 (1999)[5]Peter Bieringer. Linux: IPv6.http://www.bieringer.de/linux/IPv6/index.html[6]Christian Huitema. IPv6 – The new Internet Protocol.Prentice Hall (1998)。
MeSH词专帖

MeSH词专帖熟悉pubmed的站友想必已经了解到MeSH词的价值了,不熟悉它的站友也很有必要进行学习,以使检索结果更符合自己的要求,同时提高自己的检索水平。
**内讨论MeSH词的帖子虽然不少,但还没发现哪个帖子对它进行全面详细的介绍,对已有的资源进行整合,因此,在检索版开设此帖,介绍这方面的知识,汇集相关资源,讨论与MeSH有关的疑问,共同把这帖建好,共同学习共同提高吧。
Medical Subject Headings (MeSH) 简介MeSH的应用美国国家医学图书馆(National Library of Medicine;简称NLM)于1954年首次正式出版标题表Subject Heading Authority List;1960年由于Index Medicus的发行,全新的医学标题表(Medical Subject Headings;简称M e S H)也随之出版。
MeSH是NLM用以分析生物医学方面之期刊文献、图书、视听数据、电子资源等资源的主题内容之控制语汇表,亦为NLM出版之MEDLINE/PubMED数据库主题检索的索引典。
MeSH的语汇结构MeSH的语汇包括几种类型:Descriptors、Qualifiers、Publication Types、Geogr aphics及Cross-References,兹分别说明如下:一、Descriptors:即主标目(main headings),是用以描述主题或内容特性的Me SH 语汇。
二、Qualifiers:与Descriptors配合使用的副标目(subheadings),MeSH的副标目只有一种,即主题副标目(topical qualifiers)。
一般而言,同一个主标目所连用的主题副标目不会超过三个,若超过三个主题副标目,则采用单独的主标目即可。
或者可参考Topical Subheading Hierarchies以减少主题副标目的数量,例如:讨论某个疾病的diagnosis、therapy、epidemiology、mortality的数据,可以用该疾病的主标目与diagnosis、therapy、epidemiology三个主题副标目连用,但不适合与mortality连用,因为在Topical Subheading Hierarchies中mortality属于epid emiology的次阶层主题副标目。
基于屏幕空间的泊松表面重建
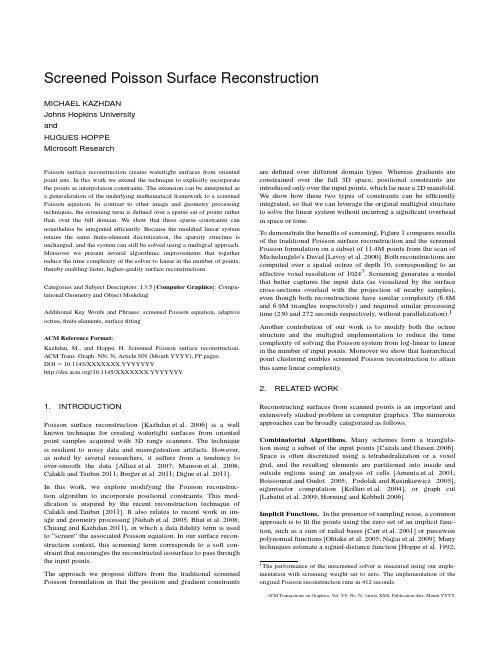
Screened Poisson Surface ReconstructionMICHAEL KAZHDANJohns Hopkins UniversityandHUGUES HOPPEMicrosoft ResearchPoisson surface reconstruction creates watertight surfaces from oriented point sets.In this work we extend the technique to explicitly incorporate the points as interpolation constraints.The extension can be interpreted as a generalization of the underlying mathematical framework to a screened Poisson equation.In contrast to other image and geometry processing techniques,the screening term is defined over a sparse set of points rather than over the full domain.We show that these sparse constraints can nonetheless be integrated efficiently.Because the modified linear system retains the samefinite-element discretization,the sparsity structure is unchanged,and the system can still be solved using a multigrid approach. Moreover we present several algorithmic improvements that together reduce the time complexity of the solver to linear in the number of points, thereby enabling faster,higher-quality surface reconstructions.Categories and Subject Descriptors:I.3.5[Computer Graphics]:Compu-tational Geometry and Object ModelingAdditional Key Words and Phrases:screened Poisson equation,adaptive octree,finite elements,surfacefittingACM Reference Format:Kazhdan,M.,and Hoppe,H.Screened Poisson surface reconstruction. ACM Trans.Graph.NN,N,Article NN(Month YYYY),PP pages.DOI=10.1145/XXXXXXX.YYYYYYY/10.1145/XXXXXXX.YYYYYYY1.INTRODUCTIONPoisson surface reconstruction[Kazhdan et al.2006]is a well known technique for creating watertight surfaces from oriented point samples acquired with3D range scanners.The technique is resilient to noisy data and misregistration artifacts.However, as noted by several researchers,it suffers from a tendency to over-smooth the data[Alliez et al.2007;Manson et al.2008; Calakli and Taubin2011;Berger et al.2011;Digne et al.2011].In this work,we explore modifying the Poisson reconstruc-tion algorithm to incorporate positional constraints.This mod-ification is inspired by the recent reconstruction technique of Calakli and Taubin[2011].It also relates to recent work in im-age and geometry processing[Nehab et al.2005;Bhat et al.2008; Chuang and Kazhdan2011],in which a datafidelity term is used to“screen”the associated Poisson equation.In our surface recon-struction context,this screening term corresponds to a soft con-straint that encourages the reconstructed isosurface to pass through the input points.The approach we propose differs from the traditional screened Poisson formulation in that the position and gradient constraints are defined over different domain types.Whereas gradients are constrained over the full3D space,positional constraints are introduced only over the input points,which lie near a2D manifold. We show how these two types of constraints can be efficiently integrated,so that we can leverage the original multigrid structure to solve the linear system without incurring a significant overhead in space or time.To demonstrate the benefits of screening,Figure1compares results of the traditional Poisson surface reconstruction and the screened Poisson formulation on a subset of11.4M points from the scan of Michelangelo’s David[Levoy et al.2000].Both reconstructions are computed over a spatial octree of depth10,corresponding to an effective voxel resolution of10243.Screening generates a model that better captures the input data(as visualized by the surface cross-sections overlaid with the projection of nearby samples), even though both reconstructions have similar complexity(6.8M and6.9M triangles respectively)and required similar processing time(230and272seconds respectively,without parallelization).1 Another contribution of our work is to modify both the octree structure and the multigrid implementation to reduce the time complexity of solving the Poisson system from log-linear to linear in the number of input points.Moreover we show that hierarchical point clustering enables screened Poisson reconstruction to attain this same linear complexity.2.RELA TED WORKReconstructing surfaces from scanned points is an important and extensively studied problem in computer graphics.The numerous approaches can be broadly categorized as follows. Combinatorial Algorithms.Many schemes form a triangula-tion using a subset of the input points[Cazals and Giesen2006]. Space is often discretized using a tetrahedralization or a voxel grid,and the resulting elements are partitioned into inside and outside regions using an analysis of cells[Amenta et al.2001; Boissonnat and Oudot2005;Podolak and Rusinkiewicz2005], eigenvector computation[Kolluri et al.2004],or graph cut [Labatut et al.2009;Hornung and Kobbelt2006].Implicit Functions.In the presence of sampling noise,a common approach is tofit the points using the zero set of an implicit func-tion,such as a sum of radial bases[Carr et al.2001]or piecewise polynomial functions[Ohtake et al.2005;Nagai et al.2009].Many techniques estimate a signed-distance function[Hoppe et al.1992; 1The performance of the unscreened solver is measured using our imple-mentation with screening weight set to zero.The implementation of the original Poisson reconstruction runs in412seconds.ACM Transactions on Graphics,V ol.VV,No.N,Article XXX,Publication date:Month YYYY.2•M.Kazhdan and H.HoppeFig.1:Reconstruction of the David head ‡,comparing traditional Poisson surface reconstruction (left)and screened Poisson surface reconstruction which incorporates point constraints (center).The rightmost diagram plots pixel depth (z )values along the colored segments together with the positions of nearby samples.The introduction of point constraints significantly improves fit accuracy,sharpening the reconstruction without amplifying noise.Bajaj et al.1995;Curless and Levoy 1996].If the input points are unoriented,an important step is to correctly infer the sign of the resulting distance field [Mullen et al.2010].Our work extends Poisson surface reconstruction [Kazhdan et al.2006],in which the implicit function corresponds to the model’s indicator function χ.The function χis often defined to have value 1inside and value 0outside the model.To simplify the derivations,inthis paper we define χto be 12inside and −12outside,so that its zero isosurface passes near the points.The function χis solved using a Laplacian system discretized over a multiresolution B-spline basis,as reviewed in Section 3.Alliez et al.[2007]form a Laplacian system over a tetrahedral-ization,and constrain the solution’s biharmonic energy;the de-sired function is obtained as the solution to an eigenvector prob-lem.Manson et al.[2008]represent the indicator function χusing a wavelet basis,and efficiently compute the basis coefficients using simple local sums over an adapted octree.Calakli and Taubin [2011]optimize a signed-distance function to have value zero at the points,have derivatives that agree with the point normals,and minimize a Hessian smoothness norm.The resulting optimization involves a bilaplacian operator,which requires estimating derivatives of higher order than in the Laplacian.The reconstructed surfaces are shown to have good accuracy,strongly suggesting the importance of explicitly fitting the points within the optimization.This motivated us to explore whether a Laplacian system could be extended in this respect,and also be compatible with a multigrid solver.Screened Poisson Surface Fitting.The method of Nehab et al.[2005],which simultaneously fits position and normal constraints,may also be viewed as the solution of a screened Poisson equation.The fitting algorithm assumes that a 2D parametric domain (i.e.,a plane or triangle mesh)is already established.The position and derivative constraints are both defined over this 2D domain.In contrast,in Poisson surface reconstruction the 2D domain manifold is initially unknown,and therefore the goal is to infer anindicator function χrather than a parametric function.This leadsto a hybrid problem with derivative (Laplacian)constraints defined densely over 3D and position constraints defined sparsely on the set of points sampled near the unknown 2D manifold.3.REVIEW OF POISSON SURFACE RECONSTRUCTIONThe approach of Poisson surface reconstruction is based on the observation that the (inward pointing)normal field of the boundary of a solid can be interpreted as the gradient of the solid’s indicator function.Thus,given a set of oriented points sampling the boundary,a watertight mesh can be obtained by (1)transforming the oriented point samples into a continuous vector field in 3D,(2)finding a scalar function whose gradients best match the vector field,and (3)extracting the appropriate isosurface.Because our work focuses primarily on the second step,we review it here in more detail.Scalar Function Fitting.Given a vector field V :R 3→R 3,thegoal is to solve for the scalar function χ:R 3→R minimizing:E (χ)=∇χ(p )− V (p ) 2d p .(1)Using the Euler-Lagrange formulation,the minimum is obtainedby solving the Poisson equation:∆χ=∇· V .System Discretization.The Galerkin formulation is used totransform this into a finite-dimensional system [Fletcher 1984].First,a basis {B 1,...,B N }:R 3→R is chosen,namely a collection of trivariate (usually triquadratic)B-spline functions.With respect to this basis,the discretization becomes:∆χ,B i [0,1]3= ∇· V ,B i [0,1]31≤i ≤Nwhere ·,· [0,1]3is the standard inner-product on the space of(scalar-and vector-valued)functions defined on the unit cube:F ,G [0,1]3=[0,1]3F (p )·G (p )d p , U , V [0,1]3=[0,1]3U (p ), V (p ) d p .Since the solution is itself expressed in terms of the basis functions:χ(p )=N∑i =1x i B i (p ),ACM Transactions on Graphics,V ol.VV ,No.N,Article XXX,Publication date:Month YYYY .1.离散化->连续2.找个常量函数最佳拟合这些这些向量域;3.抽取等值面这里已经将离散的有向点转化为了连续的向量域表示;点集合的最初的思考Screened Poisson Surface Reconstruction•3finding the coefficients{x i}of the solution reduces to solving the linear system Ax=b where:A i j= ∇B i,∇B j [0,1]3and b i= V,∇B i [0,1]3.(2) The basis functions{B1,...,B N}are chosen to be compactly supported,so most pairs of functions do not have overlapping support,and thus the matrix A is sparse.Because the solution is expected to be smooth away from the input samples,the linear system is discretized byfirst adapting an octree to the input samples and then associating an(appropriately scaled and translated)trivariate B-spline function to each octree node. This provides high-resolution detail in the vicinity of the surface while reducing the overall dimensionality of the system.System Solution.Given the hierarchy defined by an octree of depth D,a multigrid approach is used to solve the linear system. The basis functions are partitioned according to the depths of their associated nodes and,for each depth d,a linear system A d x d=b d is defined using the corresponding B-splines{B d1,...,B d Nd},such thatχ(p)=∑D d=0∑i x d i B d i(p).Because the octree-selected B-spline functions do not form a complete grid at each depth,it is generally not possible to prolong the solution x d at depth d into the solution x d+1at depth d+1. (The B-spline associated with a given node is a sum of B-spline functions associated not only with its own child nodes,but also with child nodes of its neighbors.)Instead,the constraints at depth d+1are adjusted to account for the part of the solution already realized at coarser depths.Pseudocode for a cascadic solver,where the solution is only relaxed on the up-stroke of the V-cycle,is given in Algorithm1.Algorithm1:Cascadic Poisson Solver1For d∈{0,...,D}Iterate from coarse tofine2For d ∈{0,...,d−1}Remove the constraints3b d=b d−A dd x d met at coarser depths4Relax A d x d=b d Adjust the system at depth dHere,A dd is the N d×N d matrix used to transform solution coefficients at depth d into constraints at depth d:A dd i j= ∇B d i,∇B d j [0,1]3.Note that,by definition,A d=A dd.Isosurface Extraction.Solving the Poisson equation,one obtains a functionχthat approximates the indicator function.Ideally,the function’s zero level-set should therefore correspond to the desired surface.In practice however,the functionχcan differ from the true indicator function due to several sources of error:—The point sampling may be noisy,possibly containing outliers.—The Galerkin discretization is only an approximation of the continuous problem.—The point sampling density is approximated during octree construction.To mitigate these errors,in[Kazhdan et al.2006]the implicit function is adjusted by globally subtracting the average value of the function at the input samples.4.INCORPORA TING POINT CONSTRAINTSThe original Poisson surface reconstruction algorithm adjusts the implicit function using a single global offset such that its average value at all points is zero.However,the presence of errors can cause the implicit function to drift so that no global offset is satisfactory. Instead,we seek to explicitly interpolate the points.Given the set of input points P with weights w:P→R≥0,we add to the energy of Equation1a term that penalizes the function’s deviation from zero at the samples:E(χ)=V(p)−∇χ(p) 2d p+α·Area(P)∑p∈P∑p∈Pw(p)χ2(p)(3)whereαis a weight that trades off the importance offitting the gradients andfitting the values,and Area(P)is the area of the reconstructed surface,estimated by computing the local sampling density as in[Kazhdan et al.2006].In our implementation,we set the per-sample weights w(p)=1,although one can also use confidence values if these are available.The energy can be expressed concisely asE(χ)= V−∇χ, V−∇χ [0,1]3+α χ,χ (w,P)(4)where ·,· (w,P)is the bilinear,symmetric,positive,semi-definite form on the space of functions in the unit-cube,obtained by taking the weighted sum of function values:F,G (w,P)=Area(P)∑p∈P w(p)∑p∈Pw(p)·F(p)·G(p).4.1Interpretation as a Screened Poisson EquationThe energy in Equation4combines a gradient constraint integrated over the spatial domain with a value constraint summed at discrete points.As shown in the appendix,its minimization can be interpreted as a screened Poisson equation(∆−α˜I)χ=∇· V with an appropriately defined operator˜I.4.2DiscretizationWe apply a discretization similar to that in Section3to the minimization of the energy in Equation4.The coefficients of the solutionχwith respect to the basis{B1,...,B N}are again obtained by solving a linear system of the form Ax=b.The right-hand-side b is unchanged because the constrained value at the sample points is zero.Matrix A now includes the point constraints:A i j= ∇B i,∇B j [0,1]3+α B i,B j (w,P).(5) Note that incorporating the point constraints does not change the sparsity of matrix A because B i(p)·B j(p)is nonzero only if the supports of the two functions overlap,in which case the Poisson equation has already introduced a nonzero entry in the matrix.As in Section3,we solve this linear system using a cascadic multigrid algorithm–iterating over the octree depths from coarsest tofinest,adjusting the constraints,and relaxing the system.Similar to Equation5,the matrix used to transform a solution at depth d to a constraint at depth d is expressed as:A dd i j= ∇B d i,∇B d j [0,1]3+α B d i,B d j (w,P).ACM Transactions on Graphics,V ol.VV,No.N,Article XXX,Publication date:Month YYYY.4•M.Kazhdan and H.HoppeFig.2:Visualizations of the reconstructed implicit function along a planar slice through the cow ‡(shown in blue on the left),for the original Poisson solver,and for the screened Poisson solver without and with scale-independent screening.This operator adjusts the constraint b d (line 3of Algorithm 1)not only by removing the Poisson constraints met at coarser resolutions,but also by modifying the constrained values at points where the coarser solution does not evaluate to zero.4.3Scale-Independent ScreeningTo balance the two energy terms in Equation 3,it is desirable to adjust the screening parameter αsuch that (1)the reconstructed surface shape is invariant under scaling of the input points with respect to the solver domain,and (2)the prolongation of a solution at a coarse depth is an accurate estimate of the solution at a finer depth in the cascadic multigrid approach.We achieve both these goals by adjusting the relative weighting of position and gradient constraints across the different octree depths.Noting that the magnitude of the gradient constraint scales with resolution,we double the weight of the interpolation constraint with each depth:A ddi j = ∇B d i ,∇B dj [0,1]3+2d α B d i ,B dj (w ,P ).The adaptive weight of 2d is chosen to keep the Laplacian and screening constraints around the surface in balance.To see this,assume that the points are locally planar,and consider the row of the system matrix corresponding to an octree node overlapping the points.The coefficients of the system in that row are the sum of Laplacian and screening terms.If we consider the rows corresponding to the child nodes that overlap the surface,we find that the contribution from the Laplacian constraints scales by a factor of 1/2while the contribution from the screening term scales by a factor of 1/4.2Thus,scaling the screening weights by a factor of two with each resolution keeps the two terms in balance.Figure 2shows the benefit of scale-independent screening in reconstructing a cow model.The leftmost image shows a plane passing through the bounding cube of the cow,and the images to the right show the values of the computed indicator function along that plane,for different implementations of the solver.As the figure shows,the unscreened Poisson solver provides a good approximation of the indicator functions,with values inside (resp.outside)the surface approximately 1/2(resp.-1/2).However,applying the same solver to the screened Poisson equation (second from right)provides a solution that is only correct near the input samples and returns to zero near the faces of the bounding cube,2Forthe Laplacian term,the Laplacian scales by a factor of 4with refinement,and volumetric integrals scale by a factor of 1/8.For the screening term,area integrals scale by a factor of 1/4.potentially resulting in spurious surface sheets away from the surface.It is only with scale-independent screening (right)that we obtain a high-quality solution to the screened Poisson ing this resolution adaptive weighting,our system has the property that the reconstruction obtained by solving at depth D is identical to the reconstruction that would be obtained by scaling the point set by 1/2and solving at depth D +1.To see this,we consider the two energies that guide the reconstruc-tion,E V (χ)measuring the extent to which the gradients of the so-lution match the prescribed vector field,and E (w ,P )(χ)measuring the extent to which the solution meets the screening constraint:E V (χ)=V (p )−∇χ(p )2d p E (w ,P )(χ)=Area (P )∑p ∈P w (p )∑p ∈Pw (p )χ2(p ).Scaling by 1/2,we obtain a new point set (˜w ,˜P)with positions scaled by 1/2,unchanged weights,˜w (p )=w (2p ),and scaled area,Area (˜P )=Area (P )/4;a new scalar field,˜χ(p )=χ(2p );and a new vector field,˜ V (p )=2 V (2p ).Computing the correspondingenergies,we get:E ˜ V (˜χ)=1E V(χ)and E (˜w ,˜P )(˜χ)=1E (w ,P )(χ).Thus,scaling the screening weight by a factor of two with eachsuccessive depth ensures that the sum of energies is unchanged (up to multiplication by a constant)so the minimizer remains the same.4.4Boundary ConditionsIn order to define the linear system,it is necessary to define the behavior of the function space along the boundary of the integration domain.In the original Poisson reconstruction the authors imposed Dirichlet boundary conditions,forcing the implicit function to havea value of −12along the boundary.In the present work we extend the implementation to support Neumann boundary conditions as well,forcing the normal derivative to be zero along the boundary.In principle these two boundary conditions are equivalent for watertight surfaces,since the indicator function has a constant negative value outside the model.However,in the presence of missing data we find Neumann constraints to be less restrictive because they only require that the implicit function have zero derivative across the boundary of the integration domain,a property that is compatible with the gradient constraint since the guiding vector field V is set to zero away from the samples.(Note that when the surface does cross the boundary of the domain,the Neumann boundary constraints create a bias to crossing the domain boundary orthogonally.)Figure 3shows the practical implications of this choice when reconstructing the Angel model,which was only scanned from the front.The left image shows the original point set and the reconstructions using Dirichlet and Neumann boundary conditions are shown to the right.As the figure shows,imposing Dirichlet constraints creates a water-tight surface that closes off before reaching the boundary while using Neumann constraints allows the surface to extend out to the boundary of the domain.ACM Transactions on Graphics,V ol.VV ,No.N,Article XXX,Publication date:Month YYYY .Screened Poisson Surface Reconstruction•5Fig.3:Reconstructions of the Angel point set‡(left)using Dirichlet(center) and Neumann(right)boundary conditions.Similar results can be seen at the bases of the models in Figures1 and4a,with the original Poisson reconstructions obtained using Dirichlet constraints and the screened reconstructions obtained using Neumann constraints.5.IMPROVED ALGORITHMIC COMPLEXITYIn this section we discuss the efficiency of our reconstruction al-gorithm.We begin by analyzing the complexity of the algorithm described above.Then,we present two algorithmic improvements. Thefirst describes how hierarchical clustering can be used to re-duce the screening overhead at coarser resolutions.The second ap-plies to both the unscreened and screened solver implementations, showing that the asymptotic time complexity in both cases can be reduced to be linear in the number of input points.5.1Efficiency of basic solverLet us begin by analyzing the computational complexity of the unscreened and screened solvers.We assume that the points P are evenly distributed over a surface,so that the depth of the adapted octree is D=O(log|P|)and the number of octree nodes at depth d is O(4d).We also note that the number of nonzero entries in matrix A dd is O(4d),since the matrix has O(4d)rows and each row has at most53nonzero entries.(Since we use second-order B-splines, basis functions are supported within their one-ring neighborhoods and the support of two functions will overlap only if one is within the two-ring neighborhood of the other.)Assuming that the matrices A dd have already been computed,the computational complexity for the different steps in Algorithm1is: Step3:O(4d)–since A dd has O(4d)nonzero entries.Step4:O(4d)–since A d has O(4d)nonzero entries and the number of relaxation steps performed is constant.Steps2-3:∑d−1d =0O(4d)=O(4d·d).Steps2-4:O(4d·d+4d)=O(4d·d).Steps1-4:∑D d=0O(4d·d)=O(4D·D)=O(|P|·log|P|). There still remains the computation of matrices A dd .For the unscreened solver,the complexity of computing A dd is O(4d),since each entry can be computed in constant time.Thus, the overall time complexity remains O(|P|·log|P|).For the screened solver,the complexity of computing A dd is O(|P|)since defining the coefficients requires accumulating the screening contribution from each of the points,and each point contributes to a constant number of rows.Thus,the overall time complexity is dominated by the cost of evaluating the coefficients of A dd which is:D∑d=0d−1∑d =0O(|P|)=O(|P|·D2)=O(|P|·log2|P|).5.2Hierarchical Clustering of Point ConstraintsOurfirst modification is based on the observation that since the basis functions at coarser resolutions are smooth,it is unnecessary to constrain them at the precise sample locations.Instead,we cluster the weighted points as in[Rusinkiewicz and Levoy2000]. Specifically,for each depth d,we define(w d,P d)where p i∈P d is the weighted average position of the points falling into octree node i at depth d,and w d(p i)is the sum of the associated weights.3 If all input points have weight w(p)=1,then w d(p i)is simply the number of points falling into node i.This alters the computation of the system matrix coefficients:A dd i j= ∇B d i,∇B d j [0,1]3+2dα B d i,B d j (w d,P d).Note that since d>d ,the value B d i,B d j (w d,P d)is obtained by summing over points stored with thefiner resolution.In particular,the complexity of computing A dd for the screened solver becomes O(|P d|)=O(4d),which is the same as that of the unscreened solver,and both implementations now have an overall time complexity of O(|P|·log|P|).On typical examples,hierarchical clustering reduces execution time by a factor of almost two,and the reconstructed surface is visually indistinguishable.5.3Conforming OctreesTo account for the adaptivity of the octree,Algorithm1subtracts off the constraints met at all coarser resolutions before relaxing at a given depth(steps2-3),resulting in an algorithm with log-linear time complexity.We obtain an implementation with linear complexity by forcing the octree to be conforming.Specifically, we define two octree cells to be mutually visible if the supports of their associated B-splines overlap,and we require that if a cell at depth d is in the octree,then all visible cells at depth d−1must also be in the tree.Making the tree conforming requires the addition of new nodes at coarser depths,but this still results in O(4d)nodes at depth d.While the conforming octree does not satisfy the condition that a coarser solution can be prolonged into afiner one,it has the property that the solution obtained at depths{0,...,d−1}that is visible to a node at depth d can be expressed entirely in terms of the coefficients at depth d−ing an accumulation vector to store the visible part of the solution,we obtain the linear-time implementation in Algorithm2.3Note that the weight w d(p)is unrelated to the screening weight2d introduced in Section4.3for scale-independent screening.ACM Transactions on Graphics,V ol.VV,No.N,Article XXX,Publication date:Month YYYY.6•M.Kazhdan and H.HoppeHere,P d d−1is the B-spline prolongation operator,expressing a solution at depth d−1in terms of coefficients at depth d.The number of nonzero entries in P d d−1is O(4d),since each column has at most43nonzero entries,so steps2-5of Algorithm2all have complexity O(4d).Thus,the overall complexity of both the unscreened and screened solvers becomes O(|P|).Algorithm2:Conforming Cascadic Poisson Solver1For d∈{0,...,D}Iterate from coarse tofine.2ˆx d−1=P d−1d−2ˆx d−2Upsample coarseraccumulation vector.3ˆx d−1=ˆx d−1+x d−1Add in coarser solution.4b d=b d−A d d−1ˆx d−1Remove constraintsmet at coarser depths.5Relax A d x d=b d Adjust the system at depth d.5.4Implementation DetailsThe algorithm is implemented in C++,using OpenMP for multi-threaded parallelization.We use a conjugate-gradient solver to re-lax the system at each multigrid level.With the exception of the octree construction,most of the operations involved in the Poisson reconstruction can be categorized as operations that either“accu-mulate”or“distribute”information[Bolitho et al.2007,2009].The former do not introduce write-on-write conflicts and are trivial to parallelize.The latter only involve linear operations,and are par-allelized using a standard map-reduce approach:in the map phase we create a duplicate copy of the data for each thread to distribute values into,and in the reduce phase we merge the copies by taking their sum.6.RESULTSWe evaluate the algorithm(Screened)by comparing its accuracy and computational efficiency with several prior methods:the original Poisson reconstruction of Kazhdan et al.[2006](Poisson), the Wavelet reconstruction of Manson et al.[2008](Wavelet),and the Smooth Signed Distance reconstruction of Calakli and Taubin [2011](SSD).For the new algorithm,we set the screening weight toα=4and use Neumann boundary conditions in all experiments.(Numerical results obtained using Dirichlet boundaries were indistinguishable.) For the prior methods,we set algorithmic parameters to values recommended by the authors,using Haar Wavelets in the Wavelet reconstruction and setting the value/normal/Hessian weights to 1/1/0.25in the SSD reconstruction.For Poisson,SSD,and Screened we set the“samples-per-node”parameter to1and the “bounding-box-scale”parameter to1.1.(For Wavelet the bounding box scale is hard-coded at1and there is no parameter to adjust the sampling density.)6.1AccuracyWe run three different types of experiments.Real Scanner Data.To evaluate the accuracy of the different reconstruction algorithms on real-world data,we gathered several scanned datasets:the Awakening(10M points),the Stanford Bunny (0.2M points),the David(11M points),the Lucy(1.0M points), and the Neptune(2.4M points).For each dataset,we randomly partitioned the points into two equal-sized subsets:input points for the reconstruction algorithms,and validation points to measure point-to-reconstruction distances.Figure4a shows reconstructions results for the Neptune and David models at depth10.It also shows surface cross-sections overlaid with the validation points in their vicinity.These images reveal that the Poisson reconstruction(far left),and to a lesser extent the SSD reconstruction(center left),over-smooth the data,while the Wavelet reconstruction(center left)has apparent derivative discontinuities.In contrast,our screened Poisson approach(far right)provides a reconstruction that faithfullyfits the samples without introducing noise.Figure4b shows quantitative results across all datasets,in the form of RMS errors,measured using the distances from the validation points to the reconstructed surface.(We also computed the maximum error,but found that its sensitivity to individual outlier points made it an unreliable and unindicative statistic.)As thefigure indicates,the Screened Poisson reconstruction(blue)is always more accurate than both the original Poisson reconstruction algorithm(red)and the Wavelet reconstruction(purple),and generates reconstruction whose RMS errors are comparable to or smaller than those of the SSD reconstruction(green).Clean Uniformly Sampled Data.To evaluate reconstruction accuracy on clean data,we used the approach of Osada et al.[2001] to generate oriented point sets by uniformly sampling the surfaces of the Fandisk,Armadillo Man,Dragon,and Raptor models.For each model,we generated datasets of100K and1M points and reconstructed surfaces from each point set using the four different reconstruction algorithms.As an example,Figure5a shows the reconstructions of the fandisk and raptor models using1M point samples at depth10.Despite the lack of noise in the input data,the Wavelet reconstruction has spurious high-frequency detail.Focusing on the sharp edges in the model,we also observe that the screened Poisson reconstruction introduces less smoothing,providing a reconstruction that is truer to the original data than either the original Poisson or the SSD reconstructions.Figure5b plots RMS errors across all models,measured bidirec-tionally between the original surface and the reconstructed surface using the Metro tool[Cignoni and Scopigno1998].As in the case of real scanner data,screened Poisson reconstruction always out-performs the original Poisson and Wavelet reconstructions,and is comparable to or better than the SSD reconstruction. Reconstruction Benchmark.We use the benchmark of Berger et al.[2011]to evaluate the accuracy of the algorithms under different simulations of scanner error,including nonuniform sampling,noise,and misalignment.The dataset consists of mul-tiple virtual scans of implicit surfaces representing the Anchor, Dancing Children,Daratech,Gargoyle,and Quasimodo models. As an example,Figure6a visualizes the error in the reconstructions of the anchor model from a virtual scan consisting of210K points (demarked with a dashed rectangle in Figure6b)at depth9.The error is visualized using a red-green-blue scale,with red signifyingACM Transactions on Graphics,V ol.VV,No.N,Article XXX,Publication date:Month YYYY.。
2009-Challenges and opportunities for virtualized security in the clouds
Keynote TalkChallenges and Opportunitiesfor Virtualized Security in the CloudsFrank SiebenlistArgonne National Laboratory – University of ChicagoArgonne, IL, USAfranks@AbstractThe virtualization technologies that underlie the cloud computing infrastructures pose challenges on enforcing security policy when we have a sense of ambiguity concerning the actual physical properties of the resources. On the other hand, the virtual machine managers provide us with better sandboxing, detailed monitoring capabilities and fine-grained access control on the resource usage.As we expect the whole world to virtualize over the next 5-10 years, the presentation will present a forward-looking view on the cloudy road ahead with a focus on the associated security topics.1Categories & Subject Descriptors: D.4.6 [OPERATING SYSTEMS] Security andProtection; K.6.5 [MANAGEMENT OF COMPUTING AND INFORMATION SYSTEMS]Security and Protection; C.2.0 [COMPUTER-COMMUNICATION NETWORKS] General ---Security and protection (e.g., firewalls)General Terms: Security, Management, DesignBioFrank Siebenlist is a Senior Security Architect at the Mathematics and Computer Science Division at Argonne National Laboratory and a Fellow at the Computation Institute of the University of Chicago. Frank has a Ph.D. in Physics from the University of Amsterdam in the Netherlands. He has extensive experience with distributed computing and security. He has worked for major financial institutions (VP at Citibank and Senior Consultant at J.P. Morgan) in Hong Kong and New York. He has also worked for a number of technology companies, including start-ups in Silicon Valley (Chief Architect at DASCOM and Chief Security Architect at Eazel), and at IBM asa Senior Security Architect. He currently works on the security aspects of various DOE/NSF/NIH-funded Grid projects that deal with cancer research, climate modeling, astronomy, elementary particles, etc. Furthermore, Frank authored, influenced and contributed to numerous of security related standards at X/Open, Open Group, IETF, OMG, OGF, and OASIS.1 This work was supported by the U.S. Dept. of Energy under contract DE-AC02-06CH11357.Copyright is held by the author/owner(s).SACMAT’09, June 3–5, 2009, Stresa, Italy.ACM 978-1-60558-537-6/09/06.1。
Boid规则
Abstract
The aggregate motion of a flock of birds, a herd of land animals, or a school of fish is a beautiful and familiar part of the n a t u r a l world. But this type of complex motion is rarely seen in computer animation. This paper explores an approach based on simulation as an alternative to scripting the paths of each bird individually. The simulated flock is an elaboration of a particle system, with the simulated birds being the particles. The aggregate motion of the simulated flock is created by a distributed behavioral model much like that at work in a natural flock; the birds choose their own course. Each simulated bird is implemented as an independent actor that navigates according to its local perception of the dynamic environment, the laws of simulated physics that rule its motion, and a set of behaviors programmed into it by the "animator." The aggregate motion of the simulated flock is the result of the dense interaction of the relatively simple behaviors of the individual simulated birds. Categories and Subject Descriptors: 1.2.10 [Artificial Intelligence]: Vision and Scene Understanding; 1.3.5 [Computer Graphics]: Computational Geometry and Object Modeling; 1.3.7 [Computer Graphics]: Three-Dimensional Graphics and Realism--Animation; 1.6.3 [Simulation and Modeling[: Applications. General Terms: Algorithms, design. Additional Key Words, and Phrases: flock, herd, school, bird, fish, aggregate motion, particle system, actor, flight, behavioral animation, constraints, path planning. it seems randomly arrayed and yet is magnificently synchronized. Perhaps most puzzling is the strong impression of intentional, centralized control. Yet all evidence indicates that flock motion must be merely the aggregate result of the actions of individual animals, each acting solely on the basis of its own local perception of the world. One area of interest within computer animation is the description and control of all types of motion. Computer animators seek both to invent wholly new types of abstract motion and to duplicate (or make variations on) the motions found in the real world. At first glance, producing an animated, computer graphic portrayal of a flock of birds presents significant difficulties. Scripting the path of a large number of individual objects using traditional computer animation techniques would be tedious. Given the complex paths that birds follow, it is doubtful this specification could be made without error. Even if a reasonable number of suitable paths could be described, it is unlikely that the constraints of flock motion could be maintained (for example, preventing collisions between all birds at each frame). Finally, a flock scripted in this manner would be hard to edit (for example, to alter the course of all birds for a portion of the animation). It is not impossible to script flock motion, but a better approach is needed for efficient, robust, and believable animation of flocks and related group motions. This paper describes one such approach. This approach assumes a flock is simply the result of the interaction between the behaviors of individual birds. To simulate a flock we simulate the behavior of an individual bird (or at least that portion of the bird's behavior that allows it to participate in a flock). To support this behavioral "control structure" we must also simulate portions of the bird's perceptual mechanisms and aspects of the physics of aerodynamic flight. If this simulated bird model has the correct flock-member behavior, all that should be required to create a simulated flock is to create some instances of the simulated bird model and allow them to interact. ** Some experiments with this sort of simulated flock are described in more detail in the remainder of this paper. The suc*In this paperflock refers generically to a group of objects that exhibit this general class of polarized, noncolliding, aggregate motion. The term polarization is from zoology, meaning alignment of animal groups. English is rich with terms for groups of animals; for a charming and literate discussion of such words see An Exultation of Larks. [16] **This paper refers to these simulated bird-like, "bird-old" objects generically as "boids" even when they represent other sorts of creatures such as schooling fish.
What Every Computer Scientist Should Know About Floating-Point Arithmetic
2550 Garcia Avenue Mountain View, CA 94043 U.S.A.
Part No: 800-7895-10 Revision A, June 1992
iii
Exception Handling. . . . . . . . . . . . . . . . . . . . . . . . . . . . . . . . . The Details . . . . . . . . . . . . . . . . . . . . . . . . . . . . . . . . . . . . . . . . . . . Rounding Error . . . . . . . . . . . . . . . . . . . . . . . . . . . . . . . . . . . . Errors In Summation . . . . . . . . . . . . . . . . . . . . . . . . . . . . . . . . Summary. . . . . . . . . . . . . . . . . . . . . . . . . . . . . . . . . . . . . . . . . . . . . Acknowledgments . . . . . . . . . . . . . . . . . . . . . . . . . . . . . . . . . . . . . References . . . . . . . . . . . . . . . . . . . . . . . . . . . . . . . . . . . . . . . . . . . . Theorem 14 and Theorem 8 . . . . . . . . . . . . . . . . . . . . . . . . . . . . .
《医学主题词表》

《医学主题词表》来源:创新医学网医学编辑部推荐《医学主题词表》(MeSH)(1)《医学主题词表》(Medical Subject Headings,简称MeSh),是美国国立医学图书馆编制的权威性主题词表。
它是一部规范化的可扩充的动态性叙词表。
美国国立医学图书馆以它作为生物医学标引的依据,编制《医学索引》(Index Medicus)及建立计算机文献联机检索系统MEDLINE数据库。
《MeSh》汇集约18,000多个医学主题词。
《MeSh》在文献检索中的重要作用主要表现在两个方面:准确性(准确揭示文献内容的主题)和专指性。
标引(对文献进行主题分析,从自然语言转换成规范化检索语言的过程)人员将信息输入检索系统以及检索者(用户)利用系统内信息情报这两个过程中,以主题词作为标准用语,使标引和检索之间用语一致,达到最佳检索效果。
(2)在进行检索时,用户输入一个主题词后,系统会自动显示该主题词所能组配的副主题词。
《MeSh》有一个副主题词表,1989-1990年IM使用的副主题词是77个,1991-1994年是80个,每年略有变化。
目前IM使用的副主题词是92个。
副主题词(Subheadings)又称限定词(Qualifiers),与主题词进行组配,对某一主题词的概念进行限定或复分,使主题词具有更高的专指性。
如诊断(Diagnosis,DI)、药物治疗(Drug Theray,DT)、血液供给(Blood Supply,BS)等。
正确选择副主题词也很关键。
例如肺发育不全,输入主题词“肺”后,在副主题词菜单中选择“畸形”表示发育不全;再例如,双子宫——用子宫/畸形检索。
(3)在〈〈医学主题词注释字顺表MeSHAAL〉〉中,对每个范畴类目的主题词和副主题词的组配原则进行了严格规定,组配时要按照规则进行。
例如,副主题词治疗therapy与疾病主题词组配,可用于综合疗法。
例如,消化性溃疡的心理疗法,用消化性溃疡/治疗;心理疗法。
科技外文文献原文
AMBULANT:A Fast,Multi-Platform Open Source SML Player Dick C.A. Bulterman, Jack Jansen, Kleanthis Kleanthous, Kees Blom and Daniel Benden CWI: Centrum voor Wiskunde en InformaticaKruislaan 4131098 SJ Amsterdam, The Netherlands +31 20 592 43 00 Dick.Bulterman@cwi.nl ABSTRACTThis paper provides an overview of the Ambulant Open SMIL player. Unlike other SMIL implementations, the Ambulant Player is a reconfigureable SMIL engine that can be customized for use as an experimental media player core.The Ambulant Player is a reference SMIL engine that can be integrated in a wide variety of media player projects. This paper starts with an overview of our motivations for creating a new SMIL engine then discusses the architecture of the Ambulant Core (including the scalability and custom integration features of the player).We close with a discussion of our implementation experiences with Ambulant instances for Windows,Mac and Linux versions for desktop and PDA devices.Categories and Subject Descriptors H.5.1 Multimedia Information Systems [Evaluation]H.5.4 Hypertext/Hypermedia [Navigation]. General TermsExperimentation, Performance, V erification KeywordsSMIL, Player, Open-Source, Demos1.MOTIV ATIONThe Ambulant Open SMIL Player is an open-source, full featured SMIL 2.0 player. It is intended to be used within the researcher community (in and outside our institute) in projects that need source code access to a production-quality SMIL player environment. It may also be used as a stand-alone SMIL player for applications that do not need proprietary mediaformats.The player supports a range of SMIL 2.0 profiles ( including desktop and mobile configurations) and is available in distributions for Linux, Macintosh, and Windows systems ranging from desktop devices to PDA and handheld computers. While several SMIL player implementationsexist,including the RealPlayer [4], InternetExplorer [5], PocketSMIL [7],GRiNS [6],X-SMILES [8] and various proprietary implementations for mobile devices, we developed Ambulant for three reasons:Permission to make digital or hard copiesof all or part of this work for personal or classroom use is granted without fee provided that copies are not made or distributed for profit or commercial advantage and that copies bear this notice and the full citation on the first page. To copy otherwise, or republish,to post on servers or to redistribute tolists,requires prior specific permissionand/or a fee.'MM' 04, October 10-16, 2004, New Y ork, New Y ork, USA.Copyright 2004 ACM 1-58113-893-8/04/0010...$5.00.•N one of the existi ng SMIL players provides a complete and correct SMIL 2.0 implementation. The Ambulant player implements all of SMIL, based on the SMIL 2.0 Language profile plus extensions to support advanced animation and the needs of the mobile variant used by the 3GPP/PSS-6 SMIL specification [9]. •A ll commercial SMIL players are geared to the presentation of proprietary media. The Ambulant player uses open-source media codecs and open-source network transfer protocols, so that the player can be easily customized foruse in a wide range of researchprojects.• Our goal is to build a platform that will encourage the development of comparable multimedia research output.By providing what we expect will be a standard baseline player, other researchers and developmentorganizations can concentrate on integratingextensions to the basic player (either in terms of new media codecs or new network control algorithms). These extensions can then be shared by others.In contrast to the Helix client architecture [10], which also moved to a GPL core in mid-2004, the Ambulant player supports a wider range of SMIL target application architectures,it provides a more complete and correct implementation of the SMIL language,it provides much better performance on low-resource devices and it provides a more extensible media player architecture. It also provides an implementation that includes all of the media codecs as part of the open client infrastructure.The Ambulant target community is not viewers of media content, but developers of multimedia infrastructures, protocols and networks. Our goal has been to augument the existing partial SMIL implementations produced by many groups with a complete implementation that supports even the exotic features of the SMIL language. The following sections provide an introduction to the architecture of the player and describe the state of the various Ambulant implementations. We then discuss how the Ambulant Core can be re-purposed in other projects. We start with a discussion of Ambulant 's functional support for SMIL.2.FUNCTIONAL SUPPORT FOR SMIL 2.0The SMIL 2.0 recommendation [1] defines 10 functional groups that are used to structure the standard '5s0+ modules. These modules define the approximately 30 XML elements and 150 attributes that make up the SMIL 2.0 language. In addition to defining modules, the SMIL 2.0 specification also defines a number of SMIL profiles: collection of elements, attributes and attribute values that are targeted to meet the needs of a particular implementation community. Common profiles include the full SMIL 2.0 Language, SMIL Basic, 3GPP SMIL,XHTML+SMIL and SMIL 1.0 profiles.A review of these profiles is beyond the scope of this paper(see [2]), but a key concern of Ambulant ' sdevelopment has been to provide a player core that can be used to support a wide range of SMIL target profiles with custom player components.This has resulted in an architecture that allows nearly all aspects of the player to be plug-replaceable via open interfaces. In this way, tailored layout, scheduling, media processing and interaction modules can be configured to meet the needs of individual profile requirements. The Ambulant player is the only player that supports this architecture.The Ambulant player provides a direct implementation of the SMIL 2.0 Language profile, plus extensions that provide enhanced support for animation and timing control. Compared with other commercial and non-commercial players, the Ambulant player implements not only a core scheduling engine, it also provides complete support for SMIL layout,interaction, content control and networking facilities.Ambulant provides the most complete implementation of the SMIL language available to date.3.AMBULANT ARCHITECTUREThis section provides an overview of the architecture of the Ambulant core. While this discussion is high-level, it will provide sufficient detail to demonstrate the applicability of Ambulant to a wide range of projects. The sections below consider thehigh-level interface structure, the common services layer and the player com mon core architecture.3.1The High-Level Interface StructureFigure 1 shows the highest level player abstract ion. The player core support top-level con trol exter nal entry points (in clud ing play/stop/pause) and in turn man ages a collection of external factories that provide in terfaces to data sources (both for sta ndard and pseudo-media), GUI and window system interfaces and in terfaces to ren derers. Unlike other players that treat SMIL as a datatype [4],[10], the Ambula nt en gi ne has acen tral role in in teractio n with the input/output/scree n/devices in terfaces.This architecture allows the types of entry points (and the moment of evaluation) to be customized and separated from the various data-sources and renderers. This is important forintegration with environments that may use non-SMIL layout or special device in terface process ing.Figuit 1 k Ambulaittliigk-ljtwLstruchm.3.2The Common Services LayerFigure 2 shows a set of com mon services that are supplied for the player to operate. These in clude operati ng systems in terfaces, draw ing systems in terfaces and support for baseli ne XML fun ctio ns.All of these services are provided by Ambulant; they may also be integrated into other player-related projects or they may be replaced by new service components that are optimized for particular devices or algorithms. Hsurt 2. Amldant Common [Services Liwr/3.3The Player Common CoreFigure 3 shows a slightly abstracted view ofthe Ambula nt com mon core architecture. The view is essentially that of a single instanceof the Ambula nt player. Although only oneclass object is shown for eachservice,multiple interchangeable implementations have been developed for all objects (except the DOM tree) during theplayer 'development. As an example,multiple schedulers have bee n developed to match the fun cti onalcapabilities of various SMIL profiles.Arrows in the figure denote that one abstract class depends on the services offered by the other abstract class. Stacked boxes denote that a si ngle in sta nce of the player will con tain in sta nces of multiple con crete classes impleme nting that abstract class: one for audio, one for images, etc. All of the stacked-box abstract classes come with a factory function to create the in sta nces of the required con crete class.The bulk of the player implementation is architected to be platform in depe ndent. As we will discuss, this platform in depe ndent component has already been reused for five separate player impleme ntati ons. The platform dependent portions of the player include support for actual ren deri ng, UI in teract ion and datasource processing and control. When the player is active, there is asingle instanee of the scheduler and layout manager, both of which depend on the DOM tree object. Multiple instances of data source and playable objects are created. These in teract with multiple abstract rendering surfaces. The playable abstract class is the scheduler in terface (play, stop) for a media no de, while the renderer abstract class is the drawing in terface (redraw). Note that not all playables are ren derers (audio, SMIL ani mati on). The architecture has bee n desig ned to have all comp onents be replaceable, both in terms of an alter native impleme ntati on of a give n set of functionality and in terms of a complete re-purposing of the player components. In this way, the Ambulant core can be migrated to being a special purpose SMIL engine or a non-SMIL engine (such as support for MPEG-4 or other sta ndards).The abstract in terfaces provided by the player do not require a “ SMIL on Top” model of docume nt process ing. The abstract in terface can be used with other high-level control 4.1 Implementation PlatformsSMIL profiles have been defined for a widerange of platforms and devices, ranging fromdesktop implementations to mobile devices. Inorder to support our research on distributedmodels (such as in an XHTML+SMIL implementation), or to control non-SMILlower-level rendering (such as timed text).Note that in order to improve readability of theillustrati on, all auxiliary classes (threadi ng, geometry and color han dli ng, etc.) and several classes that were not important for general un dersta nding (player driver engine, transitions, etc.) have been left out of the diagram.4. IMPLEMENTATION EXPERIENCESThis sectio nwill briefly review ourimpleme ntatio n experie nces with theAmbula nt player. We discuss the implementation platforms used during SMIL ' s development and describe a set of test documents that were created to test the fun cti on ality of the Ambula nt player core. We con clude with a discussi on on the performa nee of the Ambula nt player.SMIL document extensions and to provide a player that was useful for other research efforts, we decided to provide a wide range of SMIL implementations for the Ambulant project. The Ambulant core is available as a single C++ source distribution that provides support for the following platforms:•Linux: our source distributi on in elude makefiles that are used with the RH-8 distribution of Linux. We provide support for media using the FF-MPEG suite [11]. The player interface is built using the Qt toolkit [12]. •Macintosh:Ambulant supports Mac OS X 10.3. Media rendering support is available via the internal Quicktime API and via FF-MPEG . The player user interface uses standard Mac conventions and support (Coca). •Windows: Ambulant provides conventional Win32 support for current generation Windows platforms. It has been most extensivelytested with XP (Home,Professional and TabletPC) and Windows-2000. Media rendering include third-party and local support for imaging and continuous media. Networking and user interface support are provided using platform-embeddedlibraries.•PocketPC: Ambulant supports PocketPC-2000,PocketPC-2002andWindows Mobile 2003 systems. The PocketPC implementations provide support for basic imaging, audio and text facilities.•Linux PDA support:Ambulant provides support for the Zaurus Linux-PDA. Media support is provided via the FF-MPEG library and UI support is provide via Qt. Media support includes audio, images and simple text.In each of these implementations, our initial focus has been on providing support for SMIL scheduling and control functions.We have not optimized media renderer support in the Ambulant 1.0 releases, but expect to provide enhanced support in future versions. 4.2 Demos and Test SuitesIn order to validate the Ambulant player implementation beyond that available with the standard SMIL test suite [3], several demo and test documents have been distributed with the player core. The principal demos include: •Welcome: A short presentation that exercises basic timing,media rendering, transformations and animation.•NYC: a short slideshow in desktop and mobile configurations that exercises scheduling, transformation and media rendering.•News: a complex interactive news document that tests linking, event-based activation, advanced layout, timing and media integration. Like NYC, this demo support differentiated mobile and desktop configurations.•Links: a suite of linking and interaction test cases.•Flashlight: an interactive user'sguide that tests presentation customization using custom test attributes and linking/interaction support. These and other demos are distributed as part of the Ambulant player web site [13].4.3Performance EvaluationThe goal of the Ambulant implementation was to provide a complete and fast SMIL player. We used a C++ implementation core instead of Java or Python because our experience had shownthat on small devices (which we feel hold significant interest for future research), the efficiency of the implementation still plays a dominant role. Our goal was to be able to read, parse, model and schedule a 300-node news presentation in less than two seconds on desktop and mobile platforms. This goal was achieved for all of the target platforms used in the player project. By comparison, the same presentation on the Oratrix GRiNS PocketPC player took 28 seconds to read, parse and schedule. (The Real PocketPC SMIL player and the PocketSMIL players were not able to parseand schedule the document at all because of their limited SMIL language support.)In terms of SMIL language performance, our goal was to provide a complete implementation of the SMIL 2.0 Language profile[14]. Where other players have implemented subsets of this profile,Ambulant has managed to implement the entire SMIL 2.0 feature set with two exceptions: first, we currently do not support the prefetch elements of the content control modules; second, we provide only single top-level window support in the platform-dependent player interfaces. Prefetch was not supported because of the close association of an implementation with a given streaming architecture. The use of multiple top-level windows, while supported in our other SMIL implementation, was not included in version 1.0 of Ambulant because of pending working on multi-screen mobile devices. Both of these feature are expected to be supported in the next release of Ambulant.5.CURRENT STATUS AND AVAILABILITYT his paper describes version 1.0 of the Ambulant player, which was released on July 12, 2004. (This version is also known as the Ambulant/O release of the player.) Feature releases and platform tuning are expected to occur in the summer of 2004. The current release of Ambulant is always available via our SourceForge links [13], along with pointers to the most recent demonstrators and test suites.The W3C started its SMIL 2.1 standardization in May, 2004.At the same time, the W3C' s timed text working group is completing itsfirst public working draft. We will support both of these activities in upcoming Ambulant releases.6.CONCLUSIONSWhile SMIL support is becoming ubiquitous (in no small part due to its acceptance within the mobile community), the availability of open-source SMIL players has been limited. This has meant that any group wishing to investigate multimedia extensions or high-/low-level user or rendering support has had to make a considerable investment in developing a core SMIL engine.We expect that by providing a high-performance, high-quality and complete SMIL implementation in an open environment, both our own research and the research agendas of others can be served. By providing a flexible player framework, extensions from new user interfaces to new rendering engines or content control infrastructures can be easily supported.7.ACKNOWLEDGEMENTS This work was supported by the Stichting NLnet in Amsterdam.8.REFERENCES[1]W3C,SMIL Specification,/AudioVideo.[2]Bulterman,D.C.A and Rutledge, L.,SMIL 2.0:Interactive Multimedia for Weband Mobile Devices, Springer, 2004.[3]W3C,SMIL2.0 Standard Testsuite,/2001/SMIL20/testsuite/[4]RealNetworks,The RealPlayer 10,/[5]Microsoft,HTML+Time in InternetExplorer 6,/workshop/author/behaviors/time.asp[6]Oratrix, The GRiNS 2.0 SMIL Player./[7]INRIA,The PocketSMIL 2.0 Player,wam.inrialpes.fr/software/pocketsmil/. [8],X-SMILES: An Open XML-Browser for ExoticApplications./[9]3GPP Consortium,The Third-GenerationPartnership Project(3GPP)SMIL PSS-6Profile./ftp/Specs/archive/26_series/26.246/ 26246-003.zip[10]Helix Community,The Helix Player./.[11]FFMPEG ,FF-MPEG:A Complete Solution forRecording,Converting and Streaming Audioand Video./[12]Trolltech,Qtopia:The QT Palmtop/[13]Ambulant Project,The Ambulant 1.0 Open Source SMIL 2.0Player, /.[14]Bulterman,D.C.A.,A Linking andInteraction Evaluation Test Set for SMIL,Proc. ACM Hypertext 2004, SantaCruz,August, 2004.。
- 1、下载文档前请自行甄别文档内容的完整性,平台不提供额外的编辑、内容补充、找答案等附加服务。
- 2、"仅部分预览"的文档,不可在线预览部分如存在完整性等问题,可反馈申请退款(可完整预览的文档不适用该条件!)。
- 3、如文档侵犯您的权益,请联系客服反馈,我们会尽快为您处理(人工客服工作时间:9:00-18:30)。
This publication is licensed under a Creative Commons Attribution 2.5License; see /licenses/by/2.5/ for further details.3rd Biennial Conference on Innovative Data Systems Research (CIDR) January 7-10, 2007, Asilomar, California, USA.Database Servers on Chip Multiprocessors:Limitations and OpportunitiesNikos Hardavellas, Ippokratis Pandis, Ryan Johnson, Naju G. MancherilAnastassia Ailamaki and Babak FalsafiDatabase Group and Computer Architecture Lab (CALCM)Carnegie Mellon University/~stageddbABSTRACTPrior research shows that database system performance is dominated by off-chip data stalls, resulting in a concerted effort to bring data into on-chip caches. At the same time, high levels of integration have enabled the advent of chip multiprocessors and increasingly large (and slow) on-chip caches. These two trends pose the imminent technical and research challenge of adapting high-performance data management software to a shifting hardware landscape. In this paper we characterize the performance of a commercial database server running on emerging chip multiprocessor technologies. We find that the major bottleneck of current software is data cache stalls, with L2 hit stalls rising from oblivion to become the dominant execution time component in some cases. We analyze the source of this shift and derive a list of features for future database designs to attain maximum performance.Categories and Subject DescriptorsH.2.4 [Systems ]: Relational databases. H. 2.6 [Database Machines ]. H. 3.4 [Systems and Software ] Performance evaluation. C. 1.2 [Multiple Data Stream Architectures (Multiprocessors)]General TermsPerformance, Design, Experimentation.KeywordsDatabase Engine. Performance Characterization. Chip Multiprocessors. Staged Database Systems.1.INTRODUCTIONDatabase management systems is a multibillion dollar industry with high-end database servers employing state-of-the-art processors to maximize performance. Unfortunately, recent studies show that processors are far from realizing their maximum performance. Prior research [20] indicates that adverse memory access patterns in database workloads result in poor cache locality and overall performance. Databasesystems are known to spend at least half of their execution time on stalls, implying that data placement should focus on the second-level (L2) cache [4], typically found on chip in modern processors.Over the past decade, advancements in semiconductor technology have dramatically changed the landscape of on-chip caches. The increase in the number of transistors available on-chip has enabled on-chip cache sizes to increase exponentially across processor generations. The trend of increasing on-chip cache sizes is apparent in Figure 1 (a),which presents historic data on the on-chip cache sizes of several processors in the last two decades. The upward trend in cache sizes shows no signs of a slowdown. Industry advocates large caches as a microarchitectural technique that allows designers to exploit the available transistors efficiently to improve performance [7], leading to modern processors with mega-caches on chip (e.g., 16MB in Dual-Core Intel Xeon 7100 [23], and 24MB in Dual-Core Intel Itanium 2 [30]). Large caches, however, come at the cost of high access latency. Figure 1 (b) presents historic data on the L2 cache access latency, indicating that on-chip L2 latency has increased more than 3-fold during the past decade — e.g., from 4 cycles in Intel Pentium III (1995) to 14 cycles in IBM Power5 (2004). Caches enhance performance most when they capture fully the primary working set of the workload;otherwise, they provide only marginal improvements in the miss rate as size increases. Database workloads typically have a small primary working set which can be captured on chip,and a large secondary set which is beyond the reach of on-chip caches for modern processors. Conventional wisdom dictates that large on-chip caches provide significant performanceFigure 1.Historic trends of on-chip caches on(a) size, and (b) latency.benefits as they eliminate off-chip memory requests. In reality, a large cache may degrade the performance of database workloads because the cache’s high latency slows the common case (cache hits) and introduces stalls in the execution, while the additional capacity fails to lower the miss rate enough to compensate.Over the past decades, microprocessor designs focused primarily on tolerating stalls by exploiting instruction-level parallelism (ILP). The resulting wide-issue out-of-order (OoO) processors overlap both computation and memory accesses, but fall short of realizing their full potential when running database workloads. Database workloads exhibit large instruction footprints and tight data dependencies that reduce instruction-level parallelism and incur data and instruction transfer delays [4, 21]. Thus, increasingly aggressive OoO techniques yield diminishing returns in performance, while their power dissipation is reaching prohibitive levels [7]. The shortcomings of out-of-order processors, along with the continued increase in the number of transistors available on chip, have encouraged most vendors to integrate multiple processors on a single chip, instead of simply increasing the complexity of individual cores. The resulting chip multiprocessor (CMP) designs may affect data stalls through promoting on-chip data sharing across cores and increasing contention for shared hardware resources.In this paper we investigate the performance of database workloads on modern CMPs and identify data cache stalls as a fundamental performance bottleneck. Recent work in the database community [3, 4, 21] attributes most of the data stalls to off-chip memory accesses. In contrast to prior work, our results indicate that the current trend of increasing L2 latency intensifies stalls due to L2 hits1, shifting the bottleneck from off-chip accesses to on-chip L2 hits. Thus, merely bringing data on-chip is no longer enough to attain maximum performance and sustain high throughput. Database systems must also optimize for L1D locality.In this study we recognize that chip multiprocessor designs follow two distinct schools of thought, and present a taxonomy of processor designs and DBMS workloads to distinguish the various combinations of workload and system configuration. We divide chip multiprocessors into two "camps." The fat camp employs wide-issue out-of-order processors and addresses data stalls by exploiting instruction-level parallelism (e.g., Intel Core Duo [1], IBM Power 5 [16]). The lean camp employs heavily multithreaded in-order processors to hide data stalls across threads by overlapping data access latencies with useful computation (e.g., Sun UltraSparc T1 [17]). Even though LC is heavily multithreaded, it is a much simpler hardware design than the complex out-of-order FC. We divide database applications into saturated workloads, in which idle processors always find an available thread to run, and unsaturated workloads, in which processors may not always find threads to run, thereby exposing data access latencies. We characterize the performance of each database workload and system configuration pair within the taxonomy through cycle-accurate full-system simulations using FLEXUS [11] of OLTP (TPC-C) and DSS (TPC-H) workloads on a commercial DBMS. Our results indicate that:•High on-chip cache latencies shift the data stall component from off-chip data accesses to L2 hits, to thepoint where up to 35% of the execution time is spent on L2 hit stalls for our workload and CMP configurations.•Increasing the L2 cache size from 4MB to 26MB reduces throughput by up to 30%. In comparison, increasing the cache size while keeping the L2 hit latency constant yields nearly 2x speedup due to lower miss rates.•High levels of on-chip core integration increase L2 hit rates, improving performance by 12-15% and increasing the relative contribution of L2 hit stalls to 10% and 25% of execution time, respectively, for DSS and OLTP.•The combined effects of high L2 latency and on-chip core integration increase the contribution of L2 hit stalls on execution time by a factor of 5 for DSS and a factor of 7 for OLTP over traditional symmetric multiprocessors, explaining the observed departure from prior research findings.•Conventional DBMS hide stalls only in one out of four combinations of chip designs and workloads. Despite the significant performance enhancements that stem from chip-level parallelism, the fat camp still spends 46-64% of execution time on data stalls. The lean camp efficiently overlaps data stalls when executing saturated workloads, but exhibit up to 70% longer response times than the fat camp for unsaturated workloads.•To hide stall time when executing DBMS across the entire spectrum of workloads and systems, the software must improve both L1D reuse/locality and exhibit high thread-level parallelism across and within queries and transactions. Data locality helps eliminate stalls independent of workload type. Increased parallelism helps exploit the abundance of on-chip thread and processor execution resources when the workload is not saturated. The remainder of this document is structured as follows. Section2 proposes a taxonomy of chip multiprocessor technologies and workloads. Section3 presents our experimental methodology and Section4 analyzes the behavior of a commercial database server on chip multiprocessors, as a function of hardware designs and workloads. Section5 discusses the effects of hardware parameters on data stalls. Section6 discusses software techniques to enhance parallelism and reduce the L2 hit stall component. Finally, Section7 presents related work, and Section8 concludes.2.CMP CAMPS AND WORKLOADSIn this section we propose a taxonomy of chip multiprocessor technologies and database workloads and analyze their characteristics. To our knowledge, this is the first study to provide an analytic taxonomy of the behavior of database workloads in such a diverse spectrum of current and future chip designs. A recent study [10] focuses on throughput as the primary performance metric to compare server workload performance across chip multiprocessors with varying processor granularity, but has stopped short of a detailed performance characterization and breakdown of where time is spent during execution. Through a series of simulations we find that the behavior of database systems varies as a function of hardware and workload type, and that conventional database systems fail to provide high performance across the entire spectrum. The taxonomy enables us to concentrate on each segment separately and derive a list of features a database system should support.1We refer to the time spent by the processor accessing a cache block that missed in L1D but was found in L2 as “L2 hit stalls”.2.1Fat Camp vs. Lean CampHardware vendors adopt two distinct approaches to chip multiprocessor design. One approach uses cores that target maximum single-thread performance through sophisticated out-of-order execution and aggressive speculation (fat-camp or FC). Representative chip multiprocessors from this camp include Intel Core Duo [1] and IBM Power5 [16]. The second approach favors much simpler designs with cores that support many thread contexts 1 in hardware (lean-camp or LC). Such cores overlap stalls in a given thread with useful computation by other threads. Sun UltraSPARC T1 [17] and Compaq Piranha [5] fall into this camp. Table 1 summarizes the characteristics of each technology camp.Integrating multiple cores on a chip multiprocessor exhibits similar effects within each camp (e.g., increase in shared resource contention). In this paper we study the increasing performance differences between fat and lean camps when running identical database workloads, assuming that both camps are supported by the same memory hierarchy. Thus, it suffices to analyze the characteristics of each camp by focusing on the characteristics of the different core technologies within each camp.Because LC cores are heavily multithreaded, we expect them to hide stalls efficiently and provide high and scalable throughput when there is enough parallelism in the workload.However, when the workload consists of a few threads, the LC cores cannot find enough threads to overlap stalls, leaving long data access latencies exposed. On the other hand, the FC cores are optimized for single-thread performance through wide pipelines that issue/complete multiple instructions per cycle,and out-of-order speculative execution. These features exploit instruction-level parallelism within the workload to hide stalls.Thus, we expect LC cores to outperform FC cores when there is enough parallelism in the workload, even with much lower single-thread performance than that of an FC core. However,when the workload consists of few threads, we expect the response time of the single-thread optimized FC cores to be significantly lower than the corresponding response time of their LC counterparts.In addition to the performance differences when comparing single cores, an LC CMP can typically fit three times more cores in one chip than an FC CMP, resulting in roughly an order of magnitude more hardware contexts in the same space.In this paper we do not apply constraints on the chip area.Keeping a constant chip area would favor the LC camp because it would have a larger on-chip cache than the FCcamp, allowing LC to attain even higher performance in heavily multithreaded workloads, because LC is able to hide L2 stalls through multithreading.2.2Unsaturated vs. Saturated WorkloadsDatabase performance varies with the number of requests serviced. Our unsaturated workload highlights single-thread performance by assigning one worker thread per query (or transaction) it receives. A conventional DBMS can increase the parallelism through partitioning, but in the context of this paper we can treat this as having multiple clients (instead of threads). As explained in Section 6.1, the reader should also keep in mind that not all query plans are trivially parallelizable.We observe that the performance of a database application falls within one of two regions, for a given hardware platform,and characterize the workload as unsaturated or saturated. A workload is unsaturated when processors do not always find threads to run. As the number of concurrent requests increases,performance improves by utilizing otherwise idle hardware contexts. Figure 2 illustrates throughput as a function of the number of concurrent requests in the system when running TPC-H queries on a commercial DBMS on a real 4-core IBM Power5 (FC) server. Increasing the number of concurrent requests eventually results in a saturated workload, where there are always available threads for idle processors to run.Peak performance occurs at the beginning of the saturated region; increasing the number of concurrent requests too far overwhelms the hardware, reducing the amount of useful work performed by the system and lowering performance.3.EXPERIMENTAL METHODOLOGYWe use FLEXUS [11] to provide accurate simulations of chip multiprocessors and symmetric multiprocessors running unmodified commercial database workloads. FLEXUS is a cycle-accurate full-system simulator that simulates both user-level and operating system code. We use the SimFlex statistical sampling methodology [28]. Our samples are drawn over an interval of 10 to 30 seconds of simulated time (as observed by the operating system in functional simulation) for OLTP, and over the complete workload execution for DSS. We show 95% confidence intervals that target ±5% error on change in performance, using paired measurement sampling.We launch measurements from checkpoints with warmed caches and branch predictors, then run for 100,000 cycles to warm queue and interconnect state prior to collecting measurements of 50,000 cycles. We use the aggregate number1We refer to hardware threads as “hardware contexts” to distinguish them from software (operating system) threads.Table 1. Chip multiprocessor camp characteristics.Core Technology Fat Camp (FC)Lean Camp (LC)Issue Width Wide (4+)Narrow (1 or 2)Execution Order Out-of-order In-order Pipeline Depth Deep (14+ stages)Shallow (5-6 stages)Hardware ThreadsFew (1-2)Many (4+)Core SizeLarge (3 x LCsize)Small (LC size)Figure 2.Unsaturated vs. saturated workloads.of user instructions committed per cycle (i.e., committed user instructions summed over the simulated processors divided by total elapsed cycles) as our performance metric, which is proportional to overall system throughput [28].We characterize the performance of database workloads on an LC CMP and an FC CMP with the UltraSPARC III instruction set architecture running the Solaris 8 operating system. The LC CMP employs four 2-issue superscalar in-order cores. The LC cores are 4-way multithreaded, for a total of 16 hardware contexts on the LC CMP. The hardware contexts are interleaved in round-robin fashion, issuing instructions from each runnable thread in turn. When a hardware context stalls on a miss it becomes non-runnable until the miss is serviced. In the meantime, the LC core executes instructions from the remaining contexts.The FC CMP employs four aggressive out-of-order cores that can issue four instructions per cycle from a single hardware context. The two CMP designs have identical memory subsystems and clock frequencies and feature a shared on-chip L2 cache with size that ranges from 1MB to 26MB.We estimate cache access latencies using Cacti 4.2 [29]. Cacti is an integrated cache access time, cycle time, area, leakage,and dynamic power model. By integrating all these models together, cache trade-offs are all based on the same assumptions and, hence, are mutually consistent. In some experiments we purposefully vary the latency of caches beyond the latency indicated by Cacti to explore the resulting impact on performance or to obtain conservative estimates.Our workloads consist of OLTP (TPC-C) and DSS (TPC-H)benchmarks running on a commercial DBMS. The saturated OLTP workload consists of 64 clients submitting transactions on a 100-warehouse database. The saturated DSS workload consists of 16 concurrent clients running four queries from the TPC-H benchmark, each with random predicates. We select the queries as follows [24]: Queries 1, 6 are scan-dominated,Query 16 is join-dominated and Query 13 exhibits mixed behavior. To achieve practical simulation times we run the queries on a 1GB database. We corroborate recent research that shows that varying the database size does not incur any microarchitectural behavior changes [24]. Unsaturated workloads use the above methodology running only a single client, with intra-query parallelism disabled to highlight single-thread performance. We tune both the OLTP and DSSworkloads to minimize I/O overhead and maximize CPU and memory system utilization.We validate FLEXUS by comparing against an IBM OpenPower720 server that runs the same workloads. We calculate the cycles per instruction (CPI) on OpenPower720 by extracting Power5’s hardware counters through pmcount [2],post-processing the raw counters using scripts kindly provided by IBM, and comparing the results with a FLEXUS simulation that approximates the same IBM server. Figure 3 presents the absolute CPI values and their respective breakdowns. The overall simulated CPI is within 5% of the measured CPI for both OLTP and DSS workloads. The computation component for OpenPower720 is 10% higher, which we attribute to Power5’s instruction grouping and cracking overhead. The data stall component is 15% higher for FLEXUS due to the absence of a hardware prefetcher mechanism.Prior research [26] measures the impact of hardware prefetching on the performance of OLTP and DSS workloads and finds that even complex hardware prefetchers that subsume stride prefetchers yield less than 10% performance improvement for OLTP workloads, while their impact on scan-dominated DSS queries is statistically insignificant. Join-bound queries do see as much as 50% improvement, but contribute relatively little to total execution time in our DSS query mix. Even if a stride prefetcher could match the performance improvements of [26], we estimate that the performance improvement due to a stride prefetcher on our OLTP workload will be less than 10%, while the performance improvement on our scan-dominated DSS workload will be less than 20%. Furthermore, employing a stride prefetcher will not change the performance trends that are the focus of this paper.4.DBMS PERFORMANCE ON CMPSIn this section we characterize the performance of both CMP camps on a commercial DBMS running unsaturated and saturated DSS and OLTP workloads. For unsaturated workloads the performance metric of interest is response time,while for saturated workloads the performance metric of interest is throughput. Figure 4 (a) presents the response time of the LC CMP normalized to the FC CMP when running unsaturated (single-thread) workloads. Figure 4 (b) presents the throughput of the LC CMP normalized to the throughput of the FC CMP when running saturated workloads.Figure 3.FLEXUS validation using the saturated DSSworkload.Figure 4.(a) Response time and (b) throughputof LC normalized to FC.The LC CMP suffers up to 70% higher response times than FCwhen running unsaturated (single-thread) DSS workloads andup to 12% higher when running unsaturated OLTP workloads, corroborating prior results [21]. The performance differencebetween FC and LC on unsaturated OLTP workloads isnarrower due to limited ILP. Even though FC exhibits higher single-thread performance than LC, the LC CMP achieves 70% higher throughput than its FC counterpart when running saturated workloads (Figure4 b).Figure5 shows the execution time breakdown for each campand workload combination. Although we configure the CMPs with an unrealistically fast 26MB shared L2 cache, data stalls dominate execution time in three out of four cases. While FC spends 46% - 64% of execution time on data stalls, LC spends at most 13% of execution time on data stalls when running saturated workloads, while spending 76-80% of the time on useful computation. The multiple hardware contexts in LC efficiently overlap data stalls with useful computation, thereby allowing LC to significantly outperform its FC counterpart on saturated workloads.Despite prior work [4] showing that instruction stalls oftendominate memory stalls when running database workloads, ourCMP experiments indicate that data stalls dominate the memory access component of the execution time for all workload/camp combinations. Both camps employ instruction stream buffers [15], a simple hardware mechanism that automatically initiates prefetches to successive instruction cache lines following a miss. Our results corroborate prior research [21] that demonstrates instruction stream buffers efficiently reduce instruction stalls. Because of their simplicity, instruction stream buffers can be employed easily by the majority of chip multiprocessors, thus we do not further analyze instruction cache performance.We conclude that the abundance of threads in saturated workloads allows LC CMPs to hide data stalls efficiently. The multiple hardware contexts available on the LC CMP allow it to perform useful computation while some of the contexts are stalled on long latency data access operations, thereby improving overall throughput. In contrast, the FC CMP fails to utilize fully its hardware resources because database workloads exhibit limited ILP. FC processors would also benefit from multithreaded operation, but their complexity limits the number of hardware contexts they can employ. Our calculations show that each FC core would require more than 15 hardware contexts to fully overlap data stalls, which is infeasible due to the complexity and power implications it entails. Thus, FC CMPs cannot hide data stalls the way context-rich LC CMPs can.However, we expect that in spite of less than ideal performance on database workloads, FC CMPs will still claim a significant market share due to their unparalleled single-thread performance and optimized execution on a variety of other workloads (e.g., desktop, scientific computing). Thus, database systems must be designed to perform well on both CMP camps, independent of workload type. To maximize performance across hardware and workload combinations, database systems must exhibit high thread-level parallelism across and within queries and transactions, and improve data locality/reuse. Increased parallelism helps exploit the abundance of on-chip thread and processor execution resources when the workload is not saturated. Data locality helps eliminate stalls independent of workload type.Figure5 shows that in six out of eight combinations of hardware and workloads, data stalls dominate execution time even with unrealistically fast and large caches. In Section5 we analyze the data stall component of execution time to identify dominand subcomponents and trends, that will help guide the implementation and optimization of future database software. In the interest of brevity, we analyze data stalls by focusing on saturated database workloads running on FC CMPs, but the results of our analysis are applicable across all combinations of hardware and workloads that exhibit high data stall time.5.ANALYSIS OF DATA STALLSIn this section we analyze the individual sub-components of data cache stalls and identify the emerging importance of L2 hit stalls, which account for up to 35% of execution time for our hardware configurations and workloads. This represents a a 7-fold increase in percent of execution time, as compared to traditional symmetric multiprocessors with small caches running the same set of workloads.Section5.1 explores the impact of increased on-chip cache sizes on the breakdown of data stalls, both for constant (low) hit latencies and for realisitic latencies provided by Cacti. In Section5.2 we analyze the impact of integrating multiple cores into a single chip. Finally, in Section5.3 we study the effects of high levels of on-chip integration by increasing the number of available cores on chip.5.1Impact of on-chip cache sizeLarge on-chip L2 caches can shift the data stall bottleneck in two ways. First, larger caches increase the amount of data stored in the cache, resulting in higher hit rates that shift stalls from memory to L2 hits, thereby increasing the relative importance of L2 hit stalls. Second, rising hit latencies penalize each hit and increase the number of stalls caused by L2 hits without changing the number of accesses to other parts of the memory hierarchy.Figure6 (a) presents the impact of increasing cache size on DBMS performance. We simulated both OLTP and DSS workloads on a FC CMP, with cache sizes ranging from 1MB to 26MB. To separate the effect of hit rates from that of hit latencies, we perform two sets of simulations. The upper (dotted) pair of lines shows the performance increase achieved when the hit latency remains fixed at an unrealistically low 4 cycles. The lower (solid) pair of lines shows performance under the more reasonable hit latencies for each cacheFigure 5.Breakdown of execution timeconfiguration as supplied by Cacti. These estimates areconservative because hit latencies supplied by Cacti aretypically lower than the ones achieved in commercial products. In all cases, increasing the cache size significantly improvesperformance as more of the primary L2 working set fits in thecache. However, the two sets quickly begin to diverge, even before the cache captures the entire working set (between 8MBand 16MB for our workloads). Even though there is no cyclepenalty for increasing L2 sizes in the fixed-latency case, we see diminishing returns because even the biggest cache fails to capture the large secondary L2 working set. In contrast, realistic hit latencies further reduce the benefit of larger caches, and the added delay begins to outweigh the benefits of lower miss rates even before the working set is captured. The adverse effects of high L2 hit latency reduce the potential performance benefit of large L2 caches by up to 2.2x for OLTP and 2x for DSS.Figure6 (b) and (c) show the contributions of realistic L2 hitlatencies to data stalls and overall CPI for OLTP and DSSrespectively. In the fixed-latency case (not shown) the stall component due to L2 hits quickly stabilizes at less than 5% of the total CPI. On the other hand, realistic latencies, are responsible for a growing fraction of the overall CPI, especially in DSS, where they become the single largest component of execution time. The remainder of the CPI increase comes from instruction stalls due to L2 hits, again an artifact of larger (and slower) caches. Instruction stalls due to L2 are especially evident in the OLTP workload, where they account for roughly half of the overall CPI increase. Increasing cache sizes and their commensurate increase in latency can have dramatic effects on the fraction of time spent on L2 hit data stalls. For our workloads running on a FC CMP we measure a 12-fold increase in time spent in L2 hit stalls when increasing the cache size from 1MB to 26MB; rising hit latencies are responsible for up to 78% of this increase.5.2Impact of core integration on a single chip In this section we study the outcome of integrating multiple processing cores on a single chip. We compare the performance of a commercial database server running OLTP and DSS workloads in two variants of our baseline system: (a) a 4-processor SMP with private 4MB L2 caches at each node, and (b) a 4-core CMP with a single shared 16MB L2.Figure7 presents normalized CPI breakdowns for the two systems, with labels indicating the actual CPI. We observe that the performance of the CMP systems is higher. The difference in the performance between the SMP and the CMP systems can be attributed to the elimination of coherence traffic. Dataaccesses that result in long-latency coherence misses in theSMP system are converted into L2 hits on the shared L2 cache of the CMP and fast L1-to-L1 on-chip data transfers. Thus, theL2 hit stall component of CPI increases by a factor of 7 overthe corresponding SMP designs, explaining the disparity of ourresults as compared to prior research findings [24].5.3Impact of on-chip core countChip multiprocessors integrate multiple cores on a single chip,which promotes sharing of data through the common L2 cache.At the same time, contention for shared hardware resources my offset some of the benefits of fast on-chip data sharing.To study the impact of high levels of core integration on chipwe simulate saturated OLTP and DSS workloads on a FC chipmultiprocessor with a 16MB shared L2 as we increase the number of cores from 4 (the baseline) to 16.Figure8 presents the change in performance as the number of processing cores increases. The diagonal line shows linear speedup as a reference. We observe a 9% superlinear increase in throughput at 8 cores for DSS, due to an increase in sharing, after which pressure on the L2 cache adversely affects performance for both workloads. OLTP, in particular, realizes only 74% of its potential linear performance improvement. The pressure on the cache is not due to extra misses — in fact, the L2 miss rate continues to drop due to increased sharing as more cores are added. Rather, physical resources such as cache ports and status registers induce queueing delays during burstsFigure 6.Effect of cache size and latency on (a) throughput, (b) CPI contributions for OLTP, and (c) CPI contributions for DSSFigure 7.Effect of chip multiprocessing on CPI。