Chin. Phys. B Vol. 22, No. 4 (2013) 044206
Removingpaintfro_省略_lattenedtoplaser_施曙东
1. Introduction
Laser cleaning is an environment friendly cleaning technique and has attracted more attention in industry. Due to its superior characteristics,[1] laser cleaning have proved to be very successful in the cleaning of polymer,[2] rubber tire molds,[3,4] large mirror,[5] magnetic head sliders,[6] artworks, and historical heritages,[7] and semiconductor chips with surface particles.[8−11] However, in the early applications laser cleaning techniques had relatively low cleaning efficiency. Although successful application for removal painting from metal surface is present, the technique has its disadvantages. For example the speed of the cleaning is relatively slow due to the small cleaned area, owing to small laser spot size. In addition, overexposure of the Gaussian laser pulses may result in substrate damage due to its high energy density beam. Therefore, a more effective laser cleaning technique requires not only high cleaning efficiency but also no damage to substrate. Chen et al.[12] found
高温预生长对图形化蓝宝石衬底GaN薄膜质量的提高

高温预生长对图形化蓝宝石衬底GaN薄膜质量的提高黄华茂;杨光;王洪;章熙春;陈科;邵英华【摘要】在图形化蓝宝石衬底生长低温缓冲层之前,通入少量三甲基镓(TMGa)和大量氨气进行短时间的高温预生长,通过改变TMGa流量制备了4个蓝光LED样品.MOCVD外延生长时使用激光干涉仪实时监测薄膜反射率,外延片使用高分辨率X射线衍射(002)面和(102)面摇摆曲线估算位错密度,并使用光致发光谱表征发光性能,制备成芯片后测试了正向电压和输出光功率.结果表明,高温预生长可促进薄膜的横向外延,使得三维岛状GaN晶粒在较小的薄膜厚度内实现岛间合并,有利于降低位错密度,提高外延薄膜质量,LED芯片的输出光功率的增强幅度达29.1%,而电学性能无恶化迹象;但高温预生长工艺中TMGa的流量应适当控制,过量的TMGa导致GaN晶粒过大,将延长岛间合并时间,降低晶体质量.【期刊名称】《发光学报》【年(卷),期】2014(035)008【总页数】6页(P980-985)【关键词】LED;GaN;图形化蓝宝石衬底;高温预生长【作者】黄华茂;杨光;王洪;章熙春;陈科;邵英华【作者单位】华南理工大学理学院物理系广东省光电工程技术研究开发中心,广东广州510640;华南理工大学理学院物理系广东省光电工程技术研究开发中心,广东广州510640;华南理工大学理学院物理系广东省光电工程技术研究开发中心,广东广州510640;华南理工大学理学院物理系广东省光电工程技术研究开发中心,广东广州510640;鹤山丽得电子实业有限公司,广东鹤山529728;鹤山丽得电子实业有限公司,广东鹤山529728【正文语种】中文【中图分类】TN303;TN3041 引言第三代半导体材料氮化镓(GaN)具有直接带隙、禁带宽度宽、化学稳定性和热稳定性好等优点,在光电子和微电子领域有巨大的应用价值。
由于大尺寸GaN体材料生长困难,目前GaN基发光二极管(LED)绝大部分都是在蓝宝石、碳化硅和硅衬底上进行异质外延。
离子径迹模板法制备纳米线
离子径迹模板法制备纳米线姚会军1,2,刘杰11中国科学院近代物理研究所,兰州,7300002中国科学院研究生院,北京,100039摘要:重离子辐照过的高分子有机膜,经过适当的处理,可以作为模板来制备金属和可溶性盐的纳米线,此方法称为离子径迹模板法。
本文介绍了电化学沉积方法和过饱和溶液法来制备金属纳米线和可溶性盐纳米线的实例,同时还介绍了以有机模为模板制备纳米线的一些应用。
关键字:模板法离子径迹纳米线1、引言:目前纳米材料已成为国内外研究的一个热点课题,对于被视为21世纪重点开发领域的IT,能源,环境,生物等领域都将产生极其广泛和重要的影响[1]。
做为纳米材料的成员之一,纳米线因其优异的光学性能、电学性能及力学性能等特性而引起了凝聚态物理界化学界及材料科学界科学家们的关注, 利用物理和化学方法组装纳米线近年来也成为纳米材料研究的热点[2]。
其中,利用离子径迹模板法来制备纳米线已经成为近年来兴起的新的制备方法。
高分子有机薄膜在经过高能离子辐照以后,会在薄膜中形成直径从几纳米到几十纳米的柱状损伤区域,这些损伤区域称作离子的潜径迹(latent track)。
把带有潜径迹的薄膜放在蚀刻液中进行蚀刻,根据蚀刻条件不同,会在薄膜内形成直径从十几纳米到几百纳米的孔阵列,把这种带有孔阵列的薄膜称为核孔膜[3]。
通过各种物理和化学方法,以核孔膜为模板(离子径迹模板),可以把金属,无机盐等填充到其内形成平行排列的纳米线阵列。
对于加速器中辐照的膜,由于重离子束流的高度平行、能量均匀可控,膜孔的均匀性和方向性良好。
另外,根据膜的厚度和重离子辐照剂量的不同,模板内孔的长度和密度也会有所不同[4]。
离子径迹模板法制备纳米线因其以上独特的优点而被逐渐被人们所采用。
2、核孔模的制备(1) 重离子辐照核孔膜所用高分子有机膜多为聚酯(PET)和聚碳酸酯(PC)膜,高能重离子在通过聚合物时损失能量,并引起靶原子的激发和电离,在许多固体中,导致永久的辐照损伤。
一种低功耗运算放大器电路的抗辐照设计
一种低功耗运算放大器电路的抗辐照设计作者:郑直来源:《电子技术与软件工程》2017年第15期摘要:本文设计了一款低功耗放大器,整个放大器分为差分输入级、中间增益级、缓冲输出级以及偏置电路四部分。
采用SOI工艺制作,提高了放大器的抗辐照能力。
经流片测试,静态电源电流为0.8mA,输入失调电压为-0.9mV,输入失调电流为0.9nA。
【关键词】放大器低功耗抗辐照 SOI工艺随着个人通讯的迅速发展,尤其是笔记本电脑、移动通信等便携式设计的广泛使用,低功耗成为电子产品,尤其是便携式电子产品的主要竞争指标。
运算放大器作为集成电路中最基本单元,其性能高低往往决定整个系统的表现。
另一方而,当今军事的竞争日趋激烈,集成电路在军事中也得到了越来越多的应用。
军事领域中恶劣环境对集成电路提出了严苛的要求。
在外太空以及核爆炸等恶劣环境下产生的辐照对集成电路有显著的影响,导致集成电路的性能严重下降甚至功能丧失。
如何提高集成电路以及其核心单元运算放大器的抗辐照能力,成为了迫切的需要。
本文设计的低功耗放大器,放大部分分为差分输入级、中问增益级、缓冲输出级三个部分,偏置电路为整个系统提供偏置。
通过线路与版图的优化设计,降低了放大器的功耗。
采用SOI工艺,有效的提高了抗辐照能力。
1 电路设计本文设计的低功耗放大器从功能上可以划分为差分输入级、中问增益级、缓冲输出级以及偏置电路四部分。
外部微弱信号经差分输入级进行初级放大,放大后的信号经过中问增益级进行电平转换以及进一步增大,最终放大后的信号经过缓冲输出级进行互补推挽输出。
图1为低功耗放大器结构原理图,其中Q2与Q3组成输入级差分对,在提供增益的同时提高共模抑制比,降低输入级失调电压。
Ql0、Q11作用为跟随器,提供了良好的输入信号隔离。
012为中问放大级,对初级放大信号进行进一步放大,增益可达60dB。
其支路上的电流源为增益级提供偏置电流,并可作为Q12的负载,以得到尽量高的负载电阻,从而提高电压增益。
科学论文中的学术不端:案例分析

h
21
观察思考评论 抄袭和一稿多投 – 刊物处理
刊物处理: 1. 论文或更正或撤销等等,应该发表公开; 2. 禁刊作者,应该一视同仁; 3. 问题严重或作者有异议时,可以通告作者单位; 4. 涉及国家奖励或院士选举等重大事项时,通告相 关主持单位;
2001-2010年,10年间CPL共发表论文: 8425篇 到2011年底,被举报有不端嫌疑的论文:22篇 经查证,的确有学术不端的:17篇
其它争议,但不属学术不端的: 5篇
h
6
概况(Chinese Physics Letters)
学术不端类型 严重抄袭 (数据等实质内容) 轻度抄袭 (描述性文字等) 接近抄袭 (引用不当) 一稿多投或自我抄袭
Optics Letters, 23, 485 (1998) Applied Optics, 38, 3399 (1999) 侵权事实:CPL论文的主要实验结果系抄袭自OE论文,不少文 字叙述也抄袭自以上三篇论文,未引用。
背景或起因:主要责任人为新任教授,急于出成绩。
刊物处理: 1.主编撤消论文(Vol. 24, No.4 (2007) 112); 2.禁刊五年; 3.通告中国物理学会出版委员会; 4.通告所有作者单位和资助单位;
署名不当
论文数 4 3 2 6 2
处理(论文,作者,单位) 主编撤消论文 禁刊数年,通报相关单位 作者更正 禁刊数年 作者补充
撤消侵权论文 禁刊数年,通报对方刊物 作者更正或撤消论文 告诫或禁刊数年
总计17篇,占发表论文比例为0.20%;
Minority Carrier Lifetime in As-Grown Germanium Doped Czochralski Silicon
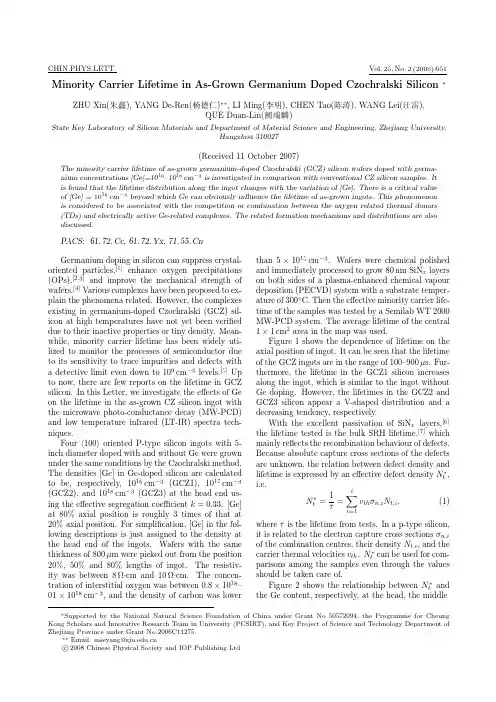
CHIN.PHYS.LETT.Vol.25,No.2(2008)651 Minority Carrier Lifetime in As-Grown Germanium Doped Czochralski Silicon∗ZHU Xin(朱鑫),YANG De-Ren(杨德仁)∗∗,LI Ming(李明),CHEN Tao(陈涛),WANG Lei(汪雷),QUE Duan-Lin(阙端麟)State Key Laboratory of Silicon Materials and Department of Material Science and Engineering,Zhejiang University,Hangzhou310027(Received11October2007)The minority carrier lifetime of as-grown germanium-doped Czochralski(GCZ)silicon wafers doped with germa-nium concentrations[Ge]=1016–1018cm−3is investigated in comparison with conventional CZ silicon samples.It is found that the lifetime distribution along the ingot changes with the variation of[Ge].There is a critical value of[Ge]=1016cm−3beyond which Ge can obviously influence the lifetime of as-grown ingots.This phenomenon is considered to be associated with the competition or combination between the oxygen related thermal donors (TDs)and electrically active Ge-related complexes.The related formation mechanisms and distributions are also discussed.PACS:,61.72.Yx,Germanium doping in silicon can suppress crystal-oriented particles,[1]enhance oxygen precipitations (OPs),[2,3]and improve the mechanical strength of wafers.[4]Various complexes have been proposed to ex-plain the phenomena related.However,the complexes existing in germanium-doped Czochralski(GCZ)sil-icon at high temperatures have not yet been verified due to their inactive properties or tiny density.Mean-while,minority carrier lifetime has been widely uti-lized to monitor the processes of semiconductor due to its sensitivity to trace impurities and defects with a detective limit even down to109cm−3levels.[5]Up to now,there are few reports on the lifetime in GCZ silicon.In this Letter,we investigate the effects of Ge on the lifetime in the as-grown CZ silicon ingot with the microwave photo-conductance decay(MW-PCD) and low temperature infrared(LT-IR)spectra tech-niques.Four 100 oriented P-type silicon ingots with5-inch diameter doped with and without Ge were grown under the same conditions by the Czochralski method. The densities[Ge]in Ge-doped silicon are calculated to be,respectively,1016cm−3(GCZ1),1017cm−3 (GCZ2),and1018cm−3(GCZ3)at the head end us-ing the effective segregation coefficient k=0.33.[Ge] at80%axial position is roughly3times of that at 20%axial position.For simplification,[Ge]in the fol-lowing descriptions is just assigned to the density at the head end of the ingots.Wafers with the same thickness of800µm were picked out from the position 20%,50%and80%lengths of ingot.The resistiv-ity was between8Ω·cm and10Ω·cm.The concen-tration of interstitial oxygen was between0.8×1018–01×1018cm−3,and the density of carbon was lower than5×1015cm−3.Wafers were chemical polished and immediately processed to grow80nm SiN x layers on both sides of a plasma-enhanced chemical vapour deposition(PECVD)system with a substrate temper-ature of300◦C.Then the effective minority carrier life-time of the samples was tested by a Semilab WT2000 MW-PCD system.The average lifetime of the central 1×1cm2area in the map was used.Figure1shows the dependence of lifetime on the axial position of ingot.It can be seen that the lifetime of the GCZ ingots are in the range of100–900µs.Fur-thermore,the lifetime in the GCZ1silicon increases along the ingot,which is similar to the ingot without Ge doping.However,the lifetimes in the GCZ2and GCZ3silicon appear a V-shaped distribution and a decreasing tendency,respectively.With the excellent passivation of SiN x layers,[6] the lifetime tested is the bulk SRH lifetime,[7]which mainly reflects the recombination behaviour of defects. Because absolute capture cross sections of the defects are unknown,the relation between defect density and lifetime is expressed by an effective defect density N∗t, i.e.N∗t=1τ=ii=1v thσn,i N t,i,(1)whereτis the lifetime from tests.In a p-type silicon, it is related to the electron capture cross sectionsσn,i of the combination centres,their density N t,i,and the carrier thermal velocities v th.N∗t can be used for com-parisons among the samples even through the values should be taken care of.Figure2shows the relationship between N∗t and the Ge content,respectively,at the head,the middle∗Supported by the National Natural Science Foundation of China under Grant No50572094,the Programme for Cheung Kong Scholars and Innovative Research Team in University(PCSIRT),and Key Project of Science and Technology Department of Zhejiang Province under Grant No2006C11275.∗∗Email:mseyang@c 2008Chinese Physical Society and IOP Publishing Ltd652ZHU Xin et al.Vol.25and the tail of the silicon ingots.It illustrates that N ∗t decreases with [Ge]in the head end of ingot,while it increases slowly in the middle and fast in the tail end of the ingots.It obviously shows an inhibition of Ge on the defects at the head end of the ingot,but a promotion in tail end of the ingot.Fig.1.Lifetime distributions along the growth direction of the silicon ingots doped with and without germanium.The Ge densities at the head end of the GCZ1,GCZ2and GCZ3silicon ingots are about 1016,1017and 1018cm −3,respectively.Fig.2.Effective density N ∗tof the trap levels versus [Ge]of the samples.N ∗tis calculated as the inverse of lifetime data from Fig.1.The tendency of N ∗t in the head end is consistent with the dependence of the TDs on [Ge],as shown in Fig.3,suggesting strongly a TDs dominating be-haviour.The relationship between the concentration of TDs ([TD])and [Ge]is in agreement with the re-ported results.[8,9]Figure 3shows the LT-IR spectra of the samples with [Ge]=1016,1017and 1018cm −3,respectively.The peaks are assigned to the thermal double donors (TDDs)by Wagner and Hage.[10]The samples were annealed at 450◦C to simulate a pro-longed process of cooling,and a 650◦C/30min pre-treatment was used to remove the grow-in TDs.The total concentration of TDs was calculated according to ASTM F723-88with the resistivity before and af-ter the annealing at 450◦C.Fig.3.LT-IR spectra of the samples GCZ1,GCZ2and GCZ3,respectively.All the samples are treated at 650◦C/30min +450◦C/6h annealing.Inset:the total donor concentration [TD]versus [Ge].Meanwhile,the complexes formed at high temper-ature during the cooling of the ingot are responsible for the lifetime in the tail end.When [Ge]gets up to 1018cm −3,the lifetime of ingot is totally dominated by the Ge-related complexes,which is attributed to the most elementary and electrically active Ge-vacancyNo.2ZHU Xin et al.653(GeV)[11,12]and GeVO (GeV with an additional oxy-gen atom).[13]In fact,Ge-related complexes are always changing during the cooling of ingot.Yang et al .[14]have,based on their experiments,pointed out that the Ge atom can firstly capture a mono-vacancy forming GeV com-plex typically beyond 1100◦C,and then the interstitial oxygen atoms to form GeVO or even larger complexes GeVO n (n ≥2),which can act as the nuclei of the OPs [15]and are supposed to be electrically inactive.Even at lower temperature for the formation of TDs,GeV is supposed to capture oxygen dimer,the precur-sor of the TDs,[16]to form GeVO 2and thus to inhibit the formation of TDs.[17]Consequently,electrically ac-tive complexes increase along the axis of GCZ3ingot doped with [Ge]=1018cm −3,which results in the decreasing lifetime distribution.Unfortunately,the grown-in Ge-related complexes are failed to be de-tected by DLTS in the as-grown silicon wafers mostlydue to their tiny absolute density.It should be noted that the grow-in tiny oxy-gen precipitates (OPs)[18]are not enough to induce extended defects,so they have little gettering abil-ity.As a result,they trend to perform electrical neutrality.[19]Furthermore,they have a positive de-pendence on [Ge],[8]which is opposite to the tendency of N ∗t .Thus the grow-in OPs are excluded from the dominating factors.Based on the above discussions,the effects of TDs and Ge-related complexes on the distribution of N ∗t is schematically shown in Fig.4.It can be seen that in all Ge-doped ingots,the TD-related levels decrease by the axial position of ingot,while the Ge-related levels increase.Their relative densities could be con-trolled by the level of Ge-doping,and the competing results between them would determine the tendency of lifetime along the ingot.Fig.4.Schematic diagram on the distribution of effective traps (line with symbol)with the contributions of both TDs (dashed)and the Ge-related complexes (dot-dashed).In summary,Ge doping could have strong effects on the lifetime of as-grown silicon ingot.Apparently 1016cm −3is a critical value of [Ge]beyond which Ge can obviously influence on the lifetime of as-grown in-got.The effects of Ge-doping on lifetime involve both oxygen atoms and vacancies.[TD]decreases by the axial position of ingot,which plays a major role in both Ge-clean and lightly Ge-doped as-grown CZ sil-icon ingot.Meanwhile,electrically active Ge-related complexes involving vacancies act as the recombina-tion levels with an increasing density by the axial po-sition of ingot.The effects on lifetime of such two kinds of levels are comparable to each other within the range of [Ge]=1016–1018cm −3.As a result,it is apparent that the lifetime of ingots distributes highly sensitive to the level of Ge-doping.References[1]Carbonaro C M,Fiorentini V and Bernardini F 2002Phys.Rev.B 66233201[2]Yu X et al 2003J.Cryst.Growth 250359[3]Yang D et al 2002J.Cryst.Growth 243371[4]Taishi T,Huang X,Yonenaga I and Hoshikawa K 2003Mater.Sci.Semicond.Proc.5409[5]Palais O,Yakimov E and Martinuzzi S 2002Mater.Sci.Engin.B 91/92216[6]Touˇs ka J et al 2006J.Appl.Phys .100113716[7]Schroder D K 1997IEEE Trans.Electron.Devices 44160[8]Li H et al 2004J Phys:Condens Matter 165745[9]Hild E,Gaworzewski P,Franz M and Pressel K 1998Appl.Phys.Lett.721362[10]Wagner P and Hage J 1989Appl.Phys.A:Solid.Surf .49123[11]Watkins G D 2000Mater.Sci.Semicond.Processing 3227[12]Budtz-Jorgensen C V,Kringhoj P and Nylandsted LarsenA 1998Phys.Rev.B 581110[13]Markevich V P et al 2004Phys.Rev .B 69125218[14]Yang D and Chen J 2005Defect and Diffusion Forum 242-244169[15]Chen J et al 2006J.Cryst.Growth 29166[16]Murin L I,Hallberg T,Markevich V P and Lindstr¨o J L1998Phys.Rev.Lett.8093[17]Zhu X et al 2008Solid State Phenomena 131-133393[18]Kobayashi S 1997J.Cryst.Growth 174163[19]Lee B Y,Hwang D H and Kwon O J 1998Jpn.J.Appl.Phys.37L902。
学术假造相关案例及学术诚信方面的问题分享
3.4案例04LMK:一稿多投
相关论文:Chin. Phys. Lett. 21, 393 (2004 Feb.) J. Appl. Phys. 95, 755 (2004 Jan.)
一稿(同事或交叉)多头的事实经过: 2003-07-21 作者先投稿Appl. Phys. Lett. (APL) 2003-09-25 收到APL退稿,作者请转JAP 2003-10-09 作者又几乎同时投稿CPL 2003-10-27 收到JAP通知,接受发表 2003-11-05 收到CPL要求修改的审稿报告。不主动撤稿,不通报JAP接 受,也不引用,修改和‘添加’了少量次要内容后继续要求CPL发表。
第4页 竢实扬华,自强不息
一、学术造假相关案例分享
哈佛“心机”教授造假
近日,学术圈的一条地震级新闻又双叒叕刷屏了。消 息称,哈佛大学要求撤稿前哈佛医学院教授Piero Anversa博士,总计31篇关于心脏干细胞的研究论文。 随着这条震惊学术界的消息发表,31篇有关心脏干细 胞的文献宣布撤稿。这就意味着,所有关于“证实心 脏干细胞存在”的论文和引用了这些文献的论文,全 部被废! 这些论文此前大多发布在诸如柳叶刀、著名心血管期 刊Circulation等顶级刊物上,被广泛阅读和大量引用。 比如其中一篇在2011年发表的论文,发表3年内就被 引用超过300次,论文的影响力可见一斑。
Optics Letters, 23, 485(1998) Applied Optics, 38, 3399(1999) 侵权事实:CPL论文的主要实验结果系抄袭自OE论文,不少 文字叙述也抄袭自以上三篇论文,未引用。
背景或起因:主要责任人为新任教授,急于出成绩。
刊物处理: 1.主编撤销论文(Vol. 24, No.4 (2007) 112); 2.禁刊五年; 3.通告中国物理学会出版委员会; 4.通告所有作者单位和资助单位;
量子网络实现最优1→3相位协变量子克隆
量子网络实现最优1→3相位协变量子克隆张文海;张月【摘要】利用最简单的两种量子逻辑门,即:量子旋转门和量子控制非门构成的量子网络实验量子克隆.选择不同的参数,量子网络可以实现最优1→3相位协变量子克隆.由于所采用的是普适的单比特逻辑门,这为不同的物理系统实现相位协变量子克隆提供了通用的方法.【期刊名称】《淮南师范学院学报》【年(卷),期】2016(018)003【总页数】4页(P100-103)【关键词】量子网络;量子旋转门;量子控制非门;相位协变量子克隆【作者】张文海;张月【作者单位】淮南师范学院电子工程学院,安徽淮南232038;淮南师范学院电子工程学院,安徽淮南232038【正文语种】中文【中图分类】O413量子信息科学是量子力学和信息科学的结合,量子信息学的研究是利用量子力学基本原理,发挥量子相关特性的作用,用一种新的方式进行计算,编码和信息传输。
目前,无论在理论上还是在实验上,量子信息的研究都在取得新的进展,已经发展成为内容十分丰富的新学科①郭光灿:《量子信息科学在中国科学技术大学的兴起和发展》,《物理》2008年第2期,第556-561页。
它包括量子计算,量子信息,量子通信和量子博弈等。
在量子信息中,利用量子力学基本原理构建的量子算法已经显示出经典算法上无法比拟的优越性。
而且,也使得在量子力学中出现许多新颖的问题和有趣的应用。
在经典信息科学中,最基本的单元是逻辑门,有一位逻辑门和二位逻辑门。
同样,量子信息学中,最基本的单元是量子逻辑门。
经典和量子逻辑门的本质区别是,量子逻辑门是可逆的,这就解决了经典计算机的能耗问题②李艳玲:《量子态克隆、翻转及隐形传送的理论研究》,聊城大学硕士学位论文,2007年。
对于量子信息的操作,可以利用由基本量子逻辑门组成的量子网络来完成,因而,对量子网络的研究是量子信息中的一个基本研究方向。
众所周知,经典信息可以被精确的复制。
而量子信息学中有一个基本定理,即:量子不可克隆定理③Wootters W K,Zurek W H,"A single quantum cannot be cloned",Nature(London),1982,299,pp.802-803.,它指出:未知量子态不能被精确的复制。
多孔介质热质传递国外研究进展
多孔介质热质传递国外研究进展宋明启;王志国【摘要】给出了多孔介质热质传递研究的基本参数:孔隙率、比面、迂曲度、渗透率、毛细压力.从起始阶段、上升阶段、突破阶段、创新阶段4个典型阶段详细介绍了国外多孔介质热质传递研究的理论成果.初步探析了RMV和REV在多孔介质热质传递未来研究中的应用.为同行业研究者开展此类课题提供了有价值的文献借鉴和理论铺垫.【期刊名称】《低温建筑技术》【年(卷),期】2015(037)007【总页数】3页(P1-2,11)【关键词】多孔介质;热质传递;进展【作者】宋明启;王志国【作者单位】东北石油大学土木建筑工程学院,黑龙江大庆163318;东北石油大学土木建筑工程学院,黑龙江大庆163318;大连理工大学能源与动力工程学院,辽宁大连116024【正文语种】中文【中图分类】TQ021.3多孔介质是由多孔固体骨架构成,孔隙空间中充满单相介质或多相介质。
目前,多孔介质热质传递学已经拓展到很多技术领域和学科前沿,包括:能源材料、环境工程、化学科学、仿生学科、生物医药、农业水利等,逐渐已经成为边缘科学和交叉学科的一个潜在出发点。
在研究多孔介质热质传递过程中,经常涉及一些主要的基本结构参数和基本性能参数。
孔隙率,是指多孔介质内微小孔隙的总体积与多孔介质外表体积的比值。
根据研究的需要,又定义了:有效孔隙率、绝对孔隙率。
比面,是指多孔介质固体骨架总表面积与多孔介质总容积的比值。
迂曲度,是指多孔介质弯曲通道真实长度与连接弯曲通道两端的直线长度的比值的平方。
有的学者也认为迂曲度,是指多孔介质弯曲通道真实长度与连接弯曲通道两端的直线长度的比值倒数的平方,目前学术界没有统一定论。
渗透率,是指在一定流动驱动力推动下,流体通过多孔介质的难易程度。
渗透率又分为:绝对渗透率、相渗透率、相对渗透率。
毛细压力,是指两种互不相溶的流体接触时,它们各自的内部压力在接触面上存在着不连续性,两压力之差[1]。
(1) 起始阶段。
宁波大学主要学术期刊和出版社目录(教职工用)2014——2014年之后发表论文以此为准
2014版宁波大学主要学术期刊和出版社目录(教职工用)
关于主要学术期刊目录的说明:
1.2014版宁波大学主要学术期刊目录(教职工用)主要由以下四个数据库整合而成:①中文社会科学引文索引(CSSCI)来源期刊(2012-2013年核心版);②中国科学引文数据库(CSCD)来源期刊(2013-2014年核心版);③浙江大学国内期刊名录2012年版;④2013年《科学引文数据库》(SCD)来源期刊(部分)。
2.本目录学术期刊分为A、B、C三类。
A类包括SCI、EI、SSCI和A&HCI收录的学术期刊论文以及人文社科类的权威期刊(A1类)20种和A2类学术期刊13种;B类411种(包括中国人民大学报刊复印资料(全文复印).学术类专题期刊92种),C类1270种。
国内一级出版社50个,延用宁波大学2010版目录。
个)。
- 1、下载文档前请自行甄别文档内容的完整性,平台不提供额外的编辑、内容补充、找答案等附加服务。
- 2、"仅部分预览"的文档,不可在线预览部分如存在完整性等问题,可反馈申请退款(可完整预览的文档不适用该条件!)。
- 3、如文档侵犯您的权益,请联系客服反馈,我们会尽快为您处理(人工客服工作时间:9:00-18:30)。
The polarization characteristics of single shot nanosecond laser-induced breakdown spectroscopy of Al∗Liu Jia(刘佳),Tao Hai-Yan(陶海岩),Gao Xun(高勋),Hao Zuo-Qiang(郝作强),and Lin Jing-Quan(林景全)†Changchun University of Science and Technology,Changchun130022,China(Received5July2012;revised manuscript received27September2012)The polarization-resolved laser-induced breakdown spectroscopy(PRLIBS)technique,which can significantly reduce the polarized emission from laser plasma by placing a polarizer in front of the detector,is a powerful tool to improve the line-to-continuum ratio in LIBS applications.It is shown that the continuum emission from the plasma produced through ablating an Al sample by nanosecond laser pulses is much more polarized than the discrete line emission with the single-pulse PRLIBS technique.The effects of laserfluence and detection angle on the Al polarization spectrum are systematically explored experimentally.The calculated result of the polarization spectrum as a function of laserfluence shows that it is in agreement with the experimental observations.Keywords:polarization-resolved laser-induced breakdown spectroscopy,laser plasma,S/N ratioPACS:42.62.Fi,52.38.Mf DOI:10.1088/1674-1056/22/4/0442061.IntroductionLaser-induced breakdown spectroscopy(LIBS)is one of the most promising options for the rapid,quasi-nondestructive,and standoff determination of the elemental composition of materials in numerous applications such as environment monitoring,[1–4]explosive residue detection,[5,6] biomedicine,[7–9]and space exploration.[10,11]This technique is based on the observation of emission from excited atomic, ionic,and other particles produced in plasma formed by the focused laser irradiation on a sample.It is well known that a typical laser induced plasma spectrum consists of a series of discrete lines covered by a broadband continuum.Although LIBS has been applied to variousfields,it is still lacking in sensitivity,reliability,precision,and accuracy compared with other analytical techniques.One of the major reasons for that is the presence of strong continuum background radiation at the early stage of plasma evolution.[12–16]In order to improve the LIBS technique,different meth-ods have been introduced to suppress the continuum emission or enhance the line intensity.Time-resolved laser-induced breakdown spectroscopy is the most well-known technique to reduce the effect of the continuum by using an expensive intensified charge-coupled device(ICCD)camera and a ap-propriate delay time before each measurement.[17,18]Another technique usually used is dual pulse LIBS which can enhance the intensities of discrete lines,but this technique is also highly dependent on experimental conditions.[19,20]Recently,a new technique called polarization-resolved laser-induced breakdown spectroscopy(PRLIBS)has emerged,which can significantlyfilter out the continuous background and increase line-to-continuum ratio by placing a polarizer in front of the detector of a non-gated CCD cam-era.Liu et al.[21]and Penczak et al.[22]have systematically investigated the dependence of polarization of plasma emis-sion of an Al sample on experimental parameters such as laser pulse energy,focal position,incident angle,detection angle, and laser polarization with a femtosecond laser,and found that continuum emission is much more polarized than dis-crete line emission from the plasma.In addition,they also studied the effects of laser pulse energy and laser focus po-sition on polarization spectrum by using nanosecond laser pulses.[23]However,Asgill et al.[24]found that there is no sig-nificant polarization difference between the continuum and discrete emission from N2,steel,and Cu samples.This ap-parent discrepancy could be reduced when laserfluence and polarization are taken into account.[22]The polarization of the plasma needs more detailed investigations,which is important for the optimal design of the detection system of a practical LIBS instrument based on the discrimination of the continuum obtained using the technique.In the present paper,we focus on the polarization characteristics of optical emission from the single nanosecond pulse ablation of Al samples at relatively low laser energy,and systematically investigate the influences of laser pulse energy and detection angle on the polarization characteristic.The experimental results are compared with the calculated results using an established theoretical model of continuum emission from plasma.The underlying mecha-nism of the polarization spectrum as a function of laserfluence∗Project supported by the National Natural Science Foundation of China(Grant Nos.60978014,11074027,61178022,11274053,and11211120156),the Funds from Science and Technology Department of Jilin Province,China(Grant Nos.20090523,20100521,20100168,and20111812),and Funds from Education Department of Jilin Province.†Corresponding author.E-mail:linjingquan@©2013Chinese Physical Society and IOP Publishing Ltd /cpb which is in agreement with the experimental observations is analyzed.2.Experimental setupThe experimental setup used in this work is sketched in Fig.1.A single pulse of8-ns duration at wavelength of 1064nm from the YAG laser is focused on the sample sur-face by a convex lens(L1,f=25mm).A half-wave plate (HWP1)and a Glan–Taylor polarizer(P1)are employed to adjust the pulse energy.Another half-wave plate(HWP2)is used to change the polarization of the incident laser.Polished aluminum alloy samples are mounted on a computer-driven three-dimensional(3D)stage(Sigma,Inc.)which can supply a fresh surface for each laser shot.The incident laser beam is horizontally polarized and perpendicular to the sample sur-face.Our detection system is also in the horizontal plane(x–y plane in Fig.1).Emission from the plasma is focused onto an opticalfiber by a pair of lens(L2and L3)with focal lengths of75mm and35mm respectively.A Glan–Thompson polar-izer(P2)is installed between the two collecting lens to reduce polarized optical emission from the plasma.The intensity of transmitted spectrum after the polarizer depends on the angle of the polarizer.We continuously rotate the polarizer in steps of20◦and take15spectra at each polarizer angle.We use afil-ter bank to eliminate the possible influence from fundamental laser light.The optical emission from the laser induced plasma passes through a spectrograph(SpectraPro2500i,Princeton Instruments,Inc.)with a150-groove grating blazed at550nm and a non-gated CCD camera(Princeton Instruments Inc.)is used to record the spectra.The exposure time of200ms is used in our experiment.targetL1HWP1HWP2P1zyxP2L3fliterfiberL2spectrographCCDcomputer αFig.1.(color online)Schematic plot of the experimental setup.The intensity of spectrum depends on the angle of the po-larizer.The magnitude of the polarization P at each wave-length is determined by P=(I MAX−I MIN)/(I MAX+I MIN). The P is calculated by choosing the minimal spectral intensity denoted as I MIN and maximal represented as I MAX from among 18polarizer angle settings.Each spectrum is an average of15 spectra.3.Experimental resultsparision of emission intensities with LIBS andPRLIBSFigure2shows LIBS and PRLIBS spectra taking with Al target for horizontally polarized single laser shot at45◦of de-tection angle with laserfluence of10J/cm2.Figure2(a)shows conventional LIBS spectrum obtained without the polarizer. The spectrum contains a strong and broad continuum,espe-cially in a wavelength range of400nm–580nm.Figure2(b) shows a typical PRLIBS spectrum at minimum transmission angle of the polarizer.In this case,most of the continuum is suppressed by the polarizer and it is interesting to note that some weak peaks which are submerged in the continuum like Al II at443.28nm and Cu II at455.59nm become distin-guishable.From Fig.2we can see a comparison made in terms of the improvement of the signal-to-noise ratio(S/N) and the signal-to-background ratio(S/B).This enhancement is particularly evident from the Al II peak at422.80nm.In the case of conventional LIBS,the S/N and S/B are52.5and 1.08whereas in the case of PRLIBS,they are112.5and3.13, respectively.The S/N and S/B of PRLIBS spectrum are nearly 2and3times higher than those of LIBS spectrum,respec-tively.The polarization spectrum which is used to determine P in0.25-nm interval is shown in Fig.2(c).It clearly shows129634.21.50.51.04321400450550650500600Wavelength/nm1.00.80.60.4PRLIBSpolarizationPRLIBSLIBSAlII422.8nmFeI445.43nmFeI588.89nmCuI453.8nmFeI445.43nmCuI453.8nmCuII455.59nmAlI396.15nmAlII422.8nmAlII443.28nmIntensity/13Intensity/13Intensity/13PolarizationDEFFig.2.(color online)Typical spectra of PRLIBS and polarization spec-tra,the spectra of Al plasma are taken at45◦of detection angle with laserfluence of10J/cm2.The spectra are taken without the polarizer(a),and with polarizer(b).The polarization spectra are calculated by15spectra for each wavelength.A PRLIBS spectrum is plotted in panel(c)for comparison.that the continuum emission is strongly polarized with the po-larization almost exceeding 80%in the detection region but the discrete lines are much less polarized.All the peaks in the PRLIBS spectra correspond to dips in the polarization spec-trum as shown in Fig.2(c).3.2.Dependence of the emission intensity in PRLIBS onlaser parameters Figure 3shows the dependences of the emission inten-sities for LIBS (Fig.3(a))and PRLIBS (Fig.3(b))on laser fluence at detection angle of α=45◦with horizontally po-larized single laser shot,and polarization spectra (Fig.3(c))calculated based on Fig.3(b).We can see clearly that the LIBS spectra are dominated by the strong and broadband continuum with laser fluences of 10J/cm 2,20J/cm 2,and 40J/cm 2re-spectively,and the intensities of continuum and discrete lines both increase with laser fluence increasing.After the polarizer is used,the continuous emission is effectively suppressed as shown in the PRLIBS spectra,which has also been demon-strated by other groups.[21]In both cases,the intensity vari-ations of continuum and discrete lines have the same trend with the increase of laser fluence.This behavior may be ex-plained by the fact that an increase in laser fluence produces a larger ablation rate [23–25]and larger number density of excited species.However,there are noticeable differences between the two cases.For example,some line emission in a wavelength range of 400nm–470nm cannot be well distinguished in theP o l a r i z a t i onI n t e n s i t y /103I n t e n s i t y /1031510508.07.03.01.500.80.4400500600700Wavelength/nm(c)(b)(a)10 J/cm 220 J/cm 240 J/cm 2Fig.3.(color online)Effect of laser fluence:LIBS spectra (a)and PRLIBS spectra (b)taken at 45◦detection angle with laser fluences of 10J/cm 2,20J/cm 2,and 40J/cm 2;(c)polarization spectra.LIBS spectra,while they become prominent in the PRLIBS spectra.The calculated polarizations of PRLIBS spectra at different laser fluences are plotted in Fig.3(c).We can clearly see that the value of polarization decreases with laser fluence increasing.At the lowest laser fluence,the polarization of the continuum is above 0.8nearly in the whole detection range,while the polarizations of discrete lines are much lower than the polarizations of adjacent continuum emission.Therefore we observe the discrete lines as dips in the polarization spec-trum.With the increase of laser fluence,the polarizations of continuum and discrete lines decrease and the difference of the polarizations between continuum and discrete lines becomes smaller.It indicates that an increasing temperature of elec-tron,owing to the enhancement of laser fluence,affects the polarization.P o l a r i z a t i o nI n t e n s i t y /103I n t e n s i t y /103128405.01.51.00.500.80.60.430O 45O 60O(a)(b)(c)400500600700Wavelength/nmFig.4.(color online)Effects of detection angles;(a)PRLIBS spec-tra taken with laser fluence of 10J/cm 2at 30◦,45◦,and 60◦detection angles;(b)polarization spectra.The effects of detection angle on the emission intensi-ties in PRLIBS and polarization spectra are also investigated.Figure 4shows the dependences of PRLIBS and polarization spectra at laser fluence of 10J/cm 2on detection angles of α=30◦,45◦,and 60◦with horizontally polarized single laser shot respectively.In Fig.4(a),PRLIBS spectra at minimum transmission of the polarizer are shown.It is found that,at 45◦detection angle,the peaks are more noticeable than those at the other two angles.Figure 4(b)shows the polarization spectra at different detection angles.We can see that the polarization spectra are strongly influenced by the detection angle,more-over,the effect of detection angle on polarization is more sig-nificant at longer wavelengths than at shorter wavelengths.Asshown in Fig.4(b),atα=45◦detection angle,the polariza-tions of continuum are above0.85in the whole detection range and the polarizations of discrete lines are quite low.There are slight differences in polarization at shorter wavelength among the three detection angles,whereas at longer wavelengths the differences are much more obvious.At45◦,the polarization is relatively stable,and at30◦detection angle,the polariza-tion declines slightly with wavelength increasing,whereas un-der the condition of60◦detection angle,the polarizations fall down dramatically,particularly at longer wavelengths.4.DiscussionThe underlying physics responsible for the effect of laser polarization has been discussed in previous studies,[22,26] while the effect of laserfluence has not been discussed the-oretically yet.Some theoretical and experimental studies demonstrated that the bremsstrahlung[22,27–30]and recombi-nation radiation[31,32]are linearly chberg and Weisheit[33]investigated the polarization of recombination ra-diation by using the differential cross section for recombina-tion and the anisotropy of the electron velocity distribution with a net drift u DP(ω)=3βΓcos2ρsin2αf220f0+βΓf2(3sin2α−2)(1)whereωis the frequency of a photon from recombination ra-diation,βΓis the anisotropy parameter in excited stateΓ,ρis the angle between the coordinate system of measurement and the coordinate system of the line of sight,and the angle is0here,αis the angle between symmetry axis of the plasma and the direction of detection,f0and f2are the monopole and quadrupole moments of the distribution,respectively,which can be expressed with the same proportionality constant ac-cording to the result of Milchberg and Weisheit[33]f0∝S(η,ξ),f2∝−52S(η,ξ)+152∂2S(η,ξ)∂η.(2) The expression of S(η,ξ)can be given asS(η,ξ)=2∞∑n=0(−ξ)nn!d2ndη2nsinhηη,(3) which is characterized by two dimensionless quantitiesη=[2m e(¯hω−χΓ)]1/2u Dk B T(4) andξ=¯hω−χΓk B T(1−T /T⊥),(5) where T and T⊥are the electron thermal motions parallel and perpendicular to a symmetry axis,respectively;m e is the elec-tron mass,χΓis the binding energy of stateΓ,and k B is the Boltzmann constant.In the limitξ→0,the degree of polarization atα=π/4 detection angle isP(η)=3βΓ3ηcoshη−(3+η2)sinhη4(βΓ−2)η2sinhη+3βΓ[(1−η2)sinhη−ηcoshη].(6)In the case of limitη→0,the polarization P of recombi-nation radiation atα=π/4can be expressed asP(ξ)=3βΓ∞∑n=0(−ξ)n n/(2n+1)(2n+3)n!∞∑n=04−βΓn2n+3(−ξ)n(2n+1)n!.(7)The expressions of P as functions ofηandξfor the spe-cial caseβΓ=2(K-shell capture)are plotted in Figs.5and 6,respectively.For simplicityβΓ=2is chosen,which does not affect the calculation results.One of reasons responsi-ble for the polarization of line emission is anisotropic velocity distribution,which arises from Maxwellian distributions with different temperatures in different directions in a nanosecond plasma.[34]Other possible mechanisms leading to polarization have been proposed,such as heavy particle collision,recom-bination mechanism,forbidden line emission due to electric field,self-alignment due to radiation trapping,etc.[35]For thefirst case as shown in Fig.5,only the electron tem-perature is considered,which rises in a certain range with the increase of laserfluence because the effect of laserfield varia-tion on net drift u D can be neglected.According to Eq.(4),ηdecreases with temperature increasing.As shown in Fig.5,the decreasing ofηleads to a lower value of P.Therefore,P(η) decreases with laser frequency increasing in this case.In the second case as shown in Fig.6,the value of T /T⊥keeps constant with the increase of temperature for a given ve-locity direction.[36]According to Eq.(5),if T /T⊥≥1,then ξ≤0andξapproaches to zero with the increase of tempera-ture;If T /T⊥<1,thenξ>0andξalso approaches to zero with the increase of temperature.Furthermore,the P(ξ)also approaches to zero whenξapproaches to zero as shown in Fig.6.Therefore,polarization decreases with laserfluence increasing.0.50.40.30.20.100246ηβΓ=2P (η)Fig.5.(color online)Degree of polarization as a function of η.ξP (ξ)0.80.40-0.4-10-50510βΓ=2Fig.6.(color online)Degree of polarization as a function of ξ.Based on the above analysis,the value of P always de-creases with laser fluences increasing for both cases.This simulation results are in qualitative agreement with the exper-imental observations as shown in Fig.3(c).5.ConclusionA nanosecond single-pulse PRLIBS technique is system-atically studied in this paper.We observed that the continuum emission of laser induced plasma is strongly polarized but the discrete line emission is weakly polarized.The experimental results demonstrate that the polarization is very sensitive to the laser fluence and detection angle.The experimental results clearly show a considerable difference in polarization char-acteristic between the continuum emission and discrete line emission,which should be related to the different generation mechanisms of the continuum and discrete line emissions.Our experimental results suggest that the use of a polarizer is an effective way to filter out the background,thereby improving the S/N and S/B ratios of the discrete line spectrum.Our cal-culated results could be used to explain the polarization char-acteristics of the emission from a laser induced plasma to a certain extent.However,further investigations are needed to explore the underlying mechanism.References[1]Ferreira E C,Anzano J M,Milori D M B P,Ferreira E J,Lasheras R J,Bonilla B,Montull-Ibor B,Casas J and Neto L M 2009Appl.Spectrosc.631081[2]Essington M E,Melnichenko G V ,Stewart M A and Hull R A 2009Soil.Sci.Soc.Am.J.731469[3]Myriam B,Hao Z Q,Matthieu B,Yu J,Zhang Z and Zhang J 2007Chin.Phys.Lett.243466[4]Koch S,Garen W,M¨u ller M and Neu W 2004Appl.Phys.A 791071[5]Lucia F C D,Gottfried J L and Miziolek A W 2009Opt.Express 17419[6]Stearns J A,McElman S E and Dodd J A 2010Appl.Opt.49C8[7]Baudelet M,Guyon L,Yu J,Wolf J P,Amodeo T,Fr´e jafon E and LaloiP 2006Appl.Phys.Lett.88063901[8]Baudelet M,Yu J,Bossu M,Jovelet J,Wolf J P,Amodeo T,Fr´e jafon Eand Laloi P 2006Appl.Phys.Lett.89163903[9]Hrdliˇc ka A,Prokeˇs L,Staˇn kov´a A,Novotn´y K,Viteˇs n´ıkov´a A,Kan-ick´y V ,Otruba V ,Kaiser J,Novotn´y J,Malina R and P´a len´ıkov´a K2010Appl.Opt.49C16[10]Lanza N L,Wiens R C,Clegg S M,Ollila A M,Humphries S D,New-som H E and Barefield J E 2010Appl.Opt .49C211[11]Knight A K,Scherbarth N L,Cremers D A and Ferris M J 2000Appl.Spectrosc.54331[12]Feng Y ,Yang J J,Fan J X,Yao G X,Ji X H,Zhang X Y ,Zheng X Fand Cui Z F 2010Appl.Opt.49C70[13]Liu Q J,Fong S K,Cheng Andrew Y S,Luo S R,Tam K S,Zhu J Hand Viseu A 2012Chin.Phys.B 21087402[14]Yan L X,Zhang Y S,Zheng G X,Liu J R,Cheng J P and Lu M 2006Chin.Phys.152271[15]Park H S,Nam S H and Park S M J 2005Appl.Phys.97113103[16]Corsi M,Cristoforetti G,Hidalgo M,Iriarte D,Legnaioli S,PalleschiV ,Salvetti A and Tognoni E 2003Appl.Spectrosc.57715[17]Ursu C,Gurlui S,Focsa C and Popa G 2009Nucl.Instrum.Method B267446[18]Santagata A,Marotta V ,Orlando S,Teghil R,Zaccagnino M and Giar-dini A 2003Appl.Surf.Sci .208–209101[19]Asgill M E,Brown M S,Frische K,Roquemore W M and Hahn D W2010Appl.Opt .49C110[20]Vidal F,Chaker M,Goueguel C,Laville S,Loudyi H,Rifai K and Sab-sabi M 2008“Laser and Plasma Applications in Material Science”,First International Conference on Laser Plasma Applications in Ma-terials Science-LAPAMS’08.AIP Conference Proceedings ,USA 104725[21]Liu Y ,Penczak J S and Gordon R J 2010Opt.Lett.35112[22]Penczak J S,Liu Y M and Gordon R J 2011Spectrochim.Acta Part B66186[23]Borrielli A,Torrisi L,Margarone D,Caridi F and Mezzasalma A M2008Nucl.Instrum.Method B 2663968[24]Barcikowski S,Hahn A,Kabashin A V and Chichkov B N 2007Appl.Phys.A 8747[25]Scaffidi J,Pearman W,Carter J C,Colston B W and Angel S M 2004Appl.Opt.432786[26]Gluckstern R L and Hull M H 1953Phys.Rev.901030[27]Eslami Majd A,Arabanian A S and Massudi R ser Eng.48750[28]Gluckstern R L,Hull M H and Breit G 1953Phys.Rev.901026[29]Raimbault P A and Shohet J L 1972Phys.Fluids 151477[30]Motz J W and Placious R C 1960Il Nuovo Cimento 15571[31]Mohamed T,Andler G,Fogle M,Justiniano E,Madzunkov S andSchuch R 2011Phys.Rev.A 83032702[32]Yoneda H,Hasegawa N,Kawana S,Asai H and Ueda K 1998Workshopon Plasma Polarization Spectroscopy and the International Seminar on Plasma Polarization Spectroscopy ,26–28January,Kyoto,Japan,pp.247–254[33]Milchberg H M and Weisheit J C 1982Phys.Rev.A 261023[34]Sharma A K and Thareja R K 2007Appl.Surf.Sci.2533113[35]Sharma A K and Thareja R K 2005J.Appl.Phys.98033304[36]Chen F F 1974Introduction to Plasma Physics and Controlled Fusion(New York:Plenum Press)。