Use of EBSD to characterise high temperature
Wear-resistant amorphous SiC coatings produced
Surface and Coatings Technology116–119(1999)1024–1028www.elsevier.nl/locate/surfcoat Wear-resistant amorphous SiC coatings producedby plasma-enhanced CVDT.Blum a,*,B.Dresler a,St.Kaßner b,M.Hoffmann aa OSTEC Oberfla¨chen-und Schichttechnologie GmbH Meißen,Ossietzkystraße37A,D-01662Meißen,Germanyb Fakulta¨t Maschinenbau und Verfahrenstechnik,Lehrstuhl fu¨r Verbundwerkstoffe,TU Chemnitz,Straße der Nationen62,D-09111Chemnitz,GermanyAbstractThe use of plasma-enhanced CVD allows the deposition of thinfilms with relatively high coating rates at temperatures below 400°C and on substrates with a three-dimensional geometry.In this way,it is possible to deposit amorphous silicon carbide (a-SiC:H)on temperature-sensitive materials for tribological applications to replace ceramic materials that are difficult to process and expensive to manufacture.The aim of this paper is to examine the correlations between the deposition parameters and the resulting layer characteristics,using an excitation frequency of450kHz.©1999Elsevier Science S.A.All rights reserved. Keywords:Amorphous SiC coatings;Plasma-enhanced CVD;Wear resistance1.Introduction authors found that the composition of the layers andtheir properties are influenced by all deposition parame-ters.The most striking changes were observed when the In recent years,non-oxidic ceramic materials havebeen gaining growing importance because of their excel-methane/silane concentration ratio in the reactive gaswas varied.Meneve et al.[7]observed an optimum lent tribological characteristics.Furthermore,they havebeen used in high-temperature applications and under friction behaviour for the coatings deposited at a meth-ane volume fraction X(CH4)=0.7.corrosive and abrasive conditions.However,the manu-facture and processing of these materials are complicated Conventional CVD of SiC coatings requires depos-ition temperatures of about1000°C.In many cases,this and costly.The application of amorphous ceramic thinfilms deposited onto inexpensive substrate materials(e.g.leads to changed properties of temperature-sensitivesubstrates.In contrast,the use of plasma-enhanced CVD steel with sufficient strength)would be an alternative tominimize the processing difficulties.for depositing a-SiC:H allows a reduction in the depos-ition temperature below400°C.Amorphous silicon carbide(a-SiC:H)thinfilms havebeen widely investigated(e.g.[1,2]).Because of its The use of low excitation frequencies results in inten-sive ion bombardment duringfilm deposition.A high excellent physical and chemical properties,such as chem-ical stability and high thermal conductivity,SiC com-ion-energyflux influences hardness positively,asobserved by J.Vandentop et al.[9].Ion bombardment pounds produced by PECVD have been applied up tonow mainly for passivation and window layers in optical which leads to the activation of surface reactions is anessential condition for depositing hard adherent coatings and electronical applications[3,4].Moreover,there areother characteristics,such as excellent tribological prop-[10].Therefore,we used an excitation frequency of450kHz,which is in contrast to most other publications. erties,a low friction coefficient[5]and a high hardness,which make a-SiC:H a promising material for tribologi-cal coatings,too.Halverson and Vakerlis[6]carried out experiments2.Experimentalwith PACVD on three-dimensional substrates.TheA series of experiments have been performed toinvestigate the correlation between the deposition *Corresponding author.Tel.:+49-03521-46-35-70;fax:+49-03521-46-35-71.parameters and the resulting layer characteristics.The0257-8972/99/$–see front matter©1999Elsevier Science S.A.All rights reserved.PII:S0257-8972(99)00319-91025T.Blum et al./Surface and Coatings Technology 116–119(1999)1024–1028kept constant at 450kHz.Before deposition,each sub-strate was sputtered with H 2for 2h;in the case of thetemperature series,sputtering was carried out for 1.5h with H 2and for 0.5h with Ar.UV-VIS transmission spectroscopy (Shimadzu 3101)in the range between 400and 2000nm was used to determine the layer thickness and refractive index.Fourier-transformed infra-red spectroscopy (Bio-Rad FTS 175)in the wave number range between 4000and 400cm −1was performed on coated double-sidedpol-ished Si wafers to gain an insight into the established Fig.1.Schematic diagram of the plasma-enhanced CVD system.bonding structure.In order to determine the layer morphology and topography,surfaces and cross sections a-SiC:H coatings were deposited in a hot-wall PECVD were investigated by scanning electron microscopy reactor (Fig.1)on Corning 7059glass,silicon and steel (JSM-840A fabricated by JEOL).Samples (Si wafer)substrates using gas mixtures of silane and methane.were coated with carbon before the investigation was The reactant gases were introduced at a constant total performed.The surface roughness was determined using gas flow rate of 43.5sccm,and the methane volume a commercial profilometer (TK300produced by fraction X (CH 4)was 0.5or 0.7.The substrate temper-Hommelwerke GmbH).In order to determine the hard-ature ranged from 50to 250°C.The r.f.power and ness,the coatings were tested with a Shimadzu HMV-M pressure were varied (P RF:100…990W,p :4…11Pa).using the Vickers procedure with a static load of 0.25N for 10s.Throughout this study,the excitation frequency was(A)(C)(B)Fig.2.SEM micrographs of a-SiC:H coatings.(a)Surface;deposition parameter:p =5.5Pa,T =50°C,P r.f.=100W,X (CH 4)=0.7.(b)Surface;deposition parameter:p =11Pa,T =125°C,P r.f.=500W,X (CH 4)=0.7.(c)Cross-section of (b).1026T.Blum et al./Surface and Coatings Technology 116–119(1999)1024–10283.Results and discussionFrom SEM investigations of coatings produced at various pressures,temperatures and r.f.power levels,it was found that all layers show the same morphological structure.All deposits,including those produced at temperatures lower than 200°C,are dense and regular [Fig.2(a)and (b)].No cracks or holes could be found.This shows that the plasma-enhanced chemical vapor deposition is a suitable technique for coating temper-ature-sensitive materials.The samples that were pretreated in hydrogen and argon plasma before deposition show an intermediate layer beneath the deposited a-SiC:H layer [Fig.2(c)].Fig.4.Deposition rate vs.temperature.This intermediate layer is considered as native silicon oxide,which will be explained later in the text.The investigations of surface roughness were carried out on various substrates (Corning 7059glass,Si wafer,steel ).Even the layers with a film thickness of a few microns do not show any flattening of the substrate surface.Hence,the layer roughness is equal to the roughness of the substrate (R A=0.03m m for polishedSi wafer,R A=0.05m m for SiC coated Si wafer).The deposition rate depends almost linearly on the pressure,as can be seen from Fig.3.A similar behaviour was established by Lelogeais and Ducarroir [11].Deposition rates of up to 2.4m m /h have been achieved with a corresponding set of parameters.With increasing temperature,the deposition rate Fig.5.Hardness vs.temperature.decreases from 0.37to 0.18m m /h (see Fig.4).For tem-peratures above 200°C,the deposition rate remains constant.This result confirms the statement of Meneve[8],who observed a similar behaviour.In contrast,the hardness of the coatings slightly increases with increasing substrate temperature (Fig.5).This can be explained by the higher mobility of particles at the growing surface at higher temperatures,which eventually leads to a lower density of defect sites and to changed bonding configurations which is shown below.The refractive index vs.r.f.power is shown in Fig.6.Fig.6.Refractive index vs.r.f.power at three pressures.For r.f.levels below 300W,the refractive index decreases,between 300and 500W,it increases,and above 500W,it remains constant for r.f.values .The refractive index is independent of temperature (Fig.7).On the contrary,Young and Partlow [12]found a proportional dependence of the refractive index on substrate temperature,using a much higher pressure and an excitation frequency of 13.56MHz.We presume that the higher values of the Fig.3.Deposition rate vs.pressure at two r.f.power levels.refractive index of our layers are caused by an intensive1027T.Blum et al./Surface and Coatings Technology 116–119(1999)1024–1028Fig.7.Refractive index vs.temperature.Fig.9.FTIR spectra of various SiC-coated samples,sputtered with hydrogen and argon before deposition.ion bombardment due to the low excitation frequency.In this case,the substrate temperature has only a smallinfluence on the refractive index.In the FTIR spectra of samples pretreated with hydrogen plasma,oxygen could not be detected.However,in the spectrum of the untreated wafer,a band at about 1100cm −1(Si M O M Si stretching vibration)was found (Fig.8).It can be concluded that hydrogen plasma pretreatment is a suitable method to remove an oxide layer from the wafer.Incorporation of oxygen during the deposition could not be detected.All spectra of the temperature series show a clearly recognizable band at about 1100cm −1,also after subtraction of the wafer spectrum (Fig.9).It has already been mentioned that the temperature samples were pretreated first with a hydrogen plasma and then with an argon plasma.Thus,Fig.10.(Si M H 2)nbond bending in FTIR spectra of SiC-coatedwe conclude that pretreatment with a hydrogen plasma samples,deposited at various temperatures.has a more favourable influence regarding the elimination of silicon oxide than pretreatment with an argon plasma.(Fig.11).This can be interpreted as a splitting-o ffof The interpretation of FTIR spectra shows a decrease hydrogen from the Si M CH 3bonds at temperaturesin silicon polyhydride (Fig.10)and Si M CH 3in chain-above 50°C.Because the transformation of CH 2groupslike structures with increasing temperature.However,into carbon-bonded silicon already takes place com-the number of Si M C bonds increases with temperatureFig.11.Si M C stretching vibration mode in FTIR spectra of SiC-Fig.8.FTIR spectra of uncoated Si wafer and various SiC coated samples,sputtered with hydrogen before deposition.coated samples,deposited at various temperatures.1028T.Blum et al./Surface and Coatings Technology 116–119(1999)1024–1028pletely at room temperature,the Si M C absorption band Referencesat 740cm −1can also be seen in the spectrum of layers,which were deposited at 50°C [13].[1]M.M.Rahman,C.Y.Yang,D.Sugiarto,A.S.Byrne,M.Ju,K.Tran,K.H.Lui,T.Asano,W.F.Stickle,J.Appl.Phys.67(11)(1990)7064–7070.[2]Y.Tawada,M.Kondo,H.Okamoto,Y.Hamakawa,Journal de4.SummaryPhysique C4,42(10)(1981)471–474.[3]H.Frey,in:Du ¨nnschichttechnologie,VDI,Du ¨sseldorf,1987,It was found that the use of the plasma-enhancedp.531.[4]G.L.Harris,Amorphous and Crystalline Silicon Carbide andchemical vapor deposition enables the deposition of Related Materials,Springer,New York,1987.dense and regular a-SiC:H layers,even at temperatures [5]J.Meneve,R.Jacobs,L.Eersels,J.Smeets,E.Dekempeneer,lower than 200°C.Surf.Coat.Technol.62(1993)577–582.The surface roughness of these layers is equal to the [6]W.Halverson,G.D.Vakerlis,J.Vac.Sci.Technol.A 10(3)roughness of the substrates.(1992)439–443.The deposition rate depends mainly on the pressure [7]J.Meneve,E.Dekempeneer,R.Jacobs,L.Eersels,V.Van DenBergh,J.Smeets,Diamond Relat.Mater.1(1992)553–557.and the substrate temperature.Deposition rates up to [8]J.Meneve,E.Dekempeneer,R.Jacobs,L.Eersels,V.Van Den2.4m m /h have been achieved.Bergh,J.Smeets,Silicates Industriels 7–8(1992)117–122.The interpretation of FTIR spectra shows a decrease [9]G.J.Vandentop,M.Kawasaki,K.Kobayashi,G.A.Somorjai,in silicon polyhydride (Fig.10)and Si M CH 3in chain-J.Vac.Sci.Technol.A 9(3)(1991)1157–1161.like structures with increasing temperature.[10]S.Peter,R.Pintaske,F.Richter,G.Hecht,in:Thin Films,Proc.Joint 4th Int.Symp.Trends and New Appl.Thin Films —TATF ’94and 11th Conf.High Vacuum,Interfaces and Thin Films —HVITF ’94(1994)191–194.Acknowledgement[11]M.Lelogeais,M.Ducarroir,Surf.Coat.Technol.48(1991)121–129.This work was supported by Sa ¨chsisches [12]R.M.Young,W.D.Partlow,Thin Solid Films 213(1992)Staatsministerium fu ¨r Wirtschaft und Arbeit under con-170–175.[13]A.Bolz,thesis,Universita ¨t Erlangen,1991.tract number 2593.。
语言学 考研真题

语言学考研真题和答案第一章语言学Fill in the blanks1. Human language is arbitrary. This refers to the fact that there is no logical or intrinsic connection between a particular sound and the _______it is associated with. (人大2007研)meaning 语言有任意性,其所指与形式没有逻辑或内在联系2. Human languages enable their users to symbolize objects, events and concepts which are not present (in time and space) at the moment of communication. This quality is labeled as _______. (北二外2003研)displacement 移位性指人类语言可以让使用者在交际时用语言符号代表时间和空间上不可及的物体、事件和观点3. By duality is meant the property of having two levels of structures, such that units of the _______ level are composed of elements of the __________ level and each of the two levels has its own principles of organization. (北二外2006研)primary, secondary 双重性指拥有两层结构的这种属性,底层结构是上层结构的组成成分,每层都有自身的组合规则4. The features that define our human languages can be called _______ features. (北二外2006)design人类语言区别于其他动物交流系统的特点是语言的区别特征,是人类语言特有的特征。
芯锋胶合材料公司产品说明书
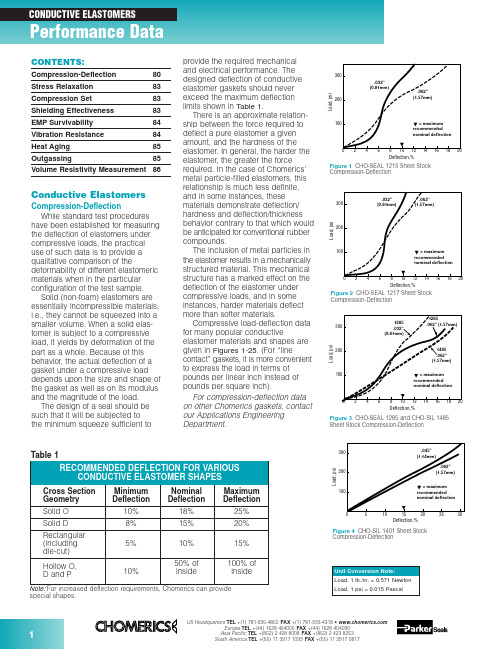
Figure 3CHO-SEAL 1285 and CHO-SIL 1485Sheet Stock Compression-DeflectionCompression-Deflectionspecial shapes.Conductive ElastomersCompression-DeflectionWhile standard test procedures have been established for measuring the deflection of elastomers under compressive loads, the practical use of such data is to provide a qualitative comparison of thedeformability of different elastomeric materials when in the particular configuration of the test sample.Solid (non-foam) elastomers are essentially incompressible materials;i.e., they cannot be squeezed into a smaller volume. When a solid elas-tomer is subject to a compressive load, it yields by deformation of the part as a whole. Because of this behavior, the actual deflection of a gasket under a compressive load depends upon the size and shape of the gasket as well as on its modulus and the magnitude of the load.The design of a seal should be such that it will be subjected to the minimum squeeze sufficient toprovide the required mechanical and electrical performance. The designed deflection of conductive elastomer gaskets should never exceed the maximum deflection limits shown in Table 1.There is an approximate relation-ship between the force required to deflect a pure elastomer a given amount, and the hardness of the elastomer. In general, the harder the elastomer, the greater the force required. In the case of Chomerics’metal particle-filled elastomers, this relationship is much less definite,and in some instances, these materials demonstrate deflection/hardness and deflection/thickness behavior contrary to that which would be anticipated for conventional rubber compounds.The inclusion of metal particles in the elastomer results in a mechanically structured material. This mechanical structure has a marked effect on the deflection of the elastomer under compressive loads, and in some instances, harder materials deflect more than softer materials.Compressive load-deflection data for many popular conductiveelastomer materials and shapes are given in Figures 1-25. (For “linecontact” gaskets, it is more convenient to express the load in terms of pounds per linear inch instead of pounds per square inch).For compression-deflection data on other Chomerics gaskets, contact our Applications Engineering Department.Compression-DeflectionCompression-DeflectionCONTENTS:Compression-Deflection 80Stress Relaxation 83Compression Set 83Shielding Effectiveness 83EMP Survivability 84Vibration Resistance 84Heat Aging 85Outgassing85Volume Resistivity Measurement86Figure 80.125 in. (3.18 mm) Dia. O-Strip Compression-DeflectionDeflection,%Compression-DeflectionCompression-DeflectionL o a d , l b ./i n c hDeflection, %Figure 210.156 in. (3.96 mm) High Hollow D-Strip Compression-DeflectionL o a d , l b ./i n c hDeflection, %Figure 220.312 in. (7.92 mm) High Hollow D-Strip Compression-DeflectionFigure 200.250 in. (6.35 mm) Dia. Hollow O-Strip Compression-DeflectionL o a d , l b ./i n c hDeflection, %L o a d , l b ./i n c hDeflection, %Figure 230.250 in. (6.35 mm) Dia. Hollow P-Strip Compression-DeflectionFigure 240.360 in. (9.14 mm) Dia. Hollow P-Strip Compression-DeflectionL o a d , l b ./i n c hDeflection, %L o a d , l b ./i n c hDeflection,%Figure 190.156 in. (3.96 mm) Dia. Hollow O-Strip Compression-DeflectionL o a d , l b ./i n c hDeflection, %Figure 170.250 in. (6.35 mm) Wide Rectangular Strip Compression-Deflection0.40.81.20.20.61.0C o m p r e s s i o n F o r c e (l b /i n )00.5 1.50.10.2Deflection (inch)1356P/N 10-09-W864-XXXXFigure 250.410 in. (10.41 mm) High V-Strip Compression-DeflectionStress RelaxationAs important as Compression Set and Compression-Deflection, is the Stress Relaxation characteristic of a gasket.If a rubber is subject to a com-pressive load, it will deflect. There is a stress/strain relationship, which for rubbers is generally non-linear except for very small deflections.After the load is applied, a stress decay occurs within the polymer resulting from the internal rearrange-ment of the molecular structure. An approximate rule is that the relaxed stress for cured silicone will finally settle at 70 to 75 percent of the initial stress.There are two ways in which a rubber gasket can be loaded to a desired value. One way is to load it to a point, let it relax, and reapply the load to restore the original stress. The next time it will relax, but not so much.If this is repeated a sufficient number of times, the correct static load on the gasket will reach equilibrium.A more practical way to reach the design value of stress is to load the gasket to 125 percent of its final design value, so that after the relax-ation process is completed the gasket will settle to 100 percent of the design load. This is very reproducible.Figure 26shows a typical stress relaxation curve for Chomerics’conductive elastomers.Compression SetWhen any rubber is deformedfor a period of time, some of the defor-mation is retained permanently even after the load is removed. The amount of permanent deformation, asmeasured by ASTM D395, is termed “Compression Set.” Compression set is measured under conditions of constant deflection (ASTM D395Method B) and is normally expressed as a percentage of the initialdeflection, not as a percentage of the initial height.For gaskets that are used once, or where the gasket/flange periphery relationship is constant (such as a door gasket), compression set is of minor significance if the original load condition and the service temperature are within the design limitations of the gasket material.For gaskets that are randomlyreseated one or more times in normal service life, it is important that the maximum change in gasket thickness does not exceed twice the maximum mismatch between the opposing mating surfaces.Shielding EffectivenessMost shielding effectiveness data given in Table 3 of the Conductive Elastomer section (pages 32-34) is based on a MIL-G-83528B testmethod, with a 24 in. x 24 in. aperture in a rigid enclosure wall and about 100 psi on the gasket. It is a valid and useful way of comparing variousgasket materials, but does not reflect the shielding effectiveness one can expect at seams of typical enclosures.CHO-TM-TP08 is a modified version of the MIL test that provides typical values achieved in actual applications.Since many factors will affect the actual shielding effectiveness of anenclosure seam (flange design,stiffness, flatness, surface resistivity,fastener spacing, enclosuredimensions, closure force, etc.), the only way to determine shielding effectiveness for real enclosures is to test them.Figures 28and 29provide dataon shielding effectiveness for actualFigure 27Formula for Calculation of Compression Setenclosures. The data in Figure 28shows the difference in attenuation between a shelter door closed with no gasket and the same door closed against a CHO-SEAL 1215 hollow D-strip gasket. Instead of single data points at each frequency tested, a range of data is shown for eachfrequency, representing the worst and best readings measured at many points around the door. Figure 29 shows the effects of closure force on shielding effectiveness of an enclosure tested at high frequencies (1-40 GHz) using CHO-SEAL 1215 solid D-strip gaskets.In order to establish reasonable upper limits on gasket resistivity, it is necessary to understand the rela-tionship between flange interface resistance and EMI leakage through the flange. Figure 30presents this relationship for an aluminum enclosure 3 in. x 3 in. x 4 in. deep, measured at 700 MHz. Die-cut gaskets 0.144 in.wide by 0.062 in. thick, in a wide range of resistivities, were clamped between the gold-plated flanges of thisenclosure. Simultaneous measure-ments of flange interface resistance (all attributable to the gaskets) versus RF leakage through the seamproduced a classic S-shaped curve.For the gasket configuration used in this test, the dramatic change in shielding effectiveness occursbetween gasket volume resistivities of 0.01 and 0.4 ohm-cm. Since real enclosures do not have gold-plated flanges, but rather have surfacefinishes (such as MIL-C-5541 Class 3chromate conversion coatings) which also increase in resistance over time, it is recommended that gasket volume resistivity be specified at 0.01 ohm-cm max. for the life of the equipment.Frequency, HzA t t e n u a t i o n (dB )Figure 28Shielding Effectiveness of a Shelter Door Gasket (14 kHz to 10 GHz)kA/inch of gasket (peak-to-peak).Pure silver (1224) and silver-plated-aluminum filled (1285) gaskets have less current carrying capability than silver-plated-copper materials, but are generally acceptable for EMP hardened systems (depending on specific EMP threat levels, gasket cross section dimensions, etc.).Vibration ResistanceCertain conductive elastomers are electrically stable during aircraft-level vibration environments, while others are not. The key factor which deter-mines vibration resistance is theshape and surface texture of the filler particles. Smooth, spherical fillers (such as those used in silver-plated-Figure 32Scanning Electron Microscopy Illustrates EMP Damage Mechanism for Silver/Glass ElastomersL e a k a g e (d B )Vibration (g)Figure 33Effects of Vibration on Shielding Effectiveness of Conductive Elastomer GasketsEMP SurvivabilityIn order for an enclosure to continue providing EMI isolationduring and after an EMP environment,the conductive gaskets at joints and seams must be capable of carrying EMP-induced current pulses without losing their conductivity. Figure 31shows the EMP current response of various types of conductive elastomer gaskets. Note that gaskets based on silver-plated-glass fillers (1350)become nonconductive at low levels of EMP current, and should therefore not be used when EMP is a design consideration. Figure 32is an electron microscope photo which clearly shows the damage mechanism.Silver-plated-copper filled (1215)gaskets have the highest resistance to EMP type currents, showing no loss of conductivity even at 2.50102030405060Shielding Degradation, dBIn t e r f a c e R e s i s t a n c e , m i l l i o h m sFigure 30Interface Resistance vs. Shielding Degradation at a Flange Jointglass materials) tend to move apart during vibration, leading to dramatic increases in resistance and loss of shielding effectiveness (although they normally recover their initial properties after the vibration has ended). Rough, less spherical particles resist vibration with very little electrical degradation. Figure 33shows the effects of vibration on three types of conductive gaskets.Although Chomerics’ silver-plated-copper filled 1215 gasket, with rough,irregular particle agglomerations,exhibits excellent stability during vibration, users of conductive elastomers should be aware that smooth, spherical silver-plated-copper fillers can be almost asunstable as silver-plated-glass fillers.Frequency, GHzA t t e n u a t i o n (dB )Figure 29Effect of Closure Force on Shielding Effectiveness (1 GHz to 40 GHz)Heat AgingThe primary aging mechanism which affects electrical stability of conductive elastomers is the oxidation of filler particles. Formaterials based on pure silver fillers,particle oxidation is not generally a problem because the oxide of silver is relatively soft and reasonably conductive. If the filler particles are non-noble (such as copper, nickel,aluminum, etc.) they will oxidize readily over time and become nonconductive. Even silver-plated base metal powders, such as silver-V o l u m e R e s i s t i v i t y (o h m -c m )Hours at 150°C (Solid Line)Hours at 125°C (Dotted Line)Figure 34Typical heat aging characteristics of Chomerics’ plated-powder-filled conductiveelastomers. Flanged 1000-hr test recommended for qualification. Unflanged 48-hr. test recommended for QC acceptance.plated-copper or silver-plated-aluminum will become non-conductive over time if the plating is not done properly (or if other processingvariables are not properly controlled).These are generally batch control problems, with each batch being potentially good or bad.The most reliable method of predicting whether a batch will be electrically stable is to promote the rate at which poorly plated or processed particles will oxidize, by heat aging in an air circulating oven.For qualification, 1000 hours (42 days)at maximum rated use temperature (with the gasket sample deflected 7-10% between flanges) is the recommended heat aging test for accelerating the effects of long-term aging at normal ambient tempera-tures. A quicker heat aging test,which correlates well with the 1000hour test and is useful for QC acceptance testing, involves a 48hour/150°C oven bake with thegasket sample on an open wire-grid tray (rather than being clamped between flanges). Figure 34shows typical data for volume resistivity versus time for each of these tests.Note:It is essential that no source of free sulfur be placed in the aging oven, as it will cause the material to degrade electrically and mask any oxidation aging tendencies. Common sources of sulfur are neoprenes,most cardboards and other paper products.OutgassingMany spacecraft specifications require that nonmetallic components be virtually free of volatile residues which might outgas in the hard vacuum environment of space. The standard test method for determining outgassing behavior is ASTM E595-93, which provides for measurement of total mass loss (TML) and collected volatile condensable materials (CVCM) in a vacuum environment. Data for a number of Chomerics conductive elastomers,based on ASTM E595-93 testing done by NASA Goddard SpaceflightCenter, is presented in Table 2. The normal specification limits or guide-lines on outgassing for NASA applications are 1% TML max.,and 0.1% CVCM max.。
The
1paring two images, or an image and a model, is the fundamental operation for many image processing and computer vision systems. In most systems of interest, a simple pixelby-pixel comparison won’t do: the difference measurement that we determine must bear some correlation with the perceptual difference between the two images, or with the difference between two adequate interpretations of the two images. In order to compute meaningful differences between images, the first step is usually the determination of a suitable set of features which encode the characteristics that we intend to measure. Measuring meaningful image similarity is a dichotomy that rests on two elements: finding the right set of features and endowing the feature space with the right metric. Since the same feature space can be endowed with an infinity of metrics, the two problems are by no means equivalent, nor does the first subsume the second. In this paper we consider the problem of measuring distances in feature spaces. In a number of cases, after having selected the right set of features extracted, and having characterized an
OSHA现场作业手册说明书

DIRECTIVE NUMBER: CPL 02-00-150 EFFECTIVE DATE: April 22, 2011 SUBJECT: Field Operations Manual (FOM)ABSTRACTPurpose: This instruction cancels and replaces OSHA Instruction CPL 02-00-148,Field Operations Manual (FOM), issued November 9, 2009, whichreplaced the September 26, 1994 Instruction that implemented the FieldInspection Reference Manual (FIRM). The FOM is a revision of OSHA’senforcement policies and procedures manual that provides the field officesa reference document for identifying the responsibilities associated withthe majority of their inspection duties. This Instruction also cancels OSHAInstruction FAP 01-00-003 Federal Agency Safety and Health Programs,May 17, 1996 and Chapter 13 of OSHA Instruction CPL 02-00-045,Revised Field Operations Manual, June 15, 1989.Scope: OSHA-wide.References: Title 29 Code of Federal Regulations §1903.6, Advance Notice ofInspections; 29 Code of Federal Regulations §1903.14, Policy RegardingEmployee Rescue Activities; 29 Code of Federal Regulations §1903.19,Abatement Verification; 29 Code of Federal Regulations §1904.39,Reporting Fatalities and Multiple Hospitalizations to OSHA; and Housingfor Agricultural Workers: Final Rule, Federal Register, March 4, 1980 (45FR 14180).Cancellations: OSHA Instruction CPL 02-00-148, Field Operations Manual, November9, 2009.OSHA Instruction FAP 01-00-003, Federal Agency Safety and HealthPrograms, May 17, 1996.Chapter 13 of OSHA Instruction CPL 02-00-045, Revised FieldOperations Manual, June 15, 1989.State Impact: Notice of Intent and Adoption required. See paragraph VI.Action Offices: National, Regional, and Area OfficesOriginating Office: Directorate of Enforcement Programs Contact: Directorate of Enforcement ProgramsOffice of General Industry Enforcement200 Constitution Avenue, NW, N3 119Washington, DC 20210202-693-1850By and Under the Authority ofDavid Michaels, PhD, MPHAssistant SecretaryExecutive SummaryThis instruction cancels and replaces OSHA Instruction CPL 02-00-148, Field Operations Manual (FOM), issued November 9, 2009. The one remaining part of the prior Field Operations Manual, the chapter on Disclosure, will be added at a later date. This Instruction also cancels OSHA Instruction FAP 01-00-003 Federal Agency Safety and Health Programs, May 17, 1996 and Chapter 13 of OSHA Instruction CPL 02-00-045, Revised Field Operations Manual, June 15, 1989. This Instruction constitutes OSHA’s general enforcement policies and procedures manual for use by the field offices in conducting inspections, issuing citations and proposing penalties.Significant Changes∙A new Table of Contents for the entire FOM is added.∙ A new References section for the entire FOM is added∙ A new Cancellations section for the entire FOM is added.∙Adds a Maritime Industry Sector to Section III of Chapter 10, Industry Sectors.∙Revises sections referring to the Enhanced Enforcement Program (EEP) replacing the information with the Severe Violator Enforcement Program (SVEP).∙Adds Chapter 13, Federal Agency Field Activities.∙Cancels OSHA Instruction FAP 01-00-003, Federal Agency Safety and Health Programs, May 17, 1996.DisclaimerThis manual is intended to provide instruction regarding some of the internal operations of the Occupational Safety and Health Administration (OSHA), and is solely for the benefit of the Government. No duties, rights, or benefits, substantive or procedural, are created or implied by this manual. The contents of this manual are not enforceable by any person or entity against the Department of Labor or the United States. Statements which reflect current Occupational Safety and Health Review Commission or court precedents do not necessarily indicate acquiescence with those precedents.Table of ContentsCHAPTER 1INTRODUCTIONI.PURPOSE. ........................................................................................................... 1-1 II.SCOPE. ................................................................................................................ 1-1 III.REFERENCES .................................................................................................... 1-1 IV.CANCELLATIONS............................................................................................. 1-8 V. ACTION INFORMATION ................................................................................. 1-8A.R ESPONSIBLE O FFICE.......................................................................................................................................... 1-8B.A CTION O FFICES. .................................................................................................................... 1-8C. I NFORMATION O FFICES............................................................................................................ 1-8 VI. STATE IMPACT. ................................................................................................ 1-8 VII.SIGNIFICANT CHANGES. ............................................................................... 1-9 VIII.BACKGROUND. ................................................................................................. 1-9 IX. DEFINITIONS AND TERMINOLOGY. ........................................................ 1-10A.T HE A CT................................................................................................................................................................. 1-10B. C OMPLIANCE S AFETY AND H EALTH O FFICER (CSHO). ...........................................................1-10B.H E/S HE AND H IS/H ERS ..................................................................................................................................... 1-10C.P ROFESSIONAL J UDGMENT............................................................................................................................... 1-10E. W ORKPLACE AND W ORKSITE ......................................................................................................................... 1-10CHAPTER 2PROGRAM PLANNINGI.INTRODUCTION ............................................................................................... 2-1 II.AREA OFFICE RESPONSIBILITIES. .............................................................. 2-1A.P ROVIDING A SSISTANCE TO S MALL E MPLOYERS. ...................................................................................... 2-1B.A REA O FFICE O UTREACH P ROGRAM. ............................................................................................................. 2-1C. R ESPONDING TO R EQUESTS FOR A SSISTANCE. ............................................................................................ 2-2 III. OSHA COOPERATIVE PROGRAMS OVERVIEW. ...................................... 2-2A.V OLUNTARY P ROTECTION P ROGRAM (VPP). ........................................................................... 2-2B.O NSITE C ONSULTATION P ROGRAM. ................................................................................................................ 2-2C.S TRATEGIC P ARTNERSHIPS................................................................................................................................. 2-3D.A LLIANCE P ROGRAM ........................................................................................................................................... 2-3 IV. ENFORCEMENT PROGRAM SCHEDULING. ................................................ 2-4A.G ENERAL ................................................................................................................................................................. 2-4B.I NSPECTION P RIORITY C RITERIA. ..................................................................................................................... 2-4C.E FFECT OF C ONTEST ............................................................................................................................................ 2-5D.E NFORCEMENT E XEMPTIONS AND L IMITATIONS. ....................................................................................... 2-6E.P REEMPTION BY A NOTHER F EDERAL A GENCY ........................................................................................... 2-6F.U NITED S TATES P OSTAL S ERVICE. .................................................................................................................. 2-7G.H OME-B ASED W ORKSITES. ................................................................................................................................ 2-8H.I NSPECTION/I NVESTIGATION T YPES. ............................................................................................................... 2-8 V.UNPROGRAMMED ACTIVITY – HAZARD EVALUATION AND INSPECTION SCHEDULING ............................................................................ 2-9 VI.PROGRAMMED INSPECTIONS. ................................................................... 2-10A.S ITE-S PECIFIC T ARGETING (SST) P ROGRAM. ............................................................................................. 2-10B.S CHEDULING FOR C ONSTRUCTION I NSPECTIONS. ..................................................................................... 2-10C.S CHEDULING FOR M ARITIME I NSPECTIONS. ............................................................................. 2-11D.S PECIAL E MPHASIS P ROGRAMS (SEP S). ................................................................................... 2-12E.N ATIONAL E MPHASIS P ROGRAMS (NEP S) ............................................................................... 2-13F.L OCAL E MPHASIS P ROGRAMS (LEP S) AND R EGIONAL E MPHASIS P ROGRAMS (REP S) ............ 2-13G.O THER S PECIAL P ROGRAMS. ............................................................................................................................ 2-13H.I NSPECTION S CHEDULING AND I NTERFACE WITH C OOPERATIVE P ROGRAM P ARTICIPANTS ....... 2-13CHAPTER 3INSPECTION PROCEDURESI.INSPECTION PREPARATION. .......................................................................... 3-1 II.INSPECTION PLANNING. .................................................................................. 3-1A.R EVIEW OF I NSPECTION H ISTORY .................................................................................................................... 3-1B.R EVIEW OF C OOPERATIVE P ROGRAM P ARTICIPATION .............................................................................. 3-1C.OSHA D ATA I NITIATIVE (ODI) D ATA R EVIEW .......................................................................................... 3-2D.S AFETY AND H EALTH I SSUES R ELATING TO CSHO S.................................................................. 3-2E.A DVANCE N OTICE. ................................................................................................................................................ 3-3F.P RE-I NSPECTION C OMPULSORY P ROCESS ...................................................................................................... 3-5G.P ERSONAL S ECURITY C LEARANCE. ................................................................................................................. 3-5H.E XPERT A SSISTANCE. ........................................................................................................................................... 3-5 III. INSPECTION SCOPE. ......................................................................................... 3-6A.C OMPREHENSIVE ................................................................................................................................................... 3-6B.P ARTIAL. ................................................................................................................................................................... 3-6 IV. CONDUCT OF INSPECTION .............................................................................. 3-6A.T IME OF I NSPECTION............................................................................................................................................. 3-6B.P RESENTING C REDENTIALS. ............................................................................................................................... 3-6C.R EFUSAL TO P ERMIT I NSPECTION AND I NTERFERENCE ............................................................................. 3-7D.E MPLOYEE P ARTICIPATION. ............................................................................................................................... 3-9E.R ELEASE FOR E NTRY ............................................................................................................................................ 3-9F.B ANKRUPT OR O UT OF B USINESS. .................................................................................................................... 3-9G.E MPLOYEE R ESPONSIBILITIES. ................................................................................................. 3-10H.S TRIKE OR L ABOR D ISPUTE ............................................................................................................................. 3-10I. V ARIANCES. .......................................................................................................................................................... 3-11 V. OPENING CONFERENCE. ................................................................................ 3-11A.G ENERAL ................................................................................................................................................................ 3-11B.R EVIEW OF A PPROPRIATION A CT E XEMPTIONS AND L IMITATION. ..................................................... 3-13C.R EVIEW S CREENING FOR P ROCESS S AFETY M ANAGEMENT (PSM) C OVERAGE............................. 3-13D.R EVIEW OF V OLUNTARY C OMPLIANCE P ROGRAMS. ................................................................................ 3-14E.D ISRUPTIVE C ONDUCT. ...................................................................................................................................... 3-15F.C LASSIFIED A REAS ............................................................................................................................................. 3-16VI. REVIEW OF RECORDS. ................................................................................... 3-16A.I NJURY AND I LLNESS R ECORDS...................................................................................................................... 3-16B.R ECORDING C RITERIA. ...................................................................................................................................... 3-18C. R ECORDKEEPING D EFICIENCIES. .................................................................................................................. 3-18 VII. WALKAROUND INSPECTION. ....................................................................... 3-19A.W ALKAROUND R EPRESENTATIVES ............................................................................................................... 3-19B.E VALUATION OF S AFETY AND H EALTH M ANAGEMENT S YSTEM. ....................................................... 3-20C.R ECORD A LL F ACTS P ERTINENT TO A V IOLATION. ................................................................................. 3-20D.T ESTIFYING IN H EARINGS ................................................................................................................................ 3-21E.T RADE S ECRETS. ................................................................................................................................................. 3-21F.C OLLECTING S AMPLES. ..................................................................................................................................... 3-22G.P HOTOGRAPHS AND V IDEOTAPES.................................................................................................................. 3-22H.V IOLATIONS OF O THER L AWS. ....................................................................................................................... 3-23I.I NTERVIEWS OF N ON-M ANAGERIAL E MPLOYEES .................................................................................... 3-23J.M ULTI-E MPLOYER W ORKSITES ..................................................................................................................... 3-27 K.A DMINISTRATIVE S UBPOENA.......................................................................................................................... 3-27 L.E MPLOYER A BATEMENT A SSISTANCE. ........................................................................................................ 3-27 VIII. CLOSING CONFERENCE. .............................................................................. 3-28A.P ARTICIPANTS. ..................................................................................................................................................... 3-28B.D ISCUSSION I TEMS. ............................................................................................................................................ 3-28C.A DVICE TO A TTENDEES .................................................................................................................................... 3-29D.P ENALTIES............................................................................................................................................................. 3-30E.F EASIBLE A DMINISTRATIVE, W ORK P RACTICE AND E NGINEERING C ONTROLS. ............................ 3-30F.R EDUCING E MPLOYEE E XPOSURE. ................................................................................................................ 3-32G.A BATEMENT V ERIFICATION. ........................................................................................................................... 3-32H.E MPLOYEE D ISCRIMINATION .......................................................................................................................... 3-33 IX. SPECIAL INSPECTION PROCEDURES. ...................................................... 3-33A.F OLLOW-UP AND M ONITORING I NSPECTIONS............................................................................................ 3-33B.C ONSTRUCTION I NSPECTIONS ......................................................................................................................... 3-34C. F EDERAL A GENCY I NSPECTIONS. ................................................................................................................. 3-35CHAPTER 4VIOLATIONSI. BASIS OF VIOLATIONS ..................................................................................... 4-1A.S TANDARDS AND R EGULATIONS. .................................................................................................................... 4-1B.E MPLOYEE E XPOSURE. ........................................................................................................................................ 4-3C.R EGULATORY R EQUIREMENTS. ........................................................................................................................ 4-6D.H AZARD C OMMUNICATION. .............................................................................................................................. 4-6E. E MPLOYER/E MPLOYEE R ESPONSIBILITIES ................................................................................................... 4-6 II. SERIOUS VIOLATIONS. .................................................................................... 4-8A.S ECTION 17(K). ......................................................................................................................... 4-8B.E STABLISHING S ERIOUS V IOLATIONS ............................................................................................................ 4-8C. F OUR S TEPS TO BE D OCUMENTED. ................................................................................................................... 4-8 III. GENERAL DUTY REQUIREMENTS ............................................................. 4-14A.E VALUATION OF G ENERAL D UTY R EQUIREMENTS ................................................................................. 4-14B.E LEMENTS OF A G ENERAL D UTY R EQUIREMENT V IOLATION.............................................................. 4-14C. U SE OF THE G ENERAL D UTY C LAUSE ........................................................................................................ 4-23D.L IMITATIONS OF U SE OF THE G ENERAL D UTY C LAUSE. ..............................................................E.C LASSIFICATION OF V IOLATIONS C ITED U NDER THE G ENERAL D UTY C LAUSE. ..................F. P ROCEDURES FOR I MPLEMENTATION OF S ECTION 5(A)(1) E NFORCEMENT ............................ 4-25 4-27 4-27IV.OTHER-THAN-SERIOUS VIOLATIONS ............................................... 4-28 V.WILLFUL VIOLATIONS. ......................................................................... 4-28A.I NTENTIONAL D ISREGARD V IOLATIONS. ..........................................................................................4-28B.P LAIN I NDIFFERENCE V IOLATIONS. ...................................................................................................4-29 VI. CRIMINAL/WILLFUL VIOLATIONS. ................................................... 4-30A.A REA D IRECTOR C OORDINATION ....................................................................................................... 4-31B.C RITERIA FOR I NVESTIGATING P OSSIBLE C RIMINAL/W ILLFUL V IOLATIONS ........................ 4-31C. W ILLFUL V IOLATIONS R ELATED TO A F ATALITY .......................................................................... 4-32 VII. REPEATED VIOLATIONS. ...................................................................... 4-32A.F EDERAL AND S TATE P LAN V IOLATIONS. ........................................................................................4-32B.I DENTICAL S TANDARDS. .......................................................................................................................4-32C.D IFFERENT S TANDARDS. .......................................................................................................................4-33D.O BTAINING I NSPECTION H ISTORY. .....................................................................................................4-33E.T IME L IMITATIONS..................................................................................................................................4-34F.R EPEATED V. F AILURE TO A BATE....................................................................................................... 4-34G. A REA D IRECTOR R ESPONSIBILITIES. .............................................................................. 4-35 VIII. DE MINIMIS CONDITIONS. ................................................................... 4-36A.C RITERIA ................................................................................................................................................... 4-36B.P ROFESSIONAL J UDGMENT. ..................................................................................................................4-37C. A REA D IRECTOR R ESPONSIBILITIES. .............................................................................. 4-37 IX. CITING IN THE ALTERNATIVE ............................................................ 4-37 X. COMBINING AND GROUPING VIOLATIONS. ................................... 4-37A.C OMBINING. ..............................................................................................................................................4-37B.G ROUPING. ................................................................................................................................................4-38C. W HEN N OT TO G ROUP OR C OMBINE. ................................................................................................4-38 XI. HEALTH STANDARD VIOLATIONS ....................................................... 4-39A.C ITATION OF V ENTILATION S TANDARDS ......................................................................................... 4-39B.V IOLATIONS OF THE N OISE S TANDARD. ...........................................................................................4-40 XII. VIOLATIONS OF THE RESPIRATORY PROTECTION STANDARD(§1910.134). ....................................................................................................... XIII. VIOLATIONS OF AIR CONTAMINANT STANDARDS (§1910.1000) ... 4-43 4-43A.R EQUIREMENTS UNDER THE STANDARD: .................................................................................................. 4-43B.C LASSIFICATION OF V IOLATIONS OF A IR C ONTAMINANT S TANDARDS. ......................................... 4-43 XIV. CITING IMPROPER PERSONAL HYGIENE PRACTICES. ................... 4-45A.I NGESTION H AZARDS. .................................................................................................................................... 4-45B.A BSORPTION H AZARDS. ................................................................................................................................ 4-46C.W IPE S AMPLING. ............................................................................................................................................. 4-46D.C ITATION P OLICY ............................................................................................................................................ 4-46 XV. BIOLOGICAL MONITORING. ...................................................................... 4-47CHAPTER 5CASE FILE PREPARATION AND DOCUMENTATIONI.INTRODUCTION ............................................................................................... 5-1 II.INSPECTION CONDUCTED, CITATIONS BEING ISSUED. .................... 5-1A.OSHA-1 ................................................................................................................................... 5-1B.OSHA-1A. ............................................................................................................................... 5-1C. OSHA-1B. ................................................................................................................................ 5-2 III.INSPECTION CONDUCTED BUT NO CITATIONS ISSUED .................... 5-5 IV.NO INSPECTION ............................................................................................... 5-5 V. HEALTH INSPECTIONS. ................................................................................. 5-6A.D OCUMENT P OTENTIAL E XPOSURE. ............................................................................................................... 5-6B.E MPLOYER’S O CCUPATIONAL S AFETY AND H EALTH S YSTEM. ............................................................. 5-6 VI. AFFIRMATIVE DEFENSES............................................................................. 5-8A.B URDEN OF P ROOF. .............................................................................................................................................. 5-8B.E XPLANATIONS. ..................................................................................................................................................... 5-8 VII. INTERVIEW STATEMENTS. ........................................................................ 5-10A.G ENERALLY. ......................................................................................................................................................... 5-10B.CSHO S SHALL OBTAIN WRITTEN STATEMENTS WHEN: .......................................................................... 5-10C.L ANGUAGE AND W ORDING OF S TATEMENT. ............................................................................................. 5-11D.R EFUSAL TO S IGN S TATEMENT ...................................................................................................................... 5-11E.V IDEO AND A UDIOTAPED S TATEMENTS. ..................................................................................................... 5-11F.A DMINISTRATIVE D EPOSITIONS. .............................................................................................5-11 VIII. PAPERWORK AND WRITTEN PROGRAM REQUIREMENTS. .......... 5-12 IX.GUIDELINES FOR CASE FILE DOCUMENTATION FOR USE WITH VIDEOTAPES AND AUDIOTAPES .............................................................. 5-12 X.CASE FILE ACTIVITY DIARY SHEET. ..................................................... 5-12 XI. CITATIONS. ..................................................................................................... 5-12A.S TATUTE OF L IMITATIONS. .............................................................................................................................. 5-13B.I SSUING C ITATIONS. ........................................................................................................................................... 5-13C.A MENDING/W ITHDRAWING C ITATIONS AND N OTIFICATION OF P ENALTIES. .................................. 5-13D.P ROCEDURES FOR A MENDING OR W ITHDRAWING C ITATIONS ............................................................ 5-14 XII. INSPECTION RECORDS. ............................................................................... 5-15A.G ENERALLY. ......................................................................................................................................................... 5-15B.R ELEASE OF I NSPECTION I NFORMATION ..................................................................................................... 5-15C. C LASSIFIED AND T RADE S ECRET I NFORMATION ...................................................................................... 5-16。
MT8KTF51264HZ-1G6E1

1.35V DDR3L SDRAM SODIMMMT8KTF12864HZ – 1GB MT8KTF25664HZ – 2GB MT8KTF51264HZ – 4GB Features•DDR3L functionality and operations supported as defined in the component data sheet•204-pin, small-outline dual in-line memory module (SODIMM)•Fast data transfer rates: PC3-14900, PC3-12800, or PC3-10600•1GB (128 Meg x 64), 2GB (256 Meg x 64), 4GB (512Meg x 64)•V DD = 1.35V (1.283–1.45V)•V DD = 1.5V (1.425–1.575V)•Backward compatible with standard 1.5V (±0.075V)DDR3 systems •V DDSPD = 3.0–3.6V•Nominal and dynamic on-die termination (ODT) for data, strobe, and mask signals •Single rank•Fixed burst chop (BC) of 4 and burst length (BL) of 8via the mode register set (MRS)•On-board I 2C serial presence-detect (SPD) EEPROM •Gold edge contacts •Halogen-free •Fly-by topology•Terminated control, command, and address bus Figure 1: 204-Pin SODIMM (MO-268 R/C B2, B4)Module height: 30mm (1.181in)OptionsMarking•Operating temperature–Commercial (0°C ≤ T A ≤ +70°C)None •Package–204-pin DIMM (halogen-free)Z •Frequency/CAS latency– 1.07ns @ CL = 13 (DDR3-1866)-1G9– 1.25ns @ CL = 11 (DDR3-1600)-1G6– 1.5ns @ CL = 9 (DDR3-1333)-1G4Table 1: Key Timing ParametersTable 2: AddressingTable 3: Part Numbers and Timing Parameters – 1GB Modules1Table 4: Part Numbers and Timing Parameters – 2GB Modules1Table 5: Part Numbers and Timing Parameters – 4GB Modules1Notes: 1.The data sheet for the base device can be found on Micron’s web site.2.All part numbers end with a two-place code (not shown) that designates component and PCB revisions.Consult factory for current revision codes. Example: MT8KSF51264HZ-1G9P1.Pin AssignmentsTable 6: Pin AssignmentsNotes: 1.Pin 78 is NF for 1GB and 2GB; A15 for 4GB.2.Pin 80 is NF for 1GB; A14 for 2GB and 4GB.Pin DescriptionsThe pin description table below is a comprehensive list of all possible pins for all DDR3modules. All pins listed may not be supported on this module. See Pin Assignments forinformation specific to this module.Table 7: Pin DescriptionsTable 7: Pin Descriptions (Continued)DQ MapsTable 8: Component-to-Module DQ Map, R/C B2 (PCB 1092)Table 9: Component-to-Module DQ Map, R/C B4 (PCB 1348)Functional Block Diagram Figure 2: Functional Block DiagramS0#A[15/14/13:0]RAS#WE#CKE0A[15/14/13:0]: DDR3 SDRAMWE#: DDR3 SDRAMCKE0: DDR3 SDRAMRESET#: DDR3 SDRAMCK0CK0#CK1CK1#V REFCAV SSV DDControl, command,and address terminationV DDSPDV TTV REFDQClock, control, command, and address line terminations:TTV DDNote: 1.The ZQ ball on each DDR3 component is connected to an external 240Ω ±1% resistorthat is tied to ground. It is used for the calibration of the component’s ODT and outputdriver.1GB, 2GB, 4GB (x64, SR) 204-Pin DDR3L SODIMMFunctional Block DiagramGeneral DescriptionDDR3 SDRAM modules are high-speed, CMOS dynamic random access memory mod-ules that use internally configured 8-bank DDR3 SDRAM devices. DDR3 SDRAM mod-ules use DDR architecture to achieve high-speed operation. DDR3 architecture is essen-tially an 8n-prefetch architecture with an interface designed to transfer two data wordsper clock cycle at the I/O pins. A single read or write access for the DDR3 SDRAM mod-ule effectively consists of a single 8n-bit-wide, one-clock-cycle data transfer at the inter-nal DRAM core and eight corresponding n-bit-wide, one-half-clock-cycle data transfersat the I/O pins.DDR3 modules use two sets of differential signals: DQS, DQS# to capture data and CKand CK# to capture commands, addresses, and control signals. Differential clocks anddata strobes ensure exceptional noise immunity for these signals and provide precisecrossing points to capture input signals.Fly-By TopologyDDR3 modules use faster clock speeds than earlier DDR technologies, making signalquality more important than ever. For improved signal quality, the clock, control, com-mand, and address buses have been routed in a fly-by topology, where each clock, con-trol, command, and address pin on each DRAM is connected to a single trace and ter-minated (rather than a tree structure, where the termination is off the module near theconnector). Inherent to fly-by topology, the timing skew between the clock and DQS sig-nals can be easily accounted for by using the write-leveling feature of DDR3.Serial Presence-Detect EEPROM OperationDDR3 SDRAM modules incorporate serial presence-detect. The SPD data is stored in a256-byte EEPROM. The first 128 bytes are programmed by Micron to comply withJEDEC standard JC-45, "Appendix X: Serial Presence Detect (SPD) for DDR3 SDRAMModules." These bytes identify module-specific timing parameters, configuration infor-mation, and physical attributes. The remaining 128 bytes of storage are available for useby the customer. System READ/WRITE operations between the master (system logic)and the slave EEPROM device occur via a standard I2C bus using the DIMM’s SCL(clock) SDA (data), and SA (address) pins. Write protect (WP) is connected to V SS, per-manently disabling hardware write protection. For further information refer to Microntechnical note TN-04-42, "Memory Module Serial Presence-Detect."Electrical SpecificationsStresses greater than those listed may cause permanent damage to the module. This is astress rating only, and functional operation of the module at these or any other condi-tions outside those indicated in each device's data sheet is not implied. Exposure to ab-solute maximum rating conditions for extended periods may adversely affect reliability. Table 10: Absolute Maximum RatingsTable 11: Operating ConditionsNotes: 1.Module is backward-compatible with 1.5V operation. Refer to device specification fordetails and operation guidance.2.V TT termination voltage in excess of the stated limit will adversely affect the commandand address signals’ voltage margin and will reduce timing margins.3.T A and T C are simultaneous requirements.4.For further information, refer to technical note TN-00-08: “Thermal Applications,”available on Micron’s web site.5.The refresh rate is required to double when 85°C < T C≤ 95°C.DRAM Operating ConditionsRecommended AC operating conditions are given in the DDR3 component data sheets.Component specifications are available at . Module speed grades correlatewith component speed grades, as shown below.Table 12: Module and Component Speed GradesDesign ConsiderationsSimulationsMicron memory modules are designed to optimize signal integrity through carefully de-signed terminations, controlled board impedances, routing topologies, trace lengthmatching, and decoupling. However, good signal integrity starts at the system level.Micron encourages designers to simulate the signal characteristics of the system'smemory bus to ensure adequate signal integrity of the entire memory system.PowerOperating voltages are specified at the DRAM, not at the edge connector of the module.Designers must account for any system voltage drops at anticipated power levels to en-sure the required supply voltage is maintained.I DD SpecificationsTable 13: DDR3 I DD Specifications and Conditions – 1GB (Die Revision J)Values are for the MT41K128M8 DDR3L SDRAM only and are computed from values specified in the 1.35V 1GbTable 14: DDR3 I DD Specifications and Conditions – 2GB (Die Revision K)Values are for the MT41K256M8 DDR3L SDRAM only and are computed from values specified in the 1.35V 2GbTable 15: DDR3 I DD Specifications and Conditions – 4GB (Die Revision E)Values are for the MT41K512M8 DDR3L SDRAM only and are computed from values specified in the 1.35V 4GbTable 16: DDR3 I DD Specifications and Conditions – 4GB (Die Revision N)Values are for the MT41K512M8 DDR3L SDRAM only and are computed from values specified in the 1.35V 4GbTable 17: DDR3 I DD Specifications and Conditions – 4GB (Die Revision P)Values are for the MT41K512M8 DDR3L SDRAM only and are computed from values specified in the 1.35V 4GbSerial Presence-Detect EEPROMFor the latest SPD data, refer to Micron's SPD page: /spd .Table 18: Serial Presence-Detect EEPROM DC Operating ConditionsTable 19: Serial Presence-Detect EEPROM AC Operating ConditionsNotes:1.Guaranteed by design and characterization, not necessarily tested.2.To avoid spurious start and stop conditions, a minimum delay is placed between the fall-ing edge of SCL and the falling or rising edge of SDA.3.For a restart condition, or following a WRITE cycle.1GB, 2GB, 4GB (x64, SR) 204-Pin DDR3L SODIMMSerial Presence-Detect EEPROMModule DimensionsFigure 3: 204-Pin DDR3 SODIMM3.8 (0.150)1.8 (0.071)(2X)2.0 (0.079) RFront viewTYP45° 4XNotes:1.All dimensions are in millimeters (inches); MAX/MIN or typical (TYP) where noted.2.The dimensional diagram is for reference only.8000 S. Federal Way, P .O. Box 6, Boise, ID 83707-0006, Tel: 208-368-4000/products/support Sales inquiries: 800-932-4992Micron and the Micron logo are trademarks of Micron Technology, Inc.All other trademarks are the property of their respective owners.This data sheet contains minimum and maximum limits specified over the power supply and temperature range set forth herein.Although considered final, these specifications are subject to change, as further product development and data characterization some-times occur.1GB, 2GB, 4GB (x64, SR) 204-Pin DDR3L SODIMMModule DimensionsMouser ElectronicsAuthorized DistributorClick to View Pricing, Inventory, Delivery & Lifecycle Information:M icron Technology:MT8KTF25664HZ-1G6K1MT8KTF51264HZ-1G6P1MT8KTF51264HZ-1G9P1MT8KTF51264HZ-1G6N1。
Advanced Materials Characterization

Advanced Materials CharacterizationAdvanced materials characterization is a crucial aspect of modern science and technology. It involves the study of the physical, chemical, and structural properties of materials at the atomic and molecular level. The information gained from advanced materials characterization is essential for the development of new materials and for improving the performance of existing materials. In this essay,I will discuss the importance of advanced materials characterization from multiple perspectives. From a scientific perspective, advanced materials characterizationis essential for understanding the fundamental properties of materials. Bystudying the structure and composition of materials at the atomic and molecular level, scientists can gain insights into how materials behave under different conditions. This information is crucial for developing new materials that have specific properties, such as increased strength, improved conductivity, or enhanced durability. Advanced materials characterization also allows scientists to study the behavior of materials under extreme conditions, such as high temperatures or pressures, which can provide insights into the properties of materials in space or on other planets. From an engineering perspective, advanced materials characterization is essential for designing and improving materials that are used in various applications, such as aerospace, automotive, and biomedical engineering. By understanding the structure and properties of materials, engineers can develop materials that are stronger, lighter, and more durable. For example, advanced materials characterization has led to the development of new alloys that are used in the aerospace industry to improve fuel efficiency and reduce emissions. Similarly, advanced materials characterization has led to the development of new materials for biomedical implants that are more compatible with the human body and have a longer lifespan. From an economic perspective, advanced materials characterization is essential for developing new products and technologies thatcan drive economic growth. The development of new materials and technologies can create new industries and jobs, and can lead to the creation of new products and services that improve people's lives. For example, the development of newmaterials for solar panels has led to the growth of the renewable energy industry, which has created new jobs and reduced dependence on fossil fuels. Similarly, thedevelopment of new materials for biomedical implants has led to the growth of the medical device industry, which has improved the quality of life for millions of people around the world. From a societal perspective, advanced materials characterization is essential for addressing global challenges such as climate change, energy security, and healthcare. By developing new materials and technologies, we can reduce our dependence on fossil fuels, improve energy efficiency, and develop new treatments for diseases. For example, the development of new materials for energy storage has the potential to revolutionize the way we store and use energy, which could have a significant impact on reducing greenhouse gas emissions. Similarly, the development of new materials for drug delivery could lead to more effective treatments for diseases such as cancer and Alzheimer's. In conclusion, advanced materials characterization is essential for advancing science, engineering, economics, and society. By studying the physical, chemical, and structural properties of materials at the atomic and molecular level, we can gain insights into how materials behave under different conditions, develop new materials with specific properties, and improve the performance of existing materials. The development of new materials and technologies has the potential to create new industries and jobs, improve energy efficiency, and develop new treatments for diseases. Therefore, it is important to continue investing in advanced materials characterization to address the challenges of the 21st century.。
OSRAM SYLVANIA Sylvania '350BL' Blacklight Fluores

Sylvania brand Fluorescent Lamps, manufactured by OSRAM SYLVANIA Products Inc., are exempted from the requirements of the OSHA Hazard Communication Standard (29 CFR 1910.1200) because they are “articles.” The following information is provided by OSRAM SYLVANIA as a courtesy to its customers. I. PRODUCT IDENTIFICATION-----------------------------------------------------------------------------------------------------------------------------------------------------------Trade Name (as labeled): Sylvania "350BL" Blacklight Fluorescent LampsManufacturer: OSRAM SYLVANIA Products Inc.100 Endicott StreetDanvers, MA 01923(978) 777-1900----------------------------------------------------------------------------------------------------------------------------------------------------------- II. HAZARDOUS INGREDIENTS----------------------------------------------------------------------------------------------------------------------------------------------------------- THERE ARE NO KNOWN HEALTH HAZARDS FROM EXPOSURE TO LAMPS THAT ARE INTACT. If the lamp is broken, the following materials may be released:Chemical Name CAS Number % by wt. Exposure Limits in Air (mg/cubic m) ACGIH (TLV) OSHA (PEL)Glass (Soda-Lime) --- 80-90 10.0 (2) 15.0 (2) (1,4) Mercury 7439-97-6 <0.05 0.025 0.1 Ceiling (1, 3,4) Lead Oxide 1317-36-8 0.2-2.0 0.05 0.05(1) Phosphor 2011, (Barium Mesosilicate: Lead) 12650-28-1 1.5-2.5 --- ---(1, 4) (As Pb) 7439-92-1 <0.05 0.05 0.05(1) These chemicals are subject to the reporting requirements of section 313 of Title III of the Superfund Amendments and Reauthorization Act of 1986 and 40 CFR Part 372.(2) Limits as nuisance particulate.(3) This element is contained in the material as part of its chemical structure; the material is not a mixture.(4) The mercury and lead in this product are substances known to the state of California to cause reproductive toxicity if ingested. [California Safe Drinking Water and Toxic Enforcement Act of 1986 (Proposition 65).] ----------------------------------------------------------------------------------------------------------------------------------------------------------- III. PHYSICAL PROPERTIES----------------------------------------------------------------------------------------------------------------------------------------------------------- Not applicable to intact lamp.----------------------------------------------------------------------------------------------------------------------------------------------------------- IV. FIRE & EXPLOSION HAZARDS----------------------------------------------------------------------------------------------------------------------------------------------------------- Flammability: Non-combustible Fire Extinguishing Materials: Use extinguishing agents suitable for surrounding fire. Special Firefighting Procedure: Use a self-contained breathing apparatus to prevent inhalation of dust and/or fumes that may be generated from broken lamps during firefighting activities. Unusual Fire and Explosion Hazards: When exposed to high temperature, toxic fumes may be released from broken lamps. ----------------------------------------------------------------------------------------------------------------------------------------------------------- PRODUCT SAFETY DATA SHEETPSDS No. 1.1.4FLUORESCENT BLACKLIGHT LAMPSV. HEALTH HAZARDS-----------------------------------------------------------------------------------------------------------------------------------------------------------A. OPERATING LAMPSConsult the OSRAM SYLVANIA Product Catalog or relevant technical data sheets for complete warnings,B. LAMP MATERIALSTHERE ARE NO KNOWN HEALTH HAZARDS FROM EXPOSURE TO LAMPS THATARE INTACT. No adverse effects are expected from occasional exposure to broken lamps. As a matterof good practice, avoid prolonged or frequent exposure to broken lamps unless there is adequateventilation. The major hazard from broken lamps is the possibility of sustaining glass cuts.NIOSH/OSHA Occupational Health Guidelines for Chemical Hazards and/or NIOSH Pocket Guide toChemical Hazards lists the following effects of overexposure to the chemicals/materials tabulatedbelow when they are inhaled, ingested, or contacted with skin or eye:Mercury - Exposure to high concentrations of vapors for brief periods can cause acute symptoms such aspneumonitis, chest pains, shortness of breath, coughing, gingivitis, salivation and possibly stomatitis. Maycause redness and irritation as a result of contact with skin and/or eyes.Lead - Ingestion and inhalation of lead dust or fume must be avoided. Irritation of the eyes and respiratorytract may occur. Excessive lead absorption is toxic and may include symptoms such as anemia, weakness,abdominal pain, and kidney disease. However, the chemical inertness and insolubility of this material isexpected to reduce the potential for systemic lead toxicity.Glass - Glass dust is considered to be physiologically inert and as such, has an OSHA exposure limit of 15mg/cubic meter for total dust and 5 mg/cubic meter for respirable dust. The ACGIH TLVs for particulatesnot otherwise classified are 10 mg/cubic meter for total dust and 3 mg/cubic meter for respirable dust.Phosphor - Inhalation of insoluble barium compounds has been reported to cause benign pneumoconiosiswith no specific symptoms and no changes in pulmonary function.EMERGENCY AND FIRST AID PROCEDURES:Glass Cuts: Perform normal first aid procedures. Seek medical attention as required.Inhalation: If discomfort, irritation or symptoms of pulmonary involvement develop, remove from exposure and seek medical attention.Ingestion: In the unlikely event of ingestion of a large quantity of material, seek medical attention.Contact, Skin: Thoroughly wash affected area with mild soap or detergent and water and prevent further contact.Seek medical attention if irritation occurs.Contact, Eye: Wash eyes, including under eyelids, immediately with copious amounts of water for 15 minutes.Seek medical attention.CARCINOGENIC ASSESSMENT (NTP ANNUAL REPORT, IARC MONOGRAPHS, OTHER): None-----------------------------------------------------------------------------------------------------------------------------------------------------------VI. REACTIVITY DATA----------------------------------------------------------------------------------------------------------------------------------------------------------- Stability: StableConditions to avoid: None for intact lamps.Incompatibility (materials to avoid): None for intact lamps.Hazardous decomposition products (including combustion products): None for intact lampsHazardous polymerization products: Will not occur.----------------------------------------------------------------------------------------------------------------------------------------------------------- VII. PROCEDURES FOR DISPOSAL OF BROKEN LAMPS----------------------------------------------------------------------------------------------------------------------------------------------------------- OSRAM SYLVANIA recommends that all mercury-containing lamps be recycled. For a list of lamp recyclers and to obtain state regulatory disposal information, log onto .Ventilate area where breakage occurred. Clean-up with a special mercury vacuum cleaner (not a standard vacuum cleaner) or other suitable means that avoid dust and mercury vapor generation. Take usual precautions for collection of broken glass. Clean-up requires special care due to mercury droplet proliferation. Place materials in closed containers to avoid generating dust.It is the responsibility of the waste generator to ensure proper classification and disposal of waste products. To that end, TCLP tests should be conducted on all waste products, including this one, to determine the ultimate disposition in accordance with applicable federal, state and local regulations. Some states have specific disposal requirements for lamps containing mercury.----------------------------------------------------------------------------------------------------------------------------------------------------------- VIII. SPECIAL HANDLING INFORMATION - FOR BROKEN LAMPS----------------------------------------------------------------------------------------------------------------------------------------------------------- Ventilation: Use adequate general and local exhaust ventilation to maintain exposure levels below the PEL or TLV limits. If such ventilation is unavailable, use respirators as specified below.Respiratory Protection: Use appropriate NIOSH approved respirator if airborne dust concentrations exceed the pertinent PEL or TLV limits. All appropriate requirements set forth in 29 CFR 1910.134 should be met.Eye Protection: OSHA specified safety glasses, goggles or face shield are recommended if lamps are being broken.Protective Clothing: OSHA specified cut and puncture-resistant gloves are recommended for dealing with broken lamps.Hygienic Practices: After handling broken lamps, wash thoroughly before eating, smoking or handling tobacco products, applying cosmetics, or using toilet facilities.Although OSRAM SYLVANIA Products Inc. attempts to provide current and accurate information herein, it makes no representations regarding the accuracy or completeness of the information and assumes no liability for any loss, damage or injury of any kind which may result from, or arise out of, the use of, or reliance on the information by any person.----------------------------------------------------------------------------------------------------------------------------------------------------------- Issue Date: July 19, 2011 Rev C Supercedes: June 08, 2005 Rev B.----------------------------------------------------------------------------------------------------------------------------------------------------------- In case of questions, please call: OSRAM SYLVANIA Products Inc.Product Safety Engineer(978) 777-1900。
- 1、下载文档前请自行甄别文档内容的完整性,平台不提供额外的编辑、内容补充、找答案等附加服务。
- 2、"仅部分预览"的文档,不可在线预览部分如存在完整性等问题,可反馈申请退款(可完整预览的文档不适用该条件!)。
- 3、如文档侵犯您的权益,请联系客服反馈,我们会尽快为您处理(人工客服工作时间:9:00-18:30)。
P u b l i s h e d b y M a n e y P u b l i s h i n g (c ) I O M C o m m u n i c a t i o n s L t dUse of EBSD to characterise high temperature oxides formed on low alloy and stainless steelsR.L.Higginson *,M.A.E.Jepson and G.D.WestExposure of steel to high temperatures in air leads to the formation of an oxide scale,the composition and structure of which depends sensitively on the oxidation conditions and the alloying elements contained within the steel.In this paper,the oxide scale structures formed on low alloy and stainless steels are characterised using electron backscatter diffraction (EBSD).In low alloy steels,this crystallographic information obtained using EBSD enables both the phases within the scale (i.e.haematite,magnetite and wu ¨stite)and orientation relationships between them to be established.This showed that both strong preferred growth within the phase layers and orientational relationships between phase layers,can occur depending on the composition and oxidation conditions.For the scales on stainless steels,the technique enabled the two crystallographic structures,corundum and spinel to be isolated.These structures can be easily differentiated using the EBSD data alone,but the individual phases within them can only be distinguished using the chemical data,collected simultaneously with the EBSD data,because of their crystallographic similarity.This technique revealed two discrete phases for each structure within the oxide scales.For the spinel structure,this consisted of a predominantly chromium and iron containing layer beside the substrate below a coarse grained phase composed of nickel and iron.Meanwhile,an iron rich (haematite)layer at the upper scale surface and a thin chromium rich phase that exists within the fine grained lower scale both possessed the corundum structure.Keywords:Oxidation,Steels,Electron backscatter diffraction,Phase identificationIntroductionElectron backscatter diffraction (EBSD)has been used extensively in single phase metals to study grain structure,deformation and the initiation of recrystallisa-tion.1,2The technique has also been used to characterise a wide range of other materials including ceramics 3and geological samples.4In all this work,the power of the technique is contained within the ability to obtain large quantities of local crystallographic information at submicron resolution.Another useful feature of EBSD is the ability to distinguish between phases by examining the bandwidths and line spacings in the diffraction patterns.5These are then compared with the structure files of selected candidate phases and the best match is chosen.The certainty of the index match can be quantified using parameters such as confidence index (CI),which essentially expresses the difference between the most probable and second most probable solutions.6This ability to combine local phase,orientation and,when combined with energy dispersive spectroscopy(EDS),chemical data,provides a powerful tool for characterising complex multiphase systems.An example of such a system is the oxide scales that form on iron based materials at high temperatures.In iron and low alloy steels,the oxide scales consist of three phases:wu ¨stite (FeO),magnetite (Fe 3O 4)and haematite (Fe 2O 3).These phases are usually contained within discrete layers ordered with increasing oxygen content from the substrate and are traditionally identified by their etching response using optical microscopy.7This technique provides only limited,non-quantitative infor-mation concerning grain size within the phase layers and provides no information on the growth behaviour (i.e.preferred growth directions).In high alloy steels,subtleties in etching response are not capable of providing information about the complex structures and chemistries that the phases can possess.Other techniques such as X-ray diffraction cannot provide local microstructural information and although this information can be obtained from transmission electron microscopy (TEM),sample preparation is often too complicated and usually only enables small portions of a scale to be viewed.This makes EBSD a very valuable technique for characterising the oxide scales that form on Fe based metals at high temperatures.This has beenInstitute of Polymer Technology and Materials Engineering,Loughborough University,Loughborough,LE113TU,UK*Corresponding author,email R.L.Higginson@ ß2006Institute of Materials,Minerals and Mining Published by Maney on behalf of the InstituteReceived 20December 2005;accepted 20April 2006DOI 10.1179/174328406X130920Materials Science and Technology 2006VOL22NO111325P u b l i s h e d b y M a n e y P u b l i s h i n g (c ) I O M C o m m u n i c a t i o n s L t drecognised by a number of research groups who are using the technique to study scale growth behaviour in a number of low 8–11and high alloy 12steels.In this paper,the use of combined EBSD/EDS to characterise a selection of the oxide scale types that form on low alloy and stainless steels at high temperatures are presented.ExperimentalTwo low alloys and one stainless steel,with the compositions shown in Table 1,were cut into 464610mm sections.The samples were ground on all sides with silicon carbide paper to the desired surface finish of 1200and 80grit for low alloy and stainless steel respectively,the coarser finish in the latter was to simulate the industrial practice of applying a coarse grit finish to the surface of some slabs immediately before reheat.The samples were oxidised in ambient air either in a standard box furnace (stainless steel samples)or in a BA¨HR Thermoanalyse GmbH dilatometer (low alloy steel samples).In the latter,rapid heating and cooling rates .1000u C s 21enabled rapid transportation to and from the desired isothermal oxidation temperature.In the dilatometer,temperature was measured using an S type thermocouple spot welded to the surface of the sample.The samples were positioned at the centre of the induction coil using spring loaded quartz rods to support the ends of the sample.Oxidation was carried out at temperatures between 750and 1000u C with hold times between 1and 60min,although only selected examples of these conditions will be presented.Box furnaces were used in oxidation studies of stainless steel because the thermocouple connectivity to the sample in the dilatometer could not be maintained over the extended oxidation time periods used.Oxidation of these samples was carried out at temperatures between 1000and 1200u C with hold times of 1–4h and fast or slow (10u C min 21)cooling rates.Fast cooling was achieved by simply removing the samples from the furnace and placing in ambient air to cool.Samples were mounted in conductive bakelite and prepared using standard metallographic procedures to a 1m m diamond finish.For EBSD,all surface deforma-tion induced during preparation must be removed to optimise the quality of the diffraction patterns that are obtained.This was achieved by a final polishing stage using colloidal silica,which provides a chemomechanical polish.Low contact forces were used during this stage to minimise the possibility of grain pullout within the ceramic oxide scale.The samples were examined using a LEO 1530VP FEG SEM equipped with a TexSEM Laboratories (TSL)EBSD system,which has the capability of simultaneously collecting EDS data.The samples were inclined 70u to the horizontal using a pretilted holder and the SEM was operated at 20kV.Collection rates were varied between 2and 10points s 21,slower rates enabled better counting statistics within the EDS.Thiswas necessary in samples where the chemical data were used to aid phase identification.This was achieved using the EDS to filter the candidate phases and then rescan the saved EBSD data (saved as Hough peak positions)offline.The software used for this (ChI-Scan)and to collect,process and display the EBSD/EDS data was all contained within the OIM4(TSL)package.The results are presented without any form of cleaning and the data displayed as image quality (IQ)(i.e.diffraction pattern quality),phase or inverse pole figure (IPF)maps.IPF maps display grain orientational relative to an axis,which was chosen to be the growth direction of the scale.SEM images using a backscatter electron (BSE)detector were also acquired in the same region examined by EBSD.Results and discussionPhase identification of low alloy steelsAs stated in the introduction,oxide scales on low alloy steel generally consist of three phases:wu ¨stite,magnetite and haematite.As shown in Fig.1,high quality EBSD patterns can be produced from each phase,provided samples are prepared correctly.The patterns produced from each candidate phase can be successfully differ-entiated but this is non-trivial because of the crystal-lographic similarities that exist between the three phases that possess cubic symmetry:iron alpha,magnetite and wu ¨stite.Different indexing parameters are required to be optimised,for example,the differentiation between wu ¨stite and magnetite and wu ¨stite and iron alpha.Because in these scales,magnetite and wu ¨stite phases are often intermixed within a phase layer and the iron alpha is confined to the substrate,the indexing parameters were optimised for the magnetite/wu ¨stite differentiation.A second stage was required to provide high differentia-tion accuracy for the alpha iron substrate.This was achieved simply using the large differences in Fe or O content between the oxide and the substrate to filter the possible phases.It was not possible to differentiate the oxide phases in a similar manner,as the differences in Fe and O contents are insufficient to achieve accurate results.The iron layer could have been isolated using EBSD data alone a two stage differentiation process,but this was less convenient.With the indexing parameters optimised,automated EBSD maps can be acquired which clearly reveal the phase layers (Figs.2and 3).These phase designations agree well with the corresponding images from both SEM and optical microscopy.Within the wu ¨stite phase layer,small magnetite precipitates are present.These precipitates form during cooling as the composition range of wu ¨stite contracts with decreasing temperature until 570u C where the phase becomes unstable.Figure 4shows these precipitates at higher magnification.The positions of the precipitates within the EBSD phase map (Fig.4b )are consistent with the corresponding SEM image (Fig.4a )which once again demonstrates theTable 1Compositions of alloys used in this studyCCr Ni Mn Mo Ti Al Si Fe Steel A 0.100.050.050.34––0.0280.10Balance Steel B 0.11––1.29––0.0370.01Balance 316L0.021711.51.62.350.9,0.007–BalanceHigginson et e of EBSD to characterise high temperature oxides1326Materials Science and Technology 2006VOL22NO11P u b l i s h e d b y M a n e y P u b l i s h i n g (c ) I O M C o m m u n i c a t i o n s L t dability of EBSD to differentiate between the phases.The IPF map (Fig.4c )shows that these magnetite precipi-tates have the same orientation as the parent wu ¨stitegrain,which is consistent with TEM studies.13The EDS O map (Fig.4d )shows the expected higher O content in the magnetite precipitates,although only the larger precipitates are distinct because of the modest O content differential between the phases and the spatial resolution limitations of EDS (,1m m).The IPF map in Fig.2b also shows that each phase layer within the scale formed on Steel B possesses a strong crystallographic preferred orientation (CPO).This CPO is consistent with preferred oxide growth along the 0001and 001directions for haematite,magnetite and wu ¨stite respectively.The strength of the CPO decreases in the order haematite .magnetite .wu ¨stite.It was also found that the strength of the CPO was stronger in the top half of the wu ¨stite layer than at the bottom.This can be attributed to increased lateral grain growth that is experienced in the lower phase layer.In Fig.3d ,the phase map of a scale formed on Steel B is shown.The IPF map of this scale (Fig.3e )shows that the phase layers possess no clear CPO.Instead,a strong correlation exists between the orientation of adjacent grains in the magnetite and wu ¨stite phase layers.This1a BSE SEM image of scale grown on Steel A at 900u C for 45min with EBSD patterns of the four phases present:biron alpha,c wu ¨stite,d magnetite and ehaematite2EBSD derived a phase/CI and b IPF maps of scale grown on Steel A at 900u C for 45minHigginson et e of EBSD to characterise high temperature oxidesMaterials Science and Technology 2006VOL22NO111327P u b l i s h e d b y M a n e y P u b l i s h i n g (c ) I O M C o m m u n i c a t i o n s L t dorientational relationship is not unexpected because wu ¨stite grains are known to grow at the magnetite/wu ¨stite phase layer interface.In Steel A (Fig.2),isolated grains were observed with this relationship,but scale growth was clearly dominated by the preferred growth direction.In Fig.3d ,a magnetite seam can also be observed attached to the wu ¨stite layer beside the substrate.Again the orientations of the grains within this thin layer correspond directly with those of the parent wu ¨stite grains.It is thought that this seam formed as the substrate provides a sink for the excess iron formed during the decomposition of wu ¨stite.14The extent of the lateral grain growth that can occur in the wu ¨stite layer is highlighted in the SEM/EBSD montage shown in Fig.5.This shows a planar section (i.e.perpendicular to the scale growth direction)within3a optical and b BSE SEM images of scale grown on Steel B at 800u C for 30min and EBSD/EDS derived c IQ,dphase/CI,e IPF/IQ and f O elemental maps of same section of scale (colour in online version only)Higginson et e of EBSD to characterise high temperature oxides1328Materials Science and Technology 2006VOL22NO11P u b l i s h e d b y M a n e y P u b l i s h i n g (c ) I O M C o m m u n i c a t i o n s L t dthe wu ¨stite layer of a scale formed on Steel A at 900u C after 30min oxidation.Overlaid onto half of this image is a plot of the grain boundaries as determined from an EBSD scan of the same area.In the SEM image,a network of pores can be observed within the grains defined using EBSD.This network of pores is thought to mark grain boundary positions before extensive lateral grain growth.In the example shown,this occurred because scale growth effectively stopped when a large blister,which resulted in a loss of contact between the phase layers,formed.In the absence of blistering,lateral grain growth becomes increasingly significant as scale growth progresses in scales where growth rate decreases with time (e.g.parabolic growth).Phase identification of stainless steelOxide scales grown on stainless steel substrates contain phases with one of two different crystal structures,spinel(e.g.magnetite)and corundum (e.g.haematite).Within both of these structures,the oxide can exist as a range of chemical compositions.Although the compositions of these layers are discrete at a particular oxidation condition,they can differ between heat treatments.These differences make the prediction of the oxide scale chemistry complicated and further work is required to determine the effect of oxidation time and temperature on chemical distribution throughout the oxide layers.Owing to the similarity of the lattice parameters of the different spinels (the lattice parameters range from8.32A˚for a nickel iron oxide to 8.37A ˚for magnetite),it is not possible to distinguish the phases from the crystallographic data obtained using EBSD.Even in manual acquisition,a 5%difference in lattice parameter is the absolute minimum necessary for differentiation.5The same applies to the phases that have the corundum structure,where the maximum difference in lattice parameters is also outside the practical detectable range.Consequently the isomorphous phases were differen-tiated retrospectively using the EDS data,which are collected simultaneously with the EBSD diffraction patterns.A few examples of how this has been used to characterise the oxide scales formed on stainless steels are presented below.Figure 6is a series of EBSD/EDS maps of an oxide scale grown on 316L stainless steel after 4h oxidation at 1200u C.The BSE micrograph in Fig.6a shows that the lowest layer within the scale is very porous and appears to be fine grained but distinguishing between any other layers or phases within the scale is impossible using the image alone.The EDS maps for this scale show that there is a distribution of the alloying elements through-out the scale in such a way that layers with discrete chemical differences are observed.Figure 6c shows a chromium rich oxide layer in the lower external scale which is also shown as being deficient in iron in Fig.6d .Figure 6e shows an increase in the nickel content at the surface of the metal to a depth of ,30m m.The outer layer of the external scale consists of mainly iron and nickel with very low concentrations of chromium.The phase map,produced with the aid of a chemical filter,shows that there are four main phases within thescale.4a BSE SEM image of a section of wu ¨stite phase layerthat formed on Steel A at 900u C for 30min and EBSD/EDS derived b phase/CI,c IPF and d oxygen elemental maps of same section ofscale5BSE SEM image of planar section of wu ¨stite layer (per-pendicular to scale growth direction)of scale grownon Steel A at 900u C for 30min:overlayed are high angle (black)and low angle (white)grain boundaries as determined from EBSD;low angle boundaries here have misorientation ,15uHigginson et e of EBSD to characterise high temperature oxidesMaterials Science and Technology 2006VOL22NO111329P u b l i s h e d b y M a n e y P u b l i s h i n g (c ) I O M C o m m u n i c a t i o n s L t dThe lowest part of the scale consists of two chromium oxides with either a spinel or corundum structure.The middle layer is an iron and nickel rich spinel and the uppermost layer consists mainly of haematite.The upper layer,however,is better described as a dual phase layer of both haematite and the iron and nickel rich spinel.The internal oxidation shown in Fig.6is nickel and chro-mium rich and also contains a small amount of iron.Figure 7is an SEM BSE micrograph of an oxide scale grown on 316L stainless steel after 3h at 1100u C and then slow cooled.The cross-section can be divided into three main sections:the substrate,and inner and outer external oxide scales.The inner oxide layer appears to be particulate in nature and extends to a depth of approximately 100–200m m.The external oxide scale consists of three clearly visible layers:a fine grained,porous layer closest to the substrate,a middle layer,appearing as a lighter shade,and an outer layer.There is,however,some penetration of the outer layer into the middle layer and vice versa.Figure 8shows a seriesof6a BSE SEM image,b EBSD derived phase map and EDS c iron,d chromium and d nickel elemental maps for scalegrown on 316L stainless steel at 1200u C for 4h (in colour in online version)Higginson et e of EBSD to characterise high temperature oxides1330Materials Science and Technology 2006VOL22NO11P u b l i s h e d b y M a n e y P u b l i s h i n g (c ) I O M C o m m u n i c a t i o n s L t dEDS maps,collected during EBSD,of an area of internal oxidation shown in Fig.7.In a number of the oxide particles observed at the deepest extent of the internal oxidation,a dendritic centre was observed.These particles are composed mainly of chromium and to a lesser extent nickel.EDS results have shown these dendritic particles to contain significant concentrations of silicon,further work is however necessary to characterise the particles fully.In a number of the oxide scales grown on 316L stainless steels,a needle like phase has been observed.An example of this type of structure is shown in Fig.9.Figure 9a is a BSE micrograph of the middle layer of an external oxide scale grown on 316L stainless steel after 5h at 1200u C.The needle like phase is clearly visible,with the needles on the left of the image parallel with one another and seemingly equally spaced.Figure 9b is an EBSD phase map of the needle like region.Thephase7BSE SEM image of scale grown on 316L stainlesssteel at 1100u C for 3h and then slowcooled8a BSE SEM image and EBSD/EDS composite maps of b chromium,c iron,d nickel and e oxygen of internal oxideparticle in 316L stainless steel oxidised for 3h at 1200u C and then slow cooled (in colour in online version)Higginson et e of EBSD to characterise high temperature oxidesMaterials Science and Technology 2006VOL22NO111331P u b l i s h e d b y M a n e y P u b l i s h i n g (c ) I O M C o m m u n i c a t i o n s L t dmap shows haematite needles surrounded by an iron and nickel rich spinel.Recent results have suggested that this is due to a phase change similar to that experienced by wu ¨stite when decomposing to magnetite during cooling.ConclusionsEBSD enables the different crystallographic phases that are contained within oxide scales to be determined.In low alloy steels,this allows both preferred growth directions within phase layers and crystallographic relationships between phase layers to be studied.This provides valuable information on scale growth mechanisms and the extent of lateral grain growth within a phase layer.In stainless steels,scale growth is often slower owing to the formation of passive layers and/or chemical gradients,which can act as diffusion barriers.These scales are normally composed of just two crystal-lographic structures:corundum and spinel.Both struc-tures exist with a few discrete chemistries,which can be determined with the use of the EDS data collected simultaneously with the EBSD data.AcknowledgementsThe authors would like to acknowledge Corus Research Development and Technology and Outokumpu Stainless for supplying samples and EPSRC and Outokumpu Stainless UK Research Foundation for funding this work.References1.F.J.Humphreys:J.Mater.Sci.,2001,36,(16),3833–3852.2.V.Randle:Int.Mater.Rev.,2004,49,(1),1–11.3.J.K.Farrer,J.R.Michael and C. B.Carter:in ‘Electron backscatter diffraction in materials science’,(ed.A.J.Schwartz et al.),299–318;2000,New York,Kluwer Academic.4.D.J.Prior,A.P.Boyle,F.Brenker,M.C.Cheadle,A.Day,G.Lopez,L.Peruzzo,G.J.Potts,S.Reddy,R.Spiess,N.E.Timms,P.Trimby,J.Wheeler and L.Zetterstrom:Am.Mineral.,1999,84,(11–12),1741–1759.5.J.R.Michael:in ‘Electron backscatter diffraction in materials science’,(ed.A.J.Schwartz et al.),75–89;2000,New York,Kluwer Academic.6.D.P.Field:Ultramicroscopy ,1997,67,1–9.7.N.Birks and G.H.Meier:‘Introduction to high temperature oxidation of metals’;1983,London,Edward Arnold.8.V.Randle:Ironmaking Steelmaking ,1994,21,209–214.9.B.K.Kim and J.A.Szpunar:Scr.Mater.,2001,44,(11),2605.10.R.L.Higginson,B.Roebuck and E.J.Palmiere:Scr.Mater.,2002,47,337–342.11.G.D.West,S.Birosca and R.L.Higginson:J.Microsc.,2005,217,122–129.12.M.Jepson and R.L.Higginson:Mater.High Temp.,2005,22,(3–4),195–200.13.J.Baud,A.Ferrier and J.Manenc:Oxid.Met.,1978,12,(4),331–342.14.R.Y.Chen and W.Y.D.Yuen:Oxid.Met.,2003,59,(5/6),433–468.9a BSE SEM image and EBSD derived b phase/CI and cIPF/IQ maps of the needle structure that forms in the upper regions of scales grown on 316L stainless steel at 1100u C for 5h and then furnace cooled (in colour in online version)Higginson et e of EBSD to characterise high temperature oxides1332Materials Science and Technology 2006VOL22NO11。