“头肩”形态详解
反转形态:头肩顶和头肩底
反转形态:头肩顶和头肩底1.头肩顶头肩顶是价格形态中出现得最多的形态,是最著名和可靠性较高的反转突破形态。
图是头肩顶的示意图,这种形态是在涨势中出现的。
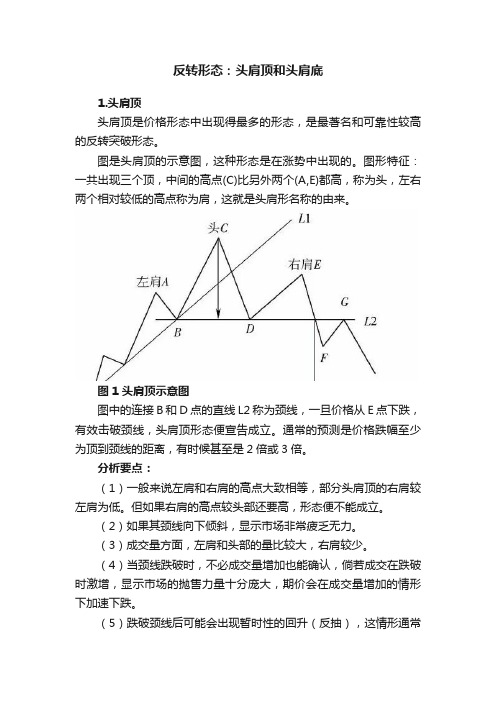
图形特征:一共出现三个顶,中间的高点(C)比另外两个(A,E)都高,称为头,左右两个相对较低的高点称为肩,这就是头肩形名称的由来。
图1 头肩顶示意图图中的连接B和D点的直线L2称为颈线,一旦价格从E点下跌,有效击破颈线,头肩顶形态便宣告成立。
通常的预测是价格跌幅至少为顶到颈线的距离,有时候甚至是2倍或3倍。
分析要点:(1)一般来说左肩和右肩的高点大致相等,部分头肩顶的右肩较左肩为低。
但如果右肩的高点较头部还要高,形态便不能成立。
(2)如果其颈线向下倾斜,显示市场非常疲乏无力。
(3)成交量方面,左肩和头部的量比较大,右肩较少。
(4)当颈线跌破时,不必成交量增加也能确认,倘若成交在跌破时激增,显示市场的抛售力量十分庞大,期价会在成交量增加的情形下加速下跌。
(5)跌破颈线后可能会出现暂时性的回升(反抽),这情形通常会在低成交量的跌破时出现。
不过,暂时回升应该不超越颈线水平(图中的G点)。
如果反抽回升有效突破颈线,则意味着图形“流产”。
3.头肩底头肩底与头肩顶相反,是出现在跌势底部的反转形态,故也有称为倒头肩形的。
除了在成交量方面与头肩顶有所区别外,其余可以说与头肩顶一样,只是方向正好相反。
例如,上升改成下降,高点改成低点。
图3 头肩底示意图头肩底与头肩顶最重要的区别是在形态后半部分的交易量形态上。
在底部过程中,自最底部上冲时,应当具有较重的交易量。
突破颈线的过程应具有更多交易量,若没有较大的成交量出现,可靠性将降低,或者会再跌回底部整理一段时间,积蓄买方力量才能上升。
另外,在头肩底形态中,突破颈线后发生回抽的现象比较普遍。
头肩顶市场意义头肩顶形态出现在上涨趋势中,股价连续三次上攻,成交量往往呈现递减的状态,说明多头的力量越来越弱,股价的上涨趋势很可能已经到了尽头。
【图形形态】必胜!复合头肩底形态(图)

【图形形态】必胜!复合头肩底形态(图)
【图形形态】必胜!复合头肩底形态(图)
复合头肩底是头肩底的变形走势,其形态和头肩底十分相似,只是肩部、头部、或两者同时出现多于N次。
大致来说可划分为以下几类:
(1)一头双肩式形态:一个头分别有两个大小相同的左肩和右肩,左右双肩大致平衡。
比较多的是一头双右肩,在形成第一个右肩时,汇价并不马上突破颈线,反而掉头向下,不过向下却止于右肩低点之间,最后汇价继续沿着原来的趋势向上寻求突破。
(2)一头多肩式形态:一般的头肩底都有对称的倾向,因此当二个左肩形成后,很有可能也会形成一、二个右肩。
除了多、空双方的力量之外,图形的左半部和右半部几乎完全相等。
(3)多头多肩式形态:在形成头部期间,汇价一再回升,而且回升至上次1、2/3的高点水平才向下回落,形成明显的两个头部,也可称作两头两肩式形态走势。
有一点必须留意,多空双方的力量在第二个头的时候往往会较第一个头要少。
股票技术分析中的倒头肩和倒底肩形态

股票技术分析中的倒头肩和倒底肩形态股票市场是一个充满波动和不确定性的领域,投资者通过各种技术分析工具来辅助他们做出买卖决策。
其中,倒头肩和倒底肩形态是两种常见的图表形态,可以帮助投资者预测未来股价的走势。
本文将详细介绍倒头肩和倒底肩形态的定义、特征以及应用。
一、倒头肩形态倒头肩形态是一种出现在股票价格图表上的反转形态,通常表示了一个相对较强的上升趋势即将结束,股价将下跌的预示。
该形态分为三个部分:左肩、头部和右肩。
1. 左肩:在上升趋势之前,股价首先会上升到一个高点,然后回撤一段距离形成左肩的形态。
左肩的形状通常与头部和右肩相似,但股价的涨幅较小。
2. 头部:在左肩之后,股价再次上升到较高的水平,形成一个相对高点。
与左肩相比,头部的形状更加对称,并且伴随着较大的股价涨幅。
3. 右肩:在头部之后,股价再次下跌并重新上升,形成右肩的形态。
右肩的形状与左肩相似,但股价涨幅相对较小。
通常情况下,股价在右肩形成之后会下跌,跌破头部和左肩的低点,确认倒头肩形态有效。
二、倒底肩形态倒底肩形态与倒头肩形态相反,它出现在一个相对较弱的下跌趋势中,预示着股价即将出现反转上涨的信号。
同样地,倒底肩形态也由三个部分组成:左底、底部和右底。
1. 左底:在下跌趋势之前,股价会下跌到一个低点并反弹一段距离形成左底的形态。
与倒头肩形态的左肩类似,左底的形状通常与底部和右底相似,但股价的跌幅较小。
2. 底部:在左底之后,股价再次下跌到一个更低的水平,形成一个相对低点。
与左底相比,底部的形状更加对称,并伴随着较大的股价跌幅。
3. 右底:在底部之后,股价再次上涨并重新下跌,形成右底的形态。
右底的形状与左底相似,但股价跌幅相对较小。
股价在右底形成之后往往会上涨,突破底部和左底的高点,确认倒底肩形态有效。
三、倒头肩和倒底肩形态的应用倒头肩和倒底肩形态的出现意味着市场情绪的转变,可以作为投资者决策的依据。
1. 倒头肩形态:倒头肩形态的出现通常预示着股价即将下跌。
头肩顶形态分析ppt课件共51页

怎样思想,就有怎样的生活
黄金市场技术分析和实战 交易技巧讲座-- 形态分析
马松超
(2)头肩底
பைடு நூலகம் (3)双重顶(M头)
(4)双重底(W底)
(5)三重顶
(6)三重底
颈线突破的确认(过滤器)
1.连续两天收市价突破颈线 2.突破幅度达1%—3% 3.突破颈线时成交量放大
Thank you
持续形态:
(1)箱形
看跌箱形:
(2)旗形和三角旗形
(2)旗形和三角旗形
小 结:
1.在两者之前,市场上几乎都是直线式的价 格运动(旗杆), 且其交易量重大。
2.然后,价格在非常轻弱的交易量下休整一 到四周。
3.三角旗形同小型的水平对称三角形相像。 4.旗形的倾斜方向与趋势相反。 5.在下降趋势中,两种形态持续时间都较短。 6.在证券期货市场,两者都非常普遍。
反转形态共有的基本要领
1.在市场上事先确有趋势存在,是所有反转形态存 在的前提。
2.趋势即将反转的第一个信号,经常是重要的趋势 线被突破。
3.形态的规模越大,则随之而来的市场动作越大。 4.顶部形态所经历的时间通常短于底部形态,但其
波动性较强。
5.底部形态的价格范围通常较小,但其酝酿时间较 长。
6.交易量在验证向上突破信号的可靠性方面,更具 参考价值。
(3)三角形
(4)契形
6、最大的骄傲于最大的自卑都表示心灵的最软弱无力。——斯宾诺莎 7、自知之明是最难得的知识。——西班牙 8、勇气通往天堂,怯懦通往地狱。——塞内加 9、有时候读书是一种巧妙地避开思考的方法。——赫尔普斯 10、阅读一切好书如同和过去最杰出的人谈话。——笛卡儿
股市技术分析-头肩形

第一节 标准图例与颈线
一、标准图例简介 头肩形
双重形
三重形
三角形 旗形
矩形 圆形
二、颈线
头肩形
双重形
三重形
颈线——短期趋势线
三角形
矩形
旗形
圆形
颈线是多空双方争斗最激烈的地方; 颈线可看作价格变动过程中的压力或支撑; 颈线可以是倾斜的也可是水平的; 颈线被有效突破是最后的买入或卖出时机; 有效突破原则:3%原则
4. 股价创新低,而ASI指标未创新低时,为底背离;股价创新高, 而ASI指标未同创新高时,为顶背离。
WVAD指标 中文名称:威廉变异离散量 是一种将成交量加权的量价指标。其主要的理论精髓,在于重视
一天中开盘到收盘之间的价位,而将此区域之上的价位视为压力,区 域之下的价位视为支撑,求取此区域占当天总波动的百分比,以便测 量当天的成交量中,有多少属于此区域。成为实际有意义的交易量。
偶尔放量
2、分析要点
(1)圆形是买卖双方力量逐渐转换的过程,形成 时间较长,至少2个月,底部时间更长,需4个月。
(2)圆形反转在股价的顶部和底部均会出现,其 型态相似,意义相反。
(3)圆形反转不管在顶部还是底部,力度都较大, 价格常常以跳空方式下降或上升,其幅度也较大。
(4)圆形底向上突破,必需成交量的配合。
第五章 形态分析
概念:股价长期波动,涨跌过程中会在K线图上某个 价位区域停留一段时间,少则几根K线,多则几十根K 线聚在一起,形成一定的图案,这些图案就称为形态。
形态的分类:反转形态和持续形态。 反转形态意味着原有趋势正在发生重大转折; 持续形态则显示市场仍将按原有趋势继续运行。
形态分析的目的:在形态形成过程中尽早判断出属那 种形态。
价格形态百科-头肩形态(4)

18、Head-and-Shoulders BottomsI find it easier to pick out tops than bottoms. Perhaps this is because I spend so much time worrying about when to sell. Placing a trade is easy but getting out is the tough part. In my quest to sell at the appropriate time, I have often overlooked the buy side: bottom reversals. Head-and-shoulders bottoms are just such a formation. They are quite easy to spot and can be very profitable.我发现识别高低点是很容易的,大概因为我花了许多时间研究何时卖出。
入场容易,但是出场难。
在我的研究中,太看重入场点。
头肩底是一个容易识别又表现不错的形态。
The Results Snapshot highlights statistics for this bullish reversal. Like the top version of the formation, the bottom sports an exceedingly low failure rate of 5%. Only a few formations either fall or climb by less than 5%. Those that do experience an upside breakout continue rising by an average 38%. Like many bullish formations, the head-and-shoulders bottom meets its price target often: 83 % of the time. I consider values above 80% to be reliable.TourWhat does the formation look like? Figure 18.1 shows a good example of a head-and-shoulders bottom. The stock starts rising in November 1993 and peaks during February, where the figure begins. From that point, the stock moves downward and makes a lower low in late March before moving up. The turn marks the left shoulder. The stock declines again and reaches a new low during late April, forming the head. The right shoulder appears as the stock recovers then continues moving down along the trendline (shown in Figure 18.1 as the neckline).The stock advances above the neckline and stages an upside breakout. However, the rise does not last long. Prices soon decline below the level of the right shoulder. The stock moves sideways over the next 4 months. Then the stock enters another head-and-shoulders bottom and the upside breakout proves more lasting. By mid-August 1995, the stock is trading just below 60.The head-and-shoulders bottom shown in Figure 18.1 has a somewhat unusual volume pattern. Volume is usually highest on the left shoulder, diminished on the head, and even lower on the right shoulder. The rise from the head to the right shoulder accompanies a rise in volume as does the actual breakout.In contrast, the formation shows little increase in volume during the rise from the head to the right shoulder. Volume on the breakout is unexciting and that helps explain why the stock stalls. Upward momentum fails to happen quickly enough to propel the stock higher;the stock rounds over and heads back down.Figure 18.2 shows a head-and-shoulders formation on a weekly time scale. I chose this chart to show you the typical trend of head-and-shoulders bottom reversals. They usually form after an extended downtrend in prices. As a reversal, once they complete, prices rise.Why do head-and-shoulders bottoms form? The formation represents a struggle to find the bottom, the lowest price that represents the best value. As the stock descends during February 1994, investors nibble at the stock in increasing numbers. Volume climbs even as the stock descends until it spikes upward for 1 week during formation of the left shoulder. Buying demand puts a crimp on the downward slide and prices move up but only for a week. The following week, prices move lower. Again, volume spikes as the stock makes a new low and this becomes the head. The smart money is accumulating the stock in anticipation of an eventual rise or a change in the fundamentals. The stock moves up on receding volume then retreats and forms the right shoulder.Volume on the three troughs is diminishing. The left shoulder has very high volume, the head exhibits somewhat less volume, and the right shoulder records the lowest volume up to that point. Only after prices start moving up from the right shoulder does volume spike upward.Breakout volume, depending on where you determine the breakout occurs, is unconvincing. In late August, prices move decidedly above the neckline and stage a definitive breakout. Even so, it is not until 2 weeks later that volume advances noticeably.Identification GuidelinesTable 18.1 encapsulates the identification guidelines for a head-and-shoulders bottom. Consider Figure 18.3, a head-and-shoulders bottom. The formation does not appear at the end of a long-term downtrend but at a short-term one (up to 3 months). The uptrend begins the prior June with another head-and-shoulders bottom. The formation reverses the slight short-term downtrend but continues the long-term uptrend.Overall, the formation sports the three telltale troughs: left shoulder, head, and right shoulder. The left shoulder is at about the same price level as the right one and appears to be about the same width. Such symmetry is common in head-and-shoulders formations (tops, bottoms, and the complex variety). If the left shoulder is sharp or pointed, the right shoulder will be too. The head is below both shoulders by a reasonable amount. By this characteristic I mean the formation is not a triple bottom—three troughs at about the same price level.In Figure 18.3, the left shoulder suddenly declines for 3 days, then reverses and climbs to a minor high. Similarly, the rise between the head and right shoulder climbs almost to the height of the rise between the left shoulder and head then descends to the right shoulder. All five features, the three troughs and two minor rises, appear well defined and distinct. The features are important as you scan your charts looking for head-and-shoulders bottoms.Symmetry is another important key to selecting a valid head-and-shoulders bottom. The right side of the formation usually mimics the left side. The right shoulder declines to about the price level of the left shoulder and die distances of both from the head are similar. Of course, there are many variations, but symmetry should make a head-and-shoulders bottom stand out from a sequence of any three depressions.Volume represents anodier clue to the validity of a bottom. The left shoulder typically has the highest volume, followed by the head, with diminished volume on the right shoulder. Thus, overall, the volume trend is downward; higher on the left side of the formation than the right—until the breakout.The neckline is an imaginary line connecting the two rises between the shoulders and the head. It can slope downward or upward. In well-formed formations, the slope of the line is not very steep, but a steep neckline should not be a disqualifier of a head-and-shoulders bottom (see Figure 18.1—it has a rather steep neckline).Irregular volume patterns should also not disqualify the formation. Figures 18.1 and 18.3, for example, have volume that is highest at the head. Breakout volume is usually high as itpushes prices above the neckline. However, in a quarter of the formations where prices continue higher, breakout volume is well below the day before the breakout. We see in the Focus on Failures section that high breakout volume accompanies most failures. As a rule, volume will rise on the day of the breakout, but it need not.Focus on FailuresLike most formations, there are two types of failures. The first type, shown in Figure 18.4, is a failure of the head-and-shoulders bottom to pierce the neckline and move higher. As you would expect, the formation appears after a downtrend in prices. The highest price peak is partly visible in the upper left corner of Figure 18.4. From the high of 383/4, prices fall to the low at the head, 2ll/4, a decline of 45%. When the bottom forms, it should signal a trend reversal.An interesting thing about the formation in Figure 18.4 is that the left shoulder is almost the same shape as the right. Only a dollar separates the two shoulder lows and the head is well below both shoulder troughs. The right shoulder is somewhat farther away from the head than the left. This characteristic is typical.Volume is suspiciously low throughout the formation. The left shoulder and head register about the same level of volume. The right shoulder volume, however, is higher than the other two. Of course, an irregular volume pattern is no reason to discard a formation—but it serves as a warning.After the right shoulder forms and prices begin rising, volume tapers off rapidly and the attempt to pierce the neckline fails. The rally attempt does not even come close to the neckline.Looking at the overall formation, there is no one item that signals an impending failure.There is some suspicious activity, principally the abnormal volume pattern, but nothing to deter an investor.Figure 18.5 shows a slightly different type of failure. This is what I call a 5% failure. The two shoulders and head appear well formed and distinct. The left shoulder looks different from the right, but the twin rises between the shoulders are similar. The price level of the two shoulders is not suspiciously out of line.Volume is unusual. The only heavy volume appears near the head as prices rise away from it toward the right shoulder. The right shoulder volume looks like something you would want to tackle with your shaver: annoying but not high enough to be alarming.Prices advance smartly after the right shoulder forms. Once prices rise above the stair-step incline, they zoom upward for 3 days and then stop. The stock moves essentially sideways for 2 weeks before starting back down.Although this formation does have an upside breakout, prices fail to rise by more than 5% above the neckline. Prices should reach 393/8 to meet the 5% threshold, but they do not. The result is a failure of the 5% rule: Prices must rise by more than 5% after a breakout or the formation is a dud.I went through the various failures in the database and examined them to see if there is any truth to the notion that low volume breakouts are subject to failure. I found that this simply is not true. Of the 18 formation failures, only 8 (44%) occur after a low volume breakout. However, the sample size is small (30 samples usually provides reliable results).These numbers conveniently bring us to die next section: Statistics.Trading TacticsTable 18.4 discusses trading tactics for head-and-shoulders bottoms. Use the measure rule to predict the minimum price move once prices break above the neckline. In Figure 18.7, the head marks the lowest price in the formation. Subtract its price from the value of the neckline at that point. In this example, the head has a daily low price of 13 l/s and the neckline, measured vertically, is at 17'/2. Add the difference, 43/s, to the price where the stock closes above the neckline. This occurs on March 28.1 use its daily low price of 15l/2 on that day to get a target price of 197/s. Prices reach the target in mid-July.If you can determine that a head-and-shoulders bottom is forming, then there is no need to wait for confirmation (that is, for prices to close above the neckline) before placing a trade. With a failure rate of 5%, your guess will get you in at a lower level and yield higher profits. However, this all hinges on the validity of a head-and-shoulders bottom. If you guess wrong, you could see your profits rapidly turn into a loss. If you are unsure whether the price series is indeed a head-and-shoulders bottom, wait for prices to move above the neckline before investing.Also, since about half of all bottoms throw back, you can wait for a throwback before placing the trade. Although this will get you in at a higher price, the likelihood of the trade being profitable also rises. If you have already placed a trade, consider adding to your position once a throwback completes and prices move higher.The two shoulders are common support areas. Figure 18.7 shows an example of this. Thelower of the two shoulders, in this case the right shoulder, supports the stock in late October.After placing a trade, consider setting a stop-loss point l/s or so below the lower of the two shoulders. Should prices decline, they often turn back before declining below the shoulder lows. If this is too far away from the purchase point, place your stop '/s below at the closest support zone. Raise your stop as prices climb.Sample TradeSome people might consider Bob unlucky, but he has an adoring wife and two children. Employed as a blue collar worker in a nearby auto plant, he is happy when he is working. Unfortunately, strikes by the union have taken their toll on his savings and he has been looking for ways to supplement his income.Ever since he was a boy, Wall Street has held his fascination. He has wanted to play the market and when he saw the head-and-shoulders bottom pictured in Figure 18.7, he decided to deploy some of his savings. He bought at 16, the day after prices pushed through the neckline.For over a week, he did all right. Prices slowly moved up and reached a high of 165/s, then reversed. The stock threw back to the neckline and continued lower. Suddenly, he was losing money. Should he sell and take a loss or hang on because he knew it was going higher?He decided to tough it out. The stock bottomed at 14'/2 and quickly recovered. It reached a higher high, then moved sideways for over a month, drifting slightly lower. Bob was not worried because he was making money. It was not a lot, but with patience, he knew he would do okay.During the summer, things heated up for the airline and the stock took off. Almost on a daily basis, it soared higher, making new highs. A bearish broadening top appeared but Bob did not know about such things. He felt giddy in the thin atmosphere in which the stock was flying. The stock entered the clouds at 213/s.When the airline stock hit turbulence in mid-September and headed for the ground, Bob could not believe it. The stock was plummeting and all he could do was watch his profits spin lower like the stock's altimeter. He talked it over with his wife and they decided to hold on. "It'll come back to its old high and when it does, I'll sell it," he grumbled.The stock continued down. Soon, his profits gone, he was posting losses. He maintained his firm stance that he would not sell until the price climbed back to the old level.During October, things changed. The stock pulled up just before nosing into the ground, at 135/8, and not only leveled out, but started climbing again. In a month he was at break-even.At the start of the new year, a descending broadening wedge took prices lower as it widened but turned out to be a bullish omen. In mid-January, on unremarkable volume, the stock turned the corner. Volume climbed, helping prices reach a higher altitude.As the stock closed in on his target of 213/8, Bob called his broker and placed an order to sell at that price. In late February, the stock began a straightline run. It soared through 2 !3/8, hitting his sell order but kept climbing. In just over a month it reached 30.Bob no longer invests in stocks.19、Head-and-Shoulders Bottoms, ComplexI find that a complex head-and-shoulders bottom is more difficult to recognize than a normal head-and-shoulders bottom but not alarmingly so. After all, ifyou can locate a normal head-and-shoulders bottom, then there is a decent chance that you are also looking at a complex one. If you look to the left and right of the two shoulders, you might see additional shoulders. Multiple shoulders are one indication of a complex formation. But before I delve too far into pattern recognition, let me briefly review the important snapshot statistics.The failure rate at 6% is outstanding. Only 15 formations out of almost240 fail to perform as expected. The average rise is a reassuring 37%, and 82% of the formations experiencing an upside breakout meet or exceed their price targets. These figures are all excellent and they imply that this formation is worth trading.Two interesting findings relate to the formation appearance. When theneckline slopes downward, the stock performs better, with gains averaging 39% versus 34% (for those formations with up-sloping necklines). Formations with high volume breakouts also perform better, with gains averaging 39% versus 32% for low volume breakouts. We explore these results in the Statistics section. TourThere are two types of complex head-and-shoulders bottoms: those with multiple shoulders and those with multiple heads. Consider the chart in Figure19.1, a complex head-and-shoulders bottom. The chart pattern has two left shoulders, a single head, and two right shoulders. If you were scanning your charts for normal head-and-shoulders bottoms, this one would probably popup. The left and right shoulders are well defined and the head is below them.As you widen your view, you see an additional pair of shoulders; the left shoul deris about the same distance from the head as the right one. The two outer most shoulders are near the same price level too.Looking at all the shoulders and the head together, the chart is a goodexample of a complex head-and-shoulders bottom. However, the volume pattern is unusual as it is heavier on die right than on the left. Most of the time,the left shoulders show higher volume than the right pair.If you ignore the various labels, you can see a rounding bottom. Althoughthe volume pattern is not a characteristic bowl-shaped pattern, the gentle turnof prices (if you connect the minor lows) supports a bottom formation. Howeveryou choose to classify this pattern, the bullish reversal is clear.Shown in Figure 19.1 is a throwback to the neckline, a common occurrencefor the head-and-shoulders family, especially the complex variety.Although it takes a week or two before prices really begin moving up, the stockclimbs to a high of 325/s before retracing its gains.Compare Figure 19.1 with Figure 19.2, a complex bottom with twoheads. Overall, the formation is quite symmetrical. There are two shouldersand two heads. A neckline connects the highs in the formation and projects for wardin time until prices close above it. The penetration of the neckline is thebreakout point.In Figure 19.2, the breakout in mid-November quickly throws back to theneckline and moves lower for a week or two. The stock rises but throws backagain before finally breaking away and heading higher. By late March the stock reaches a high of 165/g, well above the head low of 93/i6.Volume on the left side of the formation is heavier than on the right. Inthis regard, the formation is more typical than that shown in Figure 19.1. Identification GuidelinesAre there certain characteristics that make head-and-shoulders bottoms easy to identify? Yes, and they are outlined in Table 19.1. As discussed before, thereare two general types of complex head-and-shoulder bottoms: those with multiple shoulders and those with multiple heads (rarely do you have both). Figure19.3 shows a complex bottom with multiple shoulders. The head is distinctlybelow the shoulders, far enough below to distinguish the chart pattern from atriple bottom. In this case, there is a normal head-and-shoulders bottomflanked by an additional pair of shoulders. The overall formation appears symmetrical. The two left shoulders match the two on the right in distance. Figure19.3 shows a far right shoulder that is higher than its corresponding leftone. However, the basic symmetrical pattern is typical for nearly all complexhead-and-shoulders bottoms.Figure 19.3 also shows the usual volume pattern: The two left shouldersshow higher volume than the two right ones. Overall, die volume trend is areceding one.The neckline connects the highest peak on the left with the highest peakon the right. Most of the time the line is nearly horizontal. Although this issubjective, a scan of all the formations indicates that 74% obey this guideline.Many of the formations shown in this chapter have near horizontal necklines.For those with steep necklines (that slope upward), consider using thehighest high in the formation as the breakout price. Using a steep-slopingneckline to gauge the breakout point is risky. Prices may never close above the neckline.Once prices close above the neckline, a breakout occurs. Quite often,prices throw back to the neckline and perhaps move lower before ultimatelycontinuing higher. Figure 19.2 shows an example of this behavior during late December when prices plunged from a high of 11'/2 to 97/i6, a decline of almost 20% in just 2 days! When the decline ended, prices recovered quickly.The formation shown in Figure 19.3 is unusual because it acts as a consolidationof the uptrend. Prices from November through January climbsteadily and then resume moving up after the breakout. The formation is a consolidation region, where prices move horizontally for a spell.Most of the time you will find complex head-and-shoulders bottoms atthe end of a downtrend. Figure 19.1 is an example of this. Although I discuss statistics later, the study reveals that 75% of the formations act as reversals of the prevailing trend and most of the heads (the lowest low in the formation) occur near the yearly low.Focus on FailuresIf making money in the stock market is important to you, it pays to study your failures. The lessons you learn will serve you for many years. When you lookat your failures as a group, you may begin to see trends. Such is the case with chart formations.Although there are only 15 failures out of 239 formations, 66% of thefailures act as consolidations of the trend. Of course, this is really no help at all since you can only determine if the formation is a consolidation or a reversal after the breakout. Many of the failures occur after an extended run-up inprices (then prices backtrack to the formation). After the breakout, the ultimate low is nearby, usually within 10% below the lowest price reached during for mation of the head. There are a few cases where the decline is over 25%, soyou should still place a stop-loss order to limit your losses.Figure 19.4 shows a typical failure of a complex formation to reverse the downtrend. The stock peaks during September 1991 at a price of 1063/g. From that point, it is a slow decline at first but picks up speed after the minor highduring mid-July 1992. By the following January, the stock reaches alow of457/8and forms the dual head.After the head-and-shoulders formation completes, prices do climb, butonly to 57'/8. Prices squeeze above the neckline and close there for just a hand fulof days before sliding below the neckline in early March. Ultimately, thestock reaches 405/s in August.The volume pattern is nearly perfect for a head-and-shoulders formation.The left shoulder shows tremendous volume. Volume diminishes at the dual heads, and the right shoulder shows even less volume. Breakout volume is ane mic and may explain why the formation fails. On closer examination, I foundthat only 3 of the 15 failures (20%) show low volume breakouts. It appears that breakout volume is not a predictor of the success or failure of a formation.After all, the statistics show 41 successful low-volume breakouts.I count any formation with prices that fail to rise by more than 5% as a failure. About half the failures fall into this 5% failure category (the other seven formations have downside breakouts). Figure 19.4, for example, falls under the 5% rule. The breakout is upward, but it fails to climb very far before reversing direction. Once prices decline below the head, I know that there is no hope and mark the formation a failure.In sum, I found no reliable clues that indicate an eventual failure of acomplex head-and-shoulders bottom. This should not be alarming since failures represent only 6% of the formations. In essence, you should be able totrade this formation without worrying about a possible failure. Yes, failures will occur, but with a 94% success rate, why worry?Trading TacticsTrading tactics are outlined in Table 19.4. The measure rule predicts the expected minimum price move and is best explained by an example. Figure 19.6 shows a complex head-and-shoulders bottom on a weekly time scale with the head reaching a low of 13!/2. Directly above that point, the neckline has a value of 185/s. The difference, S'/s, is the formation height. Add the difference to the breakout point (17) to get the minimum price move (22 VB).It took just 2 weeks after the breakout to reach the target, but the stockwas not done climbing. It moved sideways for almost a year before continuing higher. The stock reached a high of 393/g, nearly triple the head low of 13 '/2 and more than double the breakout price.The chart in Figure 19.6 shows a complex head-and-shoulders bottomthat forms after nearly a 2-year run-up in prices. The formation marks a rever salof the 6-month retrace. Once a breakout occurs, prices quickly climb to fulfill the measure rule and then stall. Prices then move horizontally for almost 2 months before climbing to the next level. There the stock consolidates for 7 months before shooting upward in mid-June 1995.Since complex head-and-shoulders bottoms reliably break out upward,there is little need to wait for the actual breakout. Once you determine that a complex formation is present, buy the stock. Of course, the key is that youmust be sure a complex head-and-shoulders formation is present. Many times this is made easier when the formation looks like the one in Figure 19.6, where a normal head-and-shoulders pattern is flanked by two or more shoulders. Ifyou can identify the inner head-and-shoulders pattern, then you need onlywiden your vision and look for additional shoulders.With dual heads, the pattern is somewhat different. The dual-head formation usually has head lows that are less than a month apart. Two heads thatare close together usually distinguishes the formation from a classic double bottom. Shoulder symmetry and a near horizontal neckline should put die finishing touches on the formation identification.Once you take a position in the stock, set your stop-loss point. Manytimes the various shoulder troughs will act as support levels. If your head-andshoulders formation is near the yearly low, then there is a very good chancethat prices will either turn around at the head or decline slightly below it (by10% or so) before bottoming out. From that point, prices climb higher.If your formation is not within the lowest third of the yearly price range,then sell the stock once prices drop below the head. Prices falling below thehead signal a formation failure and it is best to cut your losses instead of prayingthat they will turn around. They will not.After an upside breakout, almost half the time (47%), the stock throwsback to the neckline. Consider adding to your position or placing a long tradeonce prices stop declining. You should wait for prices to rebound on a throwbackor else you could find yourself in a situation similar to that shown in Figure19.2. Prices throw back to the neckline then continue down for over aweek. Depending on when you bought the stock, you could have seen a near10% price improvement if you had waited a few days.Sample TradeWhen the weather is nice, I like to take my bicycle out for a spin and give the automobile drivers something to aim for. It was on one of my bike trips that Imet Melody. After I told her what I did for a living, she confessed that she wasa nightclub dancer and made oodles in tips. I was unsure whether I bought her story, but she looked pretty enough (wearing a bike helmet and sun glasses,who can tell?).Anyway, she told me about a trade she had made in the stock pictured inFigure 19.6. The stock intrigued her because a trendline drawn from the highesthigh in early October to just after the head marked a turning point. That iswhere prices moved up enough to pierce the trendline.Melody knew that prices usually retest the low before beginning anextended move upward, so she followed the stock and watched it loop aroundand dip to 14. Then she glanced sideways and noticed the other dip at 143/s.That is when she uncovered the head-and-shoulders bottom.A neckline connecting the rises between the two shoulders was impossiblysteep; there was no way she could apply the traditional measure rule to。
头肩比算法

头肩比算法概述头肩比算法是一种技术分析方法,用于预测股票价格的走势。
该算法基于技术分析中的头肩形态,通过识别头肩形态的出现来判断股票价格即将发生的趋势转折。
头肩形态由三个连续的峰和谷组成,其中中间的峰(头)比两侧的峰(肩)高,形成一个类似人的头肩形状。
根据头肩形态的出现,可以预测股票价格的上升或下降。
头肩形态的构成要素头肩形态通常由三个峰和谷组成,具体构成要素如下:1.左肩(Left Shoulder):股票价格开始上升后出现的第一个峰值,这个峰值的高度通常低于之后的头和右肩。
2.头(Head):左肩之后出现的最高峰值,这个峰值的高度通常高于左肩和右肩。
3.右肩(Right Shoulder):头之后出现的峰值,这个峰值的高度通常低于头。
4.颈线(Neckline):连接左肩和有肩的线段,可以是水平线、上升线或下降线。
头肩形态的分类根据头肩形态的特征,可以将其分为以下几类:1.正头肩(Head and Shoulders):此类头肩形态表明股票价格即将下降。
头在两个肩之上,颈线通常是下降趋势线。
2.反头肩(Inverse Head and Shoulders):此类头肩形态表明股票价格即将上升。
头在两个肩之下,颈线通常是上升趋势线。
3.头肩底形态(Head and Shoulders Bottom):此类头肩形态表明股票价格即将从下降趋势转为上升趋势。
头肩底形态的特点是头处于股票价格的最低点,头肩之间的颈线通常是上升趋势线。
4.头肩顶形态(Head and Shoulders Top):此类头肩形态表明股票价格即将从上升趋势转为下降趋势。
头肩顶形态的特点是头处于股票价格的最高点,头肩之间的颈线通常是下降趋势线。
头肩比算法的原理头肩比算法的原理是根据股票价格的历史数据,通过计算头肩形态的出现概率来预测股票价格的未来走势。
具体步骤如下:1.数据收集:首先需要收集股票价格的历史数据,包括开盘价、收盘价、最高价、最低价等。
反转模式之头肩形态

反转模式之头肩形态
肩顶是最为常见的倒转形态图表之一。
头肩顶是在上涨行情接近尾声时的看跌形态,图形以左肩、头部、右肩及颈线构成。
1、左肩:一个强势的上扬,其中交易量非常大,接着出现了一个回落,其中交易量比上升期间和居于顶部时的交易量明显要小。
2、头部:另一次高交易量上涨,顶点比左肩顶部的水平要高,接着又是缩量回调,价格回落到先前回落的底部附近,这个低点一定低于左肩的顶部。
3、右肩:第三次上扬,交易量明显低于左肩或者形成头部的交易量,上扬到不到头部所达到的高度,接着就出现了下跌。
4、突破:在第三次回落中,价格下跌穿过一条颈线,这条颈线将左肩同头部之间以及头部同右肩之间的回落底部分别连接在一起。
这一点位标志了低于这条颈线的大约为该股票市价的3%的一个收盘价。
5、出现这些特征要警惕,可能正在形成头肩顶形态:
最新顶部较上一个顶部缩量;
价格跌到左肩顶部之下;
右肩上涨缩量;
6、突破颈线:
如果颈线的向下穿透还没有达到一个起决定作用的数量,那么这个头肩模式还没有形成,不能肯定说已经出现一个重要趋势反转信号。
突破之前有一定概率(约20%)头肩形态会被化解;
7、下跌幅度:
首先测量一下从头部的顶端垂直向下到颈线位的点数。
然后找到右肩完成之后价格穿透颈线的那一点,向下量出相同的距离,这就是将下跌的幅度;
8、头肩模式同道氏理论的关系:
在某种意义上是道氏理论的原理运用,但信号更为明确,在颈线向上倾斜的情况里,信号出现得更快。
干货分享之头肩底
头肩底是一种典型的趋势反转形态,是在行情下跌尾声中出现的看涨形态,图形以左肩、底、右肩及颈线形成。
1、左肩:放量下跌,接着小量反弹;。
- 1、下载文档前请自行甄别文档内容的完整性,平台不提供额外的编辑、内容补充、找答案等附加服务。
- 2、"仅部分预览"的文档,不可在线预览部分如存在完整性等问题,可反馈申请退款(可完整预览的文档不适用该条件!)。
- 3、如文档侵犯您的权益,请联系客服反馈,我们会尽快为您处理(人工客服工作时间:9:00-18:30)。
头肩形态是实际价格形态中出现最多的一种形态,也是最著名和最可靠的反转突破形态。
它一般可分为头肩顶形态、头肩底形态两种类型。
图:头肩顶形态
头肩顶形态是一个可靠的沽出时机,一般通过连续的三次起落构成该形态的三个部分,也就是要出现三个局部的高点。
中间的高点比另外两个都高,称为头;左右两个相对较低的高点称为肩。
这就是头肩顶形态名称的由来。
头肩顶形态的形成过程大体如下:
1、股票价格长期上升后,成交量大增,获利回吐压力亦增加,导致股票价格回落,成交量较大幅度下降,左肩形成。
2、股票价格回升,突破左肩之顶点,成交量亦可能因充分换手而创记录,但价位过高使多头产生恐慌心理,竞相抛售,股票价格回跌到前一低点水准附近,头部完成。
3、股票价格第三次上升,但前段的巨额成交量将不再重现,涨势亦不再凶猛,价位到达头部顶点之前即告回落,形成右肩。
这一次下跌时,股票价格急速穿过颈线,再回升时,其价格也仅能达到颈线附近,然后成为下跌趋势,头肩顶形态宣告完成。
2001年6月大盘就是以头肩顶见顶的,2218点为左肩、2245点为顶、2237点为右肩,在完成回抽之后股指“一江春水向东流”。
我们以此为例说明头肩顶实战技巧:
1、成交量。
左肩时要求量价配合,头部时由于多空双方大量换手,成交量也很大,但与左肩相比成交量已呈现颓废之势,不能有效地放量或低于左肩的水平,右肩与回抽过程中由于元气大伤,成交量呈现出持续萎缩的态势。
大盘在2245点构筑头肩顶时的成交量就呈现出这种多-少-多-少的特征。
2、颈线。
连结头部形态中的两点波谷所构成的水平压力线为颈线,在头肩顶中颈线不一定就是水平线,但不管颈线是向上还是向下倾斜,都改变不了自由落体下跌的命运。
大盘2245点时的头肩顶的颈线是向下倾斜的,表明下跌动力十分充足。
3、突破。
头肩顶向下突破颈线时,与头肩底不一样,不需要成交量的配合,即缩量突破也有效。
跌破后经常伴有回抽确认,突破一般以超过颈线3%为标准。
头肩顶的突破往往较头肩底要可靠得多,当然在实战中只要没有突破颈线,仍不能断定将反转下行,虽这将失去在头部的最佳出货机会,但要想卖出天价在实战中是十分困难的。
图中大盘在破位后的回抽过程就是最后的逃命线。
4、量度跌幅。
先量出头部至颈线的最大距离,由突破位置开始计算,向下减去最大距离即为头肩顶的量度跌幅。
这仅是理论上的跌幅,股价在完成量度跌幅之后仍有继续下跌的动力。
图中大盘在1861点时曾短暂企稳,但并没有改变继续下行的趋势。
图:头肩底形态
头肩底是头肩顶的倒转形态,是一个可靠的买进时机。
这一形态的构成和分析方法,除了在成交量方面与头肩顶有所区别外,其余与头肩顶类同,只是方向正好相反。
例如,上升改成下降,高点改成低点,支撑改成压力。
头肩底特征如下:
1、急速的下跌,随后止跌反弹,形成第一个波谷,这就是通常说的左肩。
形成左肩部分时,成交量在下跌过程中出现放大迹象,而在左肩最低点回升时则有减少的倾向。
2、第一次反弹受阻,股价再次下跌,并跌破了前一低点,之后股价再次止跌反弹形成了第二个波谷,这就是通常说的头部。
形成头部时,成交量会有所增加。
3、第三次反弹再次在第一次反弹高点处受阻,股价又开始第三次下跌,但股价到与第一个波谷相近的位置后就不下去了,成交量出现极度萎缩,此后股价再次反弹形成了第三个波谷,这就是通常说的右肩。
第三次反弹时,成交量显着增加。
4、第一次反弹高点和第二次反弹高点,用直线连起来就是一根阻碍股价上涨的颈线,但当第三次反弹时会在成交量配合下,将这根颈线冲破,使股价站在其上方。
投资者见到头肩底形态,应该想到这是个底部回升信号,此时不能再继续看空,而要随时做好进场抢筹准备。
一旦股价放量冲破颈线时就可考虑买进一些股票。
这通常称为第一买点。
如果股价冲破颈线回抽,并在颈线附近止跌回升再度上扬时可加码买进,这通常称为第二买点。
如果在上冲时买入,虽然风险很大,但收益却很可观。
史上五大经典头肩底形态
值得注意的是,头肩顶形态与头肩底形态在成交量配合方面的最大区别是:头肩顶形态完成后,向下突破颈线时,成交量不一定放大;而头肩底形态向上突破颈线,若没有较大的成交量出现,可靠性将大为降低,甚至可能出现假的头肩底形态。