曼昆宏观经济学最新英文版参考答案第25章
宏观经济学(第十版)N格里高利曼昆(2024)

02 国民收入核算与宏观经济指标
2024/1/28
8
国内生产总值(GDP)的核算
2024/1/28
生产法
通过核算一定时期内各生产单位所生产的全部最终产品的 价值总量来计算GDP,即各生产单位的总产值减去中间投 入后的余额。
支出法
通过核算一定时期内整个社会购买最终产品的总支出计算 GDP,包括个人消费支出、政府购买支出、固定资本形成 总额和净出口四部分。
失业的类型
根据失业的原因和性质,可以将 失业分为摩擦性失业、结构性失 业、周期性失业和自然失业等类 型。
失业的原因
失业的原因多种多样,包括经济 周期波动、产业结构调整、技术 进步、劳动力市场制度不完善、 信息不对称等。
2024/1/28
15
通货膨胀的定义、类型与原因
通货膨胀的定义
通货膨胀是指一般物价水平持续上涨的现象,即货币的购买力不断下降的过程。
17
04 货币、利率与金融市场
2024/1/28
18
货币的定义、职能与类型
01
02
03
货币的定义
货币是经济中人们用于购 买商品和劳务的一组资产 。
2024/1/28
货币的职能
货币在经济中主要有交易 媒介、价值尺度、支付手 段、价值贮藏等职能。
货币的类型
根据货币的流动性和可接 受性,可分为现金(如纸 币、硬币)、活期存款、 定期存款、储蓄存款等。
VS
人类发展指数(HDI)
联合国开发计划署提出的,包括预期寿命 、教育水平和生活质量三个方面的综合指 标。
2024/1/28
13
03 失业、通货膨胀与经济增长
2024/1/28
14
宏观经济学曼昆第六版课后答案

答:股票分析师在确定股票的价值时应该考虑公司未来的盈利能力。公司的盈利能力取决于以下因素:市场对其产品的需求、所面临的顾客忠诚度、面对的政府管制和税收等。因此,股票分析师就要考虑所有上述因素以决定公司的一股股票价值为多少。
6.描述有效市场假说,并给出一个与这种理论一致的证据。
2.现值(present value)
答:现值指按现行利率为获得一个既定的未来货币量而在今天所需要的货币量。现值可用倒求本金的方法计算。由终值求现值,称为贴现。在贴现时使用的利息率称为贴现率。现值的计算公式可由终值的计算公式导出:fvn?pv?1?i?,则有:
pv?fvn?1n?1?i?n
上述公式中的1
5.风险厌恶(risk averse)
答:风险厌恶又称“风险规避”,指不喜欢不确定性。风险厌恶者总是以无风险或低风险作为衡量各种备选方案优劣的标准,把那些可能发生风险的备选方案拒之于外。
6.多元化(diversification)
答:多元化又称分散化,指通过分散投资于多项资产来降低投资风险的一种投资方式。从理论上来讲,一个证券组合只要包含了足够多的相关性较弱(甚至负相关)的证券,就完全可能消除所有风险,但是现实中,各证券收益率之间的正相关程度较高,因为各证券的收益率在一定程度上受同一因素影响(如经济周期、利率的变化等),因此分散化投资可以消除资产组合的非系统性风险,但是并不能消除系统性风险。也就是说,随着纳入同一资产组合的资产的收益率之间的相关系数(或协方差)的减小,该资产组合的收益率的方差(或标准差)也随之减小。各个证券之间的收益率变化的相关性越弱,分散投资降低风险的效果就越明显。
9.基本面分析(fundamental analysis)
曼昆宏观经济学最新英文版参考答案第28章
Chapter 28Problems and Applications1. The labor force consists of the number of employed (142,076,000) plus the number of unemployed(7,497,000), which equals 149,573,000.To find the labor-force participation rate, we need to know the size of the adult population. Adding the labor force (149,573,000) to the number of people not in the labor force (76,580,000) gives the adult population of 226,153,000. The labor-force participation rate is the labor force (149,573,000) divided by the adult population (226,153,000) times 100%, which equals 66%.The unemployment rate is the number of unemployed (7,497,000) divided by the labor force(149,573,000) times 100%, which equals 5.0%.2. Many answers are possible.3. Men age 55 and over experienced the greatest decline in labor-force participation. This wasbecause of increased Social Security benefits and retirement income, encouraging retirement at an earlier age.4. Younger women experienced a bigger increase in labor-force participation than older womenbecause more of them have entered the labor force (in part because of social changes), so there are more two-career families. In addition, women have delayed having children until later in life and have reduced the number of children they have, so they are in the labor force for a greater proportion of their lives than was the case previously.5. The fact that employment increased 1.5 million while unemployment declined 0.6 million isconsistent with growth in the labor force of 0.9 million workers. The labor force constantlyincreases as the population grows and as labor-force participation increases, so the increase in the number of people employed may always exceed the reduction in the number unemployed.6. a. A construction worker who is laid off because of bad weather is likely to experienceshort-term unemployment, because the worker will be back to work as soon as theweather clears up.b. A manufacturing worker who loses her job at a plant in an isolated area is likely toexperience long-term unemployment, because there are probably few other employmentopportunities in the area. She may need to move somewhere else to find a suitable job,which means she will be out of work for some time.c. A worker in the stagecoach industry who was laid off because of the growth of railroads islikely to be unemployed for a long time. The worker will have a lot of trouble findinganother job because his entire industry is shrinking. He will probably need to gainadditional training or skills to get a job in a different industry.d. A short-order cook who loses his job when a new restaurant opens is likely to find anotherjob fairly quickly, perhaps even at the new restaurant, and thus will probably have only ashort spell of unemployment.e. An expert welder with little education who loses her job when the company installsautomatic welding machinery is likely to be without a job for a long time, because she lacksthe technological skills to keep up with the latest equipment. To remain in the weldingindustry, she may need to go back to school and learn the newest techniques.12 Chapter 28/Unemployment7. Figure 2 shows a diagram of the labor market with a binding minimum wage. At the initial minimumwage (m1), the quantity of labor supplied L1S is greater than the quantity of labor demanded L1D, and unemployment is equal to L1S−L1D. An increase in the minimum wage to m2 leads to anincrease in the quantity of labor supplied to L2S and a decrease in the quantity of labor demanded to L2D. As a result, unemployment increases as the minimum wage rises.Figure 28. a. Figure 3 illustrates the effect of a union being established in the manufacturing labormarket. In the figure on the left, the wage rises from w1U to w2U and the quantity of labordemanded declines from U1 to U2D. Because the wage is higher, the quantity supplied oflabor increases to U2S, so there are U2S−U2D unemployed workers in the unionizedmanufacturing sector.b. When those workers who become unemployed in the manufacturing sector seekemployment in the service labor market, shown in the figure on the right, the supply oflabor shifts to the right from S1 to S2. The result is a decline in the wage in thenonunionized service sector from w1N to w2N and an increase in employment in thenonunionized service sector from N1 to N2.Chapter 28/Unemployment 3Figure 39. a. When the Japanese developed a strong auto industry, U.S. auto demand became moreelastic as a result of increased competition. With more elastic demand for autos, theelasticity of demand for American autoworkers increased.b. Because the rise in auto imports made the demand for autoworkers more elastic, tomaintain a higher-than-competitive wage rate requires a greater reduction in the quantityof labor demanded. So the union had to choose between allowing the union wage todecline or facing the loss of many jobs.c. Given the trade-off faced by the union, the growth of the Japanese auto industry forcedthe union wage to move closer to the competitive wage.10. a. If a firm was not providing such benefits prior to the legislation, the curve showing thedemand for labor would shift down by exactly $4 at each quantity of labor, because thefirm would not be willing to pay as high a wage given the increased cost of the benefits.b. If employees value the benefit by exactly $4 per hour, they would be willing to work thesame amount for a wage that's $4 less per hour, so the supply curve of labor shifts downby exactly $4.Figure 4c. Figure 4 shows the equilibrium in the labor market. Because the demand and supply curvesof labor both shift down by $4, the equilibrium quantity of labor is unchanged and thewage rate declines by $4. Both employees and employers are just as well off as before.d. If the minimum wage prevents the wage from falling, the result will be increasedunemployment, as Figure 5 shows. Initially, the equilibrium quantity of labor is L1 and theequilibrium wage is w1, which is $3 lower than the minimum wage w m. After the law ispassed, demand falls to D2 and supply rises to S2. Because of the minimum wage, thequantity of labor demanded (L2D) will be smaller than the quantity supplied (L2S). Thus,there will be unemployment equal to L2S–L2D.4 Chapter 28/UnemploymentFigure 5Figure 6e. If the workers do not value the mandated benefit at all, the supply curve of labor does notshift down. As a result, the wage rate will decline by less than $4 and the equilibriumquantity of labor will decline, as shown in Figure 6. Employers are worse off, because they now pay a greater total wage plus benefits for fewer workers. Employees are worse off,because they get a lower wage and fewer are employed.。
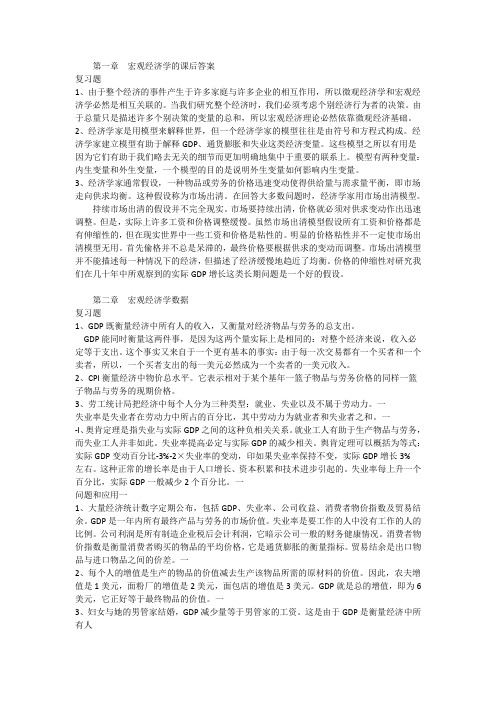
曼昆宏观经济学最新英文版参考答案第24章
Chapter 24Problems and Applicat ions1. a. Find the price of each good in each year:b. If 2006 is the base year, the market basket used to compute the CPI is 100 heads ofcauliflower, 50 bunches of broccoli, and 500 carrots. We must now calculate the cost of themarket basket in each year:2006: (100 x $2) + (50 x $1.50) + (500 x $.10) = $3252007: (100 x $3) + (50 x $1.50) + (500 x $.20) = $475Then, using 2006 as the base year, we can compute the CPI in each year:2006: $325/$325 x 100 = 1002007: $475/$325 x 100 = 146c. We can use the CPI to compute the inflation rate for 2007:(146 − 100)/100 x 100% = 46%2. Many answers are possible.3. a. The percentage change in the price of tennis balls is (2 – 2)/2 × 100% = 0%.The percentage change in the price of golf balls is (6 – 4)/4 × 100% = 50%.The percentage change in the price of Gatorade is (2 – 1)/1 × 100% = 100%.b. The cost of the market basket in 2006 is ($2 × 100) + ($4 × 100) + ($1 × 200) = $200 +$400 + $200 = $800.The cost of the market basket in 2007 is ($2 × 100) + ($6 × 100) + ($2 × 200) = $200 +$600 + $400 = $1,200.The percentage change in the cost of the market basket from 2006 to 2007 is (1,200 –800)/800 × 100% = 50%.c. This would lower my estimation of the inflation rate because the value of a bottle ofGatorade is now greater than before. The comparison should be made o n a per-ouncebasis.d. More flavors enhance consumers’ well-being. Thus, this would be considered a change inquality and would also lower my estimate of the inflation rate.4. a. Because the increase in cost was considered a quality improvement, there was no increaseregistered in the CPI.b. The argument in favor of this is that consumers are getting a better good than before, sothe price increase equals the improvement in quality. The problem is that the increasedcost might exceed the value of the improvement in air quality, so consumers are worse off.In this case, it would be better for the CPI to at least partially reflect the higher cost.5. a. introduction of new goods; b. unmeasured quality change; c. substitution bias; d. unmeasured1Chapter 24/Measuring the Cost of Living 2quality change; e. substitution bias6. a. ($0.75 − $0.15)/$0.15 x 100% = 400%.b. ($14.32 − $3.23)/$3.23 x 100% = 343%.c. In 1970: $0.15/($3.23/60) = 2.8 minutes. In 2000: $0.75/($14.32/60) = 3.1 minutes.d. Workers' purchasing power fell in terms of newspa pers.7. a. If the elderly consume the same market basket as other people, Social Security wouldprovide the elderly with an improvement in their standard of living each year because theCPI overstates inflation and Social Security payments are tied to the CPI.b. Because the elderly consume more health care than younger people do, and becausehealth care costs have risen faster than overall inflation, it is possible that the elderly areworse off. To investigate this, you would need to put together a mar ket basket for theelderly, which would have a higher weight on health care. You would then compare the risein the cost of the "elderly" basket with that of the general basket for CPI.8. When bracket creep occurred, inflation increased people's nominal incomes, pushing them intohigher tax brackets, so they had to pay a higher proportion of their incomes in taxes, even though they were not getting higher real incomes. As a result, real tax revenue rose.9. In deciding how much income to save for retirement, workers should consider the real interest rate,because they care about their purchasing power in the future, not the number of dollars they will have.10. a. When inflation is higher than was expected, the real interest rate is lower than expected.For example, suppose the market equilibrium has an expected real interest rate of 3% andpeople expect inflation to be 4%, so the nominal interest rate is 7%. If inflation turns outto be 5%, the real interest rate is 7% minus 5% equals 2%, which is less than the 3% thatwas expected.b. Because the real interest rate is lower than was expected, the lender loses and theborrower gains. The borrower is repaying the loan with dollars that are worth less than wasexpected.c. Homeowners in the 1970s who had fixed-rate mortgages from the 1960s benefited fromthe unexpected inflation, while the banks that made the mortgage loans were harmed.。
曼昆宏观经济学-课后答案-中文版
3、劳工统计局把经济中每个人分为三种类型:就业、失业以及不属于劳动力。一
失业率是失业者在劳动力中所占的百分比,其中劳动力为就业者和失业者之和。一
-I、奥肯定理是指失业与实际GDP之间的这种负相关关系。就业工人有助于生产物品与劳务,
而失业工人并非如此。失业率提高必定与实际GDP的减少相关。舆肯定理可以概括为等式:
济活动不完善的衡量。一旦男管家的工作成为他家务劳动的一部分,他的劳务就不再计入GDP。
这例子说明,GDP不包括任何在家里产出的价值。同样,GDP也不包括耐用品(汽车以及电冰箱
等)的估算租金和非法贸易等物品或劳务。一
_I、政府采购、投资、净出口、消费、投资一
6、(1)2000年名义GDP-10000000,2010年名义GDP-15200000,2010年实际GDP-IOOOOOOO
清模型无用。首先偷格并不总是呆滞的,最终价格要根据供求的变动而调整。市场出清模型
并不能描述每一种情况下的经济,但描述了经济缓慢地趋近了均衡。价格的伸缩性对研究我
们在几十年中所观察到的实际GDP增长这类长期问题是一个好的假设。
第二章宏观经济学数据
复习题
1、GDP既衡量经济中所有人的收入,又衡量对经济物品与劳务的总支出。
2010年GDP隐含的价格平减指数-1. 52,2010年(’PI-1.6一
(2)隐含的价格平减指数是帕氏指数,因为它是用一篮子可变物品计算的。CPI是拉斯派
尔指数,因为它是用一篮子固定物品计算的。由(1)中计算得2010年隐含的价格平减指数
是1.52,它表示物价从2000年到2010年上涨了5)0,o;而(1PI是1.6,它表示物价从2000年到2010
随着劳动力增加而递减。因此,实际工资下降。一
(完整版)曼昆宏观经济学原理答案
第一篇导言复习题第一章宏观经济学的科学1、解释宏观经济学和微观经济学之间的差距,这两个领域如何相互关联?【答案】微观经济学研究家庭和企业如何作出决策以及这些决策在市场上的相互作用。
微观经济学的中心原理是家庭和企业的最优化——他们在目的和所面临的约束条件下可以让自己的境况更好。
而相对的,宏观经济学研究经济的整体情况,它主要关心总产出、总就业、一般物价水平和国际贸易等问题,以及这些宏观指标的波动趋势与规律。
应该看到,宏观经济学研究的这些宏观经济变量是以经济体系中千千万万个体家庭和企业之间的相互作用所构成的。
因此,微观经济决策总是构成宏观经济模型的基础,宏观经济学必然依靠微观经济基础。
2、为什么经济学家建立模型?【答案】一般来说,模型是对某些具体事物的抽象,经济模型也是如此。
经济模型可以简洁、直接地描述所要研究的经济对象的各种关系。
这样,经济学家可以依赖模型对特定的经济问题进行研究;并且,由于经济实际不可控,而模型是可控的,经济学家可以根据研究需要,合理、科学的调整模型来研究各种经济情况。
另外,经济模型一般是数学模型,而数学是全世界通用的科学语言,使用规范、标准的经济模型也有利于经济学家正确表达自己的研究意图,便于学术交流。
3、什么是市场出清模型?什么时候市场出清的假设是适用的?【答案】市场出清模型就是供给与需求可以在价格机制调整下很快达到均衡的模型。
市场出清模型的前提条件是价格是具有伸缩性的(或弹性)。
但是,我们知道价格具有伸缩性是一个很强的假设,在很多实际情况下,这个假设都是不现实的。
比如:劳动合同会使劳动力价格在一段时期内具有刚性。
因此,我们必须考虑什么情况下价格具有伸缩性是合适的。
现在一般认为,在研究长期问题时,假设价格具有伸缩性是合理的;而在研究短期问题时,最好假设价格具有刚性。
因为,从长期看,价格机制终将发挥作用,使市场供需平衡,即市场出清,而在短期,价格机制因其他因素制约,难以很快使市场出清。
曼昆经济学原理答案21—25
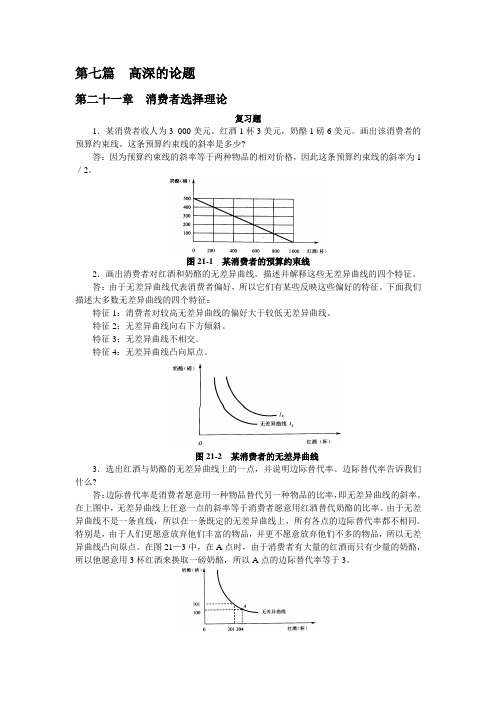
第七篇高深的论题第二十一章消费者选择理论复习题1.某消费者收人为3 000美元。
红酒1杯3美元,奶酪1磅6美元。
画出该消费者的预算约束线。
这条预算约束线的斜率是多少?答:因为预算约束线的斜率等于两种物品的相对价格,因此这条预算约束线的斜率为1/2。
图21-1 某消费者的预算约束线2.画出消费者对红酒和奶酪的无差异曲线。
描述并解释这些无差异曲线的四个特征。
答:由于无差异曲线代表消费者偏好,所以它们有某些反映这些偏好的特征。
下面我们描述大多数无差异曲线的四个特征:特征1:消费者对较高无差异曲线的偏好大于较低无差异曲线。
特征2:无差异曲线向右下方倾斜。
特征3:无差异曲线不相交。
特征4:无差异曲线凸向原点。
图21-2 某消费者的无差异曲线3.选出红酒与奶酪的无差异曲线上的一点,并说明边际替代率。
边际替代率告诉我们什么?答:边际替代率是消费者愿意用一种物品替代另一种物品的比率,即无差异曲线的斜率。
在上图中,无差异曲线上任意一点的斜率等于消费者愿意用红酒替代奶酪的比率。
由于无差异曲线不是一条直线,所以在一条既定的无差异曲线上,所有各点的边际替代率都不相同。
特别是,由于人们更愿意放弃他们丰富的物品,并更不愿意放弃他们不多的物品,所以无差异曲线凸向原点。
在图21—3中,在A点时,由于消费者有大量的红酒而只有少量的奶酪,所以他愿意用3杯红酒来换取一磅奶酪,所以A点的边际替代率等于3。
图21-3 凸向原点的无差异曲线4.说明消费者的预算约束线和红酒与奶酪的无差异曲线。
说明最优消费选择。
如果1杯红酒的价格是3美元,而1磅奶酪的价格是6美元,在这种最优时边际替代率是多少?答:在最优消费选择时,无差异曲线的斜率等于预算约束线的斜率,也就是无差异曲线与预算约束线相切的那一点。
本题中无差异曲线的斜率是奶酪和红酒之间的替代率,而预算约束线的斜率是奶酪和红酒的相对价格,因此,消费者在作出自己的消费选择时把红酒和奶酪的相对价格作为既定的,然后选择使他的边际替代率等于红酒和奶酪相对价格的那一点。
曼昆宏观经济学最新英文版参考答案第34章

曼昆宏观经济学最新英⽂版参考答案第34章Chapter 34Problems and Applicat ions1. a. When the Fed’s bond traders buy bonds in open-market operations, themoney-supply curve shifts to the right from MS1 to MS2, as shown in Figure 1.The result is a decline in the interest rate.Figure 1Figure 2b. When an increase in credit card availability reduces the cash people hold, themoney-demand curve shifts to the left from MD1 to MD2, as shown in Figure 2.The result is a decline in the interest rate.c. When the Federal Reserve reduces reserve requirements, the money supply increases, so the money-supply curve shifts to the right from MS1 to MS2, asshown in Figure 1. The result is a decline in the interest rate.d. When households decide to hold more money to use for holiday shopping, themoney-demand curve shifts to the right from MD1 to MD2, as shown in Figure3. The result is a rise in the interest rate.Figure 3e. When a wave of optimism boosts business investment and expands aggregatedemand, money demand increases from MD1 to MD2 in Figure 3. The increase in money demand increases the interest rate.Figure 42. a. The increase in the money supply will cause the equilibrium interest rate todecline, as shown in Figure 4. Households will increase spending and willinvest in more new housing. Firms too will increase investment spending. Thiswill cause the aggregate demand curve to shift to the right as shown in Figure5.Figure 5b. As shown in Figure 5, the increase in aggregate demand will cause an increase in both output and the price level in the short run.c. When the economy makes the transition from its short-run equilibrium to its long-run equilibrium, short-run aggregate supply will decline, causing the price level to rise even further.d. The increase in the price level will cause an increase in the demand for money, raising the equilibrium interest rate.e. Yes. While output initially rises because of the increase in aggregate demand, it will fall once short-run aggregate supply declines. Thus, there is no long-run effect of the increase in the money supply on real output.Figure 63. a. When more ATMs are available, money demand is reduced and themoney-demand curve shifts to the left from MD1 to MD2, as shown in Figure 6.If the Fed does not change the money supply, which is at MS1, the interest rate will decline from r1 to r2. The decline in the interest rate shifts theaggregate-demand curve to the right, as consumption and investment increase.b. If the Fed wants to stabilize aggregate demand, it should reduce the money supply to MS2, so the interest rate will remain at r1 and aggregate demand will not change.4. A tax cut that is permanent will have a bigger impact on consumer spending and aggregate demand. If the tax cut is permanent, consumers will view it as addingsubstantially to their financial resources, and they will increase their spendingsubstantially. If the tax cut is temporary, consumers will view it as adding just a little to their financial resources, so they will not increase spending as much.5. a. The current situation is shown in Figure 7.Figure 7b. The Fed will want to stimulate aggregate demand. Thus, it will need to lowerthe interest rate by increasing the money supply. This could be achieved if the Fed purchases government bonds from the public.Figure 8c. As shown in Figure 8, the Fed's purchase of government bonds shifts thesupply of money to the right, lowering the interest rate.d. The Fed's purchase of government bonds will increase aggregate demand asconsumers and firms respond to lower interest rates. Output and the pricelevel will rise as shown in Figure 9.Figure 96. a. Legislation allowing banks to pay interest on checking deposits increases the return to money relative to other financial assets, thus increasing money demand.b. If the money supply remained constant (at MS1), the increase in the demand for money would have raised the interest rate, as shown in Figure 10. The risein the interest rate would have reduced consumption and investment, thus reducing aggregate demand and output.c. To maintain a constant interest rate, the Fed would need to increase the money supply from MS1 to MS2. Then aggregate demand and output would be unaffected.Figure 107. a. If there is no crowding out, then the multiplier equals 1/(1 –MPC). Because the multiplier is 3, then MPC = 2/3.b. If there is crowding out, then the MPC would be larger than 2/3. An MPC that is larger than 2/3 would lead to a larger multiplier than 3, which is then reduced down to 3 by the crowding-out effect.8. a. The initial effect of the tax reduction of $20 billion is to increase aggregatedemand by $20 billion x 3/4 (the MPC) = $15 billion.b. Additional effects follow this initial effect as the added incomes are spent. Thesecond round leads to increased consumption spending of $15 billion x 3/4 =$11.25 billion. The third round gives an increase in consumption of $11.25billion x 3/4 = $8.44 billion. The effects continue indefinitely. Adding them allup gives a total effect that depends on the multiplier. With an MPC of 3/4, themultiplier is 1/(1 – 3/4) = 4. So the total effect is $15 billion x 4 = $60 billion.c. Government purchases have an initial effect of the full $20 billion, becausethey increase aggregate demand directly by that amount. The to tal effect of anincrease in government purchases is thus $20 billion x 4 = $80 billion. Sogovernment purchases lead to a bigger effect on output than a tax cut does.The difference arises because government purchases affect aggregatedemand by the full amount, but a tax cut is partly saved by consumers, andtherefore does not lead to as much of an increase in aggregate demand.9. If government spending increases, aggregate demand rises, so money demand rises.The increase in money demand leads to a rise in the interest rate and thus a decline in aggregate demand if the Fed does not respond. But if the Fed maintains a fixed interest rate, it will increase money supply, so aggregate demand will not decline. Thus, theeffect on aggregate demand from an increase in government spending will be larger if the Fed maintains a fixed interest rate.10. a. Expansionary fiscal policy is more likely to lead to a short-run increase ininvestment if the investment accelerator is large. A large investmentaccelerator means that the increase in output caused by expansionary fiscalpolicy will induce a large increase in investment. Without a large accelerator,investment might decline because the increase in aggregate demand will raisethe interest rate.b. Expansionary fiscal policy is more likely to lead to a short-run increase ininvestment if the interest sensitivity of investment is small. Because fiscalpolicy increases aggregate demand, thus increasing money demand and theinterest rate, the greater the sensitivity of investment to the interest rate thegreater the decline in investment will be, which will offset the positiveaccelerator effect.11. a. Tax revenue declines when the economy goes into a recession because taxesare closely related to economic activity. In a recession, people's incomes andwages fall, as do firms' profits, so taxes on these things decline.b. Government spending rises when the economy goes into a recession becausemore people get unemployment-insurance benefits, welfare benefits, andother forms of income support.c. If the government were to operate under a strict balanced-budget rule, it would have to raise tax rates or cut government spending in a recession. Both would reduce aggregate demand, making the recession more severe.12. a. If there were a contraction in aggregate demand, the Fed would need to increase the money supply to increase aggregate demand and stabilize the price level, as shown in Figure 11. By increasing the money supply, the Fed is able to shift the aggregate-demand curve back to AD1 from AD2. This policy stabilizes output and the price level.Figure 11b. If there were an adverse shift in short-run aggregate supply, the Fed would need to decrease the money supply to stabilize the price level, shifting the aggregate-demand curve to the left from AD1 to AD2, as shown in Figure 12. This worsens the recession caused by the shift in aggregate supply. To stabilize output, the Fed would need to increase the money supply, shifting the aggregate-demand curve from AD1 to AD3. However, this action would raise the price level.。
- 1、下载文档前请自行甄别文档内容的完整性,平台不提供额外的编辑、内容补充、找答案等附加服务。
- 2、"仅部分预览"的文档,不可在线预览部分如存在完整性等问题,可反馈申请退款(可完整预览的文档不适用该条件!)。
- 3、如文档侵犯您的权益,请联系客服反馈,我们会尽快为您处理(人工客服工作时间:9:00-18:30)。
Chapter 25Problems and Applications1. The facts that countries import many goods and services yet must produce a large quantity ofgoods and services themselves to enjoy a high standard of living are reconciled by noting that there are substantial gains from trade. In order to be able to afford to purchase goods from othercountries, an economy must generate income. By producing many goods and services, then trading them for goods and services produced in other countries, a nation maximizes its standard of living.2. a. More investment would lead to faster economic growth in the short run.b. The change would benefit many people in society who would have higher incomes as theresult of faster economic growth. However, there might be a transition period in whichworkers and owners in consumption-good industries would get lower incomes, andworkers and owners in investment-good industries would get higher incomes. In addition,some group would have to reduce their spending for some time so that investment couldrise.3. a. Private consumption spending includes buying food and buying clothes; private investmentspending includes people buying houses and firms buying computers. Many otherexamples are possible. Education can be considered as both consumption and investment.b. Government consumption spending includes paying workers to administer governmentprograms; government investment spending includes buying military equipment andbuilding roads. Many other examples are possible. Government spending on healthprograms is an investment in human capital. This is truer for spending on health programsfor the young rather than those for the elderly.4. The opportunity cost of investing in capital is the loss of consumption that results from redirectingresources toward investment. Over-investment in capital is possible because of diminishingmarginal returns. A country can "over-invest" in capital if people would prefer to have higherconsumption spending and less future growth. The opportunity cost of investing in human capital is also the loss of consumption that is needed to provide the resources for investment. A countrycould "over-invest" in human capital if people were too highly educated for the jobs they couldget for example, if the best job a Ph.D. in philosophy could find is managing a restaurant.5. a. When a German firm opens a factory in South Carolina, it represents foreign directinvestment.b. The investment increases U.S. GDP because it increases production in the United States.The effect on U.S. GNP would be smaller because the owners would get paid a return ontheir investment that would be part of German GNP rather than U.S. GNP.6. a. The United States benefited from the Japanese investment because it made our capitalstock larger, increasing our economic growth.b. It would have been better for the United States to make the investments itself becausethen it would have received the returns on the investment itself, instead of the returnsgoing to Japan.7. Greater educational opportunities for women could lead to faster economic growth in the countriesof South Asia because increased human capital would increase productivity and there would beexternal effects from greater knowledge in the country. Second, increased educational1Chapter 25/Production and Growth 2opportunities for young women may lower the population growth rate because such opportunities raise the opportunity cost of having a child.8. a. Individuals with higher incomes have better access to clean water, medical care, and goodnutrition.b. Healthier individuals are likely to be more productive.c. Understanding the direction of causation will help policymakers place proper emphasis onthe programs that will achieve both greater health and higher incomes.9. a. Political stability could lead to strong economic growth by making the country attractive toinvestors. The increased investment would raise economic growth.b. Strong economic growth could lead to political stability because when people have highincomes they tend to be satisfied with the political system and are less likely to overthrowor change the government.10. a. If output is rising and the number of workers is declining, then output per worker must berising.b. Policymakers should not be concerned as long as output in the manufacturing sector is notdeclining. The reduction in manufacturing jobs will allow labor resources to move to otherindustries, increasing total output in the economy. An increase in productivity of workers(as measured by output per worker) is beneficial to the economy.。