A CATALOGUE OF IJK PHOTOMETRY OF PNe WITH DENIS
A Spectroscopic Search for the non-nuclear Wolf-Rayet Population of the metal-rich spiral g
a r X i v :a s t r o -p h /0506343v 1 15 J u n 2005Astronomy &Astrophysics manuscript no.2262February 2,2008(DOI:will be inserted by hand later)A Spectroscopic Search for the non-nuclear Wolf-Rayet Population of the metal-rich spiral galaxy M 83⋆L.J.Hadfield 1,Paul A.Crowther 1,H.Schild 2,and W.Schmutz 31Department of Physics &Astronomy,University of Sheffield,Hicks Building,Hounsfield Rd,Sheffield,S37RH,United Kingdome-mail:L .Hadfield@sheffi 2Institut f¨u r Astronomie,ETH-Zentrum,CH 8092Z¨u rich,Switzerland3Physikalisch-Meteorologisches Observatorium,CH-7260Davos,Switzerlandthe date of receipt and acceptance should be inserted laterAbstract.We present a catalogue of non-nuclear regions containing Wolf-Rayet stars in the metal-rich spiral galaxy M 83(NGC 5236).From a total of 283candidate regions identified using He ii λ4686imaging with VLT-FORS2,Multi Object Spectroscopy of 198regions was carried out,confirming 132WR sources.From this sub-sample,an exceptional content of ∼1035±300WR stars is inferred,with N(WC)/N(WN)∼1.2,continuing the trend to larger values at higher metallicity amongst Local Group galaxies,and greatly exceeding current evolutionary predictions at high te-type stars dominate the WC population of M 83,with N(WC8–9)/N(WC4–7)=9and WO subtypes absent,consistent with metallicity dependent WC winds.Equal numbers of late to early WN stars are observed,again in contrast to current evolutionary predictions.Several sources contain large numbers of WR stars.In particular,#74(alias region 35from de Vaucouleurs et al.)contains ∼230WR stars,and is identified as a Super Star Cluster from inspection of archival HST/ACS images.Omitting this starburst cluster would result in revised statistics of N(WC)/N(WN)∼1and N(WC8–9)/N(WC4–7)∼6for the ‘quiescent’disk population.Including recent results for the nucleus and accounting for incompleteness in our spectroscopic sample,we suspect the total WR population of M 83may exceed 3000stars.Key words.galaxies:individual:M 83–stars:Wolf-Rayet1.IntroductionMassive stars play a major role in the ecology of galaxies via radiative,mechanical and chemical feedback (Smith,2005).Wolf-Rayet (WR)stars in particular,albeit rare and short-lived,make a significant contribution to their environment via the mechanical return of nuclear pro-cessed material to the interstellar medium (ISM)through their exceptionally powerful stellar winds.Metallicity,Z ,is a key factor in determining the number and subtype distribution of a WR population.Although the metallicity dependence of WR wind proper-ties still remains unclear,mass-loss prior to this phase has been established to depend on metallicity,with the lat-est models predicting ˙M∝Z ∼0.8for O stars (Vink et al.,2001).Evolutionary models for single stars predict that the minimum mass cut-offrequired for WR formation should decrease as metal content increases.It is antici-pated that the minimum mass required forprogression2L.J.Hadfield et al.:WR population of M83super-Solar metallicity,but its unfavourable inclination and large spatial extent makes surveying the complete WR population very challenging.In order to increase the vari-ety of galaxies sampled,our group has begun to look be-yond the Local Group(e.g.NGC300,Schild et al.,2003).Galaxies hosting substantive WR populations are known as‘WR galaxies’(Kunth&Sargent,1981; Schaerer et al.,1999b),where the number of WR stars ranges from∼35in NGC1569-A(Gonzalez Delgado et al., 1997)to2×104in Mrk309(Schaerer et al.,2000).Within specifically metal-rich environments,previous studies of WR populations have generally been restricted to in-tegrated spectra from bright star forming knots(e.g. Schaerer et al.,1999a)or H ii regions(e.g.Pindao et al., 2002).Here we present the results of a deep imaging and spectroscopic survey of the disk WR population within the metal-rich galaxy M83,in which WR signatures have previously been identified by Rosa&Richter(1988)and Bresolin&Kennicutt(2002).M83(NGC5236)is a massive,grand-design southern spiral(SBc(s)II)with on-going star formation in its spiral arms plus an active nuclear starburst(Elmegreen et al., 1998;Harris et al.,2001).M83is the principal mem-ber of a small galaxy group(∼11members)within the Centaurus A complex(Karachentsev et al.,2002). Located at a distance of4.5±0.3Mpc(Thim et al.,2003), its favourable inclination and apparently high metal abun-dance of log(O/H)+12=9.2(Bresolin&Kennicutt,2002) makes M83an ideal candidate for studies of massive stel-lar populations at high metallicity.More recently,oxygen abundances in metal-rich galax-ies have been revised downward(Pilyugin et al.,2004; Bresolin et al.,2004),such that M83may have a metal abundance closer to log(O/H)+12=9.0(Bresolin,2004, m.),i.e.approximately twice the Solar oxy-gen abundance of log(O/H)+12=8.66recently derived by Asplund et al.(2004).We present the results of an imaging and spectro-scopic survey of the WR content of M83using the ESO Very Large Telescope(VLT).The present paper com-plements the initialfindings of this study reported in Crowther et al.(2004,hereafter Paper I).In Sect.2we briefly describe the observations and data reduction tech-niques employed.Section3discusses the method followed to obtain a global WR population of M83.Sect.4dis-cusses the properties of metal rich WR stars with those of Local Group galaxies and evolutionary models.Finally, conclusions are drawn in Sect.5.2.Observations and data reductionWe have observed M83with the ESO Very Large Telescope UT4(Yepun)and Focal Reduced/Low Dispersion Spectrograph#2(FORS2).The detector con-sists of a mosaic of two2048×1024MIT/LL CCDs which in conjunction with the standard collimator provides a field-of-view6.8′×6.8′and an image scale of0.126′′/pixel. Photometric observations of M83were made between May–June2002with follow-up spectroscopic data being acquired during April–June2003.2.1.ImagingM83subtends12.9′by11.5′on the sky,preventing it be-ing imaged by a single FORS2frame.In order to obtain complete coverage,the galaxy was divided into four over-lapping regions,covering the NE(Field A),NW(B),SE (C)and SW(D)as indicated in Fig.1.Occulting bars were positioned in Field C to prevent detector saturation by bright foreground stars.The central15′′appears sat-urated on all images obtained,and as a result the WR population of the nucleus can not be discussed further.FORS2was used on2June2002to obtain narrow-band images with central wavelengths4684˚A,4781˚A and band widths of66˚A and68˚A respectively.These were obtained consecutively for each Field in seeing condi-tions between0.6–0.8′′1with individual exposures of 1800s.Theλ4684filter is coincident with the strong WR emission features which incorporates the N iii(λ4640˚A), C iii(λ4650˚A)and He ii(λ4686˚A)emission lines,whereas the latter samples a wavelength region relatively free from emission,providing a measure of the continuum level.In addition to these,2exposures(60s and600s) were taken using narrow-band on-and off-Hαfilters (λ6563,6665˚A,FWHM=61,65˚A)on16May2002. Finally,in order to supplement the primary dataset,2ex-posures(60s and120s)were also acquired using a Bessell Bfilter on21May2002.2.2.PhotometryImages were prepared following standard procedures i.e. debiased,flatfield corrected and cosmic ray cleaned. Photometry of individual sources within M83was per-formed using the package daophot,a point-spread func-tion(PSF)fitting routine within iraf.Absolute pho-tometry in the broad-band Bfilter was achieved with the aid of photometric standardfields Ru152and PG 1528+062(containing a total of10photometric standards, 11.9≤B≤16.3).For the narrow-band images such stan-dards are not available and photometric zero-points have been obtained by observing spectrophotometric standards LTT7987(B=12.2)and G138-31(B=16.5).The majority of our sources appear point-like on the ground-based images.However,a number of bright sources are surrounded by a faint,extended halo,which was not accounted for in the PSF photometry and as a result only a lower limit to the magnitude is given,based on PSF photometry.A further subset of the bright sources are spatially extended,indicating that PSF photometry is in-appropriate,as indicated in Table A1in the appendix.Typical formal photometric errors range between 0.02mag(∼18mag),0.05mag(∼20mag)and0.08magL.J.Hadfield et al.:WR population of M833Fig.1.Four combined HαVLT FORS2frames of M83. The overall size of the image is∼12′×12′.Thefields A, B,C and D used to image M83are marked.North is up and east is to the left of the image.(∼22mag).Significantly higher errors,of up to0.15mag, are obtained for regions of the galaxy where the back-ground levels are high,or they are located in spatially crowded regions.As a consistency check we have compared results ob-tained for the two Bessell B exposures(for which the PSF model was based on different template stars)and also de-rived magnitudes for objects which appear in multiple fields.Excellent agreement was observed in both cases, with results agreeing to within the formal errors.In a mi-nority of cases this was not achieved due to severe crowd-ing.2.3.Candidate SelectionWR candidates were identified by searching for He ii/ C iii excess emission(atλ4684)relative to the contin-uum(λ4781),i.e.a negative value of∆m=mλ4684-mλ4781.The optimal method of identifying suitable candi-dates was found to be via‘blinking’individualλ4781and λ4684frames together with the difference image obtained by subtracting theλ4781image from theλ4684frame.In total,283candidateλ4684emission sources were identi-fied.For75%of our candidates we have obtained a magni-tude in at least theλ4684filter.For cases where we did not obtain photometry,the object was either too faint or was located in a spatially crowded region.In addition,for a significant fraction of the fainter sources it was not pos-sible to measure aλ4871parison between mλ4781magnitude and mλ4684excess of the WR candidates located in M83. Regions which have been spectroscopically observed and subsequently eliminated or classified as WR regions are presented in the key.Regions which still await spectro-scopic observations are also marked.Sources for which PSF photometry was unavailable are not marked.Candidates were grouped according to continuum brightness,∆m,and association with underlying H ii re-gions.To ensure we spectroscopically observed a repre-sentative sample,a selection from each group was cho-sen for spectroscopic follow up.In Fig.2we show∆m as a function of continuum magnitude for the sources in which WR signatures were either spectroscopically con-firmed,rejected or no spectroscopy was obtained,i.e.the remaining candidates.The majority of confirmed sources have aλ4684excess between–1.5≤∆m≤–0.4mag,al-though a few do exhibit rather smaller values of∆m.In contrast,all rejected regions have∆m≥–0.2mag,sug-gesting that remaining candidates which display a moder-ateλ4684excess should represent regions that genuinely host WR stars,together with a subset of those for with ∆m∼0.0mag.2.4.SpectroscopySpectroscopic data was obtained using FORS2with the Multi Object Spectroscopy(MOS)mode.MOS datasets of individual WR candidates were obtained during seeing conditions of∼0.5–1.0′′,using a slit width of0.8′′.The CCD was binned by a factor of2in the dispersion di-rection,resulting in a dispersion of3.3˚A pixel−1with the 300V grism and a spectral resolution of∼7˚A,as mea-sured from comparison arc lines.The wavelength range of individual targets depended on their position within the MOS mask but typical wavelength coverage was∼3700˚A to∼7500˚A.MOS allows the spectra of up to19candidates to be recorded simultaneously.However,due to positional limi-tations this was generally restricted to∼15,supplemented where possible by H ii regions.In total,198candidates have been spectroscopically observed using17different MOS masks.To maximise continuum S/N,sources were4L.J.Hadfield et al.:WR population of M83 Table1.FORS2Multi Object Spectroscopy(MOS)ob-serving log for M83.2003-04-06D23×9000.62003-04-13D11×24000.7D33×5000.7D53×6000.52003-05-21C23×9000.9C33×2400.92003-05-26A2,B23×9000.7,0.8A53×6000.8A43×2400.6L.J.Hadfield et al.:WR population of M 8353.1.Interstellar reddeningEstimates of the interstellar reddening for our confirmed WR sources have generally been derived using measure-ments of the nebular H α(accounting for nearby [N ii ]emission)and H βfeatures present in the extracted spec-tra.Assuming Case B recombination theory for typi-calelectron densities of 102cm −3and a temperature of 104K (Hummer &Storey,1987),we obtain 0.2≤E(B-V)=c (H β)/1.46≤0.8mag for the majority of the sources,with a few outliers,and typical formal uncertainty of ±0.02mag.Where Balmer emission was observed,typi-cal H βequivalent widths lay in the range and ∼20to ∼150˚A .Consequently,the underlying stellar absorption components (≤1˚A at H β)are neglected.In 41sources no nebular lines were observed.For those with a well defined continuum,E(B–V)was estimated by assuming an intrinsic optical flux distribution equiv-alent to a late O-type star,with typical uncertainty of ±0.05–0.1mag.In 15cases,the continuum S/N was in-sufficient for this comparison and an average reddening of E(B–V)=0.5±0.3was adopted.Correction for redden-ing adopt a standard Seaton (1979)extinction law with R=3.1=A V /E(B-V).3.2.Spectral classificationIn order to classify and quantify the WR population within each region,we have fit Gaussian line profiles to the blue and yellow WR features,revealing line fluxes,equivalent widths and FWHM.An example of the fits to the blue and yellow WR features is presented in Fig.3,where a source (#74)hosting a mixed WN and WC pop-ulation is presented.In general,it was straightforward to distinguish be-tween WN (strong He ii λ4686)and WC subtypes (strong C iii λ4650and C iii λ5696and/or C iv λ5801-12).The following classification scheme was applied for further sub-division.In a minority of cases it was not possible to sep-arate the λ4650–λ4686features into individual compo-nents,and as a result an overall blend was measured.Since WC subtypes were assigned on the basis of λ5696and λ5812features,this did not prevent accurate classifica-tion.Late and early WN subtypes were assigned if He ii λ4686emission was accompanied by N iii λ4634−41or N v λ4603−20emission,respectively.If nitrogen lines were undetected,we assigned a WNE subtype if FWHM (He ii λ4686)>20˚A ,and WNL otherwise.For WC stars,WC4–6was assigned if C iv λ5801−12was present along with either weak or absent C iii λ5696.For 0.25≤F λ(C iii λ5696/C iv λ5801-12)≤0.8sources were classified WC7,and WC8–9if C iii λ5696was present,with C iv λ5801−12weak or absent.To ensure consistency with previous studies (e.g.Schaerer et al.,1999a;Bresolin &Kennicutt,2002;Chandar et al.,2004)we have derived WR popula-Fig.4.De-reddened spectral comparison between WC members in M 83with Galactic WC stars scaled to the distance of M 83(Galactic distances from van der Hucht (2001)).To avoid confusion,WCE and WC7sources are offset by 2×10⁻¹⁷erg s −1cm −2˚A −1whereas WC8and WC9spectra are offset by 1×10⁻¹⁷erg s −1cm −2˚A −1.6L.J.Hadfield et al.:WR population of M83Fig.5.De-reddened spectral comparison between WN complexes in M83with individual Milky Way WN stars scaled to the distance of M83(Galactic dis-tances from van der Hucht(2001)).To avoid confusion, individual sources are successively offset by1×10−17 erg s−1cm−2˚A−1.tions based on individual linefluxes adapted from Schaerer&Vacca(1998).As discussed in Paper I,we adopt He iiλ4686linesfluxes of5.2×1035erg s−1and 1.6×1036erg s−1for WN2-5and WN6-10stars,respec-tively.For WC stars,we adopt C ivλ5801linefluxes of 1.6×1036erg s−1and 1.4×1036erg s−1for WC4–6 and WC7stars,respectively,and a C iiiλ5696lineflux of7.1×1035erg s−1for WC8–9stars.WR contents of individual sources then follow,with populations rounded to the nearest integer(≥1).In one source(#117),we were unable to reliably extract the spectrum since it was located at the very edge of the slit,and so a measure of the reddening/lineflux was not possible.Nevertheless, broad He iiλ4686is clearly present,with no WC signa-ture,such that we indicate a population of≥1early-type WN star.In Fig.4we compare sources containing representa-tive late,mid and early WC stars from M83with ex-tinction corrected Milky Way counterparts,scaled to the distance of rge line widths amongst M83mem-bers hosting late WC stars are apparent,particularly for #32versus HD192103(WC8)and#81versus HD164270 (WC9).In contrast,sources containing WC4–7stars in-dicate similar line widths to individual Galactic parisons between sources containing WNL and WNE stars in M83and two Galactic counterparts are shown in Fig.5,revealing similar spectral morphologies. Other examples of sources hosting WN and WC popula-tions are presented in Fig.1of Paper I.3.3.The M83WR population–individual stars,binaries,complexes or clusters?What is the nature of the132sources in M83that are known to host WR stars?In Fig.6(a)we compare the spectroscopic continuum magnitude to the spectroscopic excess,∆m spec=mλ4684–mλ4781,for all sources.This is more complete than Fig.2,since it was generally possible to estimate the spectral mλ4781magnitude for the fainter sources,where PSF-photometry was not available.The brightest confirmed WR sources in our sample (mλ4781∼20mag)exhibit–0.3≤∆m spec≤0.0mag.Such values are consistent with luminous complexes,greatly di-luting the WR emission signature.In contrast,the faintest confirmed sources(mλ4781∼25mag)possess large spec-troscopic excesses of–2≤∆m spec≤–0.5mag,consistent with isolated,single or binary WR systems.Intermediate brightness sources span the full range in excess,corre-sponding to less luminous regions hosting a few WR stars to those containing large WR populations.Fig.6(b)compares the spectroscopicλ4686excess to the C iiiλ4650/He iiλ4686equivalent width,confirming the expected tight correlation between line strength and ∆m spec,where the scatter indicates the observational ac-curacy.Typical excesses of–0.2mag equate to small line equivalent widths of∼10˚A,whilst an excess of–1.0mag corresponds to∼100˚A,and the largest excesses equate to ∼500˚A.For comparison,single Galactic and LMC WR stars possess C iiiλ4650/He iiλ4686equivalent widths of 10–500˚A(WN subtypes)or150–2000˚A(WC subtypes).3.4.The global disk WR population of M83We identify1035±300WR stars,comprising564±170WC and471±130WN stars,within our132spectroscopically observed regions,where errors quoted here were obtained from simply adding individual uncertainties for all regions.The most important discovery of our spectroscopic sur-vey is the dominant late-type WC population of M83. Over half of the spectroscopically identified WR stars in M83fall into the WC8–9subtype,with few WC4–7 stars identified.For comparison,no WC8–9stars are ob-served in the SMC,LMC or M33and the total number of such stars in the Milky Way and M31is less than50 (van der Hucht,2001;Moffat&Shara,1987).The distri-bution among late-and early-type WN stars is more even, with WNL/WNE∼1.This value is much greater than that observed in the SMC(∼0)and LMC(∼0.25),but comparable to that of∼1.3determined for the Milky Way(van der Hucht,2001).How robust is this derived WR population for M83? For each source,we have propagated uncertainties in theL.J.Hadfield et al.:WR population of M837 parison between(a)the spectroscopic mλ4781magnitude and(b)line equivalent width of the C iiiλ4650/He iiλ4686WR features to the spectroscopic mλ4684excess.Two WC objects,#96and124,are not marked,since their spectra start longward of He ii.The left panel confirms that regions without WR signatures are clustered around∆m spec∼0±0.2mag,whilst regions with confirmed WR signatures span a wide range,up to ∆m spec∼−2.0mag.distance,reddening,photometry and lineflux measure-ments.Together,these translate to a typical uncertaintyof∼20−30%,or somewhat higher for regions in which aninterstellar reddening or a slit loss correction factor havebeen adopted.One of the main limitations in estimating the con-tent of an unresolved WR population is the conversionfrom WR lineflux to WR content.Given the large lateWC population identified in M83,we have reconsideredthe lineflux of individual WC8–9stars determined bySchaerer&Vacca(1998).From unpublished data for5Galactic,and2M31WC8–9stars,each with well deriveddistances,wefind a meanλ5696flux of5.1×1035ergs−1and4.7×1035ergs−1respectively.This is∼30%lower thanSchaerer&Vacca,and suggests that,if anything,we maybe underestimating the true WC population of M83.We have also estimated the WC population using thealternative C iiiλ4650line.Based on individual WRλ4650linefluxes of3.4×1036,4.5×1036and1.0×1035ergs−1for individual WC4–6,WC7and WC8–9subtypes,respec-tively(Schaerer&Vacca,1998),populations of individualsources were found to agree to within a factor of2,rela-tive to the yellow features.The total WC population wascalculated to be594using C iiiλ4650,in excellent agree-ment with that of564obtained from C iiiλ5696and C ivλ5808.Turning to the candidates for which spectroscopy wasnot obtained,all regions in Fig.2with∆m≤–0.3magcorrespond to spectroscopically confirmed WR complexes.Therefore,we would expect that at least25out of the49candidates,for whichλ4684andλ4781photometryis available,also possess WR stars.Adopting the samefraction for regions where PSF photometry is not avail-able,we expect≥50of the remaining89candidate regionsto contain WR stars.Indeed,#159has already been ob-served by Bresolin&Kennicutt(2002).Designated M83-5in their study,WR emission is spectroscopically confirmedand a population of2WCL and6WNL stars(scaled toa distance of4.5Mpc)is inferred from its line luminos-ity.On average,our confirmed sources host∼5WR stars,such that we expect∼250WR stars await identificationin M83,bringing the total disk population to∼1300.The inferred WR population of M83is greaterthan that known in the entire Local Group,to date(Massey&Johnson,1998).As anticipated from Figs.2and6,some sources host a single WR star,whilst oth-ers contain larger WR populations(∼10).Regions whichcontain an exceptionally large WR population will be dis-cussed in more detail in the next section.plexes hosting large WR populationsIn the Milky Way,the most massive open clusters(e.g.Arches,Westerlund1)host at most10–20WR stars(Blum et al.,2001;Negueruela&Clark,2005).Similarnumbers are observed in the largest H ii regions of M33,and30Doradus in the LMC.We identify10regions inM83with large(≥20),or mixed,WR populations.MixedWN and WC populations are observed in a total of5com-plexes,#66(8±2WNL,4±1WC7),#38(7±2WNL,21±6WCL),#41(14±4WNL,13±6WC7),#86(9±4WNL,24±10WCL)and#74which will be discussed sep-arately.Are the sources that host WR stars in M83com-pact clusters(e.g.Arches)or extended,giant H ii re-gions(30Doradus)?Massive compact clusters are gener-ally rare in normal disk galaxies,although M83is knownto host many examples,from HST imaging(Larsen,2004).Of the60bright H ii regions in M83identifiedby de Vaucouleurs et al.,between28–38host WR pop-ulations.Indeed,the3complexes hosting the largest WRpopulations are all associated with H ii regions identifiedby de Vaucouleurs et al..Optical spectroscopy of these8L.J.Hadfield et al.:WR population of M83were presented in Paper I,together with an estimate of their O starpopulation.Fig.7.5′′×5′′images of the WR cluster M83#74from VLT/FORS2and HST/ACS.Top Panel:λ4684filter,mid-dle panel:continuum subtracted Hαfilter,lower panel: F475Wfilter(WFC).North is up and east is to the left. It is apparent that the brightest Hαsource lies∼2′′to the S-W from the continuum(and WR)source.3.5.1.Source#74From our sample#74is exceptional,with230±50late-type WN and WC stars inferred from the de-reddened line fluxes(recall Fig.3).This source has the highest interstel-lar reddening of our entire sample with E(B-V)=1.0±0.03, although it is closest to the nucleus.However,the Hα/Hβnebular value is supported fromfitting its stellar contin-uum to a young(∼4Myr)instantaneous burst model at Z=0.04from Starburst99(Leitherer et al.,1999).In Paper I,we estimated a Lyman continuumflux of8×1051 s−1from the de-reddened Hαflux,such that#74has an ionizingflux equivalent to the giant H ii region30 Doradus.However,it possesses a WR content which is a factor of ten times larger,i.e.N(WR)/N(O)∼0.25versus 0.02in30Doradus.We have inspected archival HST/Advanced Camera for Surveys(ACS)Wide Field Camera(WFC)F475W datasets of M83(Proposal9299,P.I.H.Ford).This re-vealed that#74is very compact,with a FWHM of∼0.2 arcsec or∼4.5pc(for a distance of4.5Mpc).For H ii re-gions with solar or super-solar metallicities,WR signa-tures are expected to be present in bursts of age3–6Myr. We have compared the absolute F475W magnitude of#74 with evolutionary synthesis models for an instantaneous burst of age3–5Myr(Leitherer et al.,1999),from which we estimate a mass of1.4–2×10⁵M⊙.Therefore,its mass and size indicate that it is a young massive compact clus-ter,or Super Star Cluster(Whitmore,2003).In Fig.7we present5×5arcsec(∼110×110pc) images of#74obtained with FORS2and ACS.It is ap-parent that the peak Hαsource,i.e.H ii region#35from de Vaucouleurs et al.(1983),lies∼2arcsec to the S-W of the brightest continuum source(the WR cluster).The spectrum presented in Fig.2of Paper I is that of the WR cluster,whilst the Hαflux,and corresponding O7V star content of∼810represents the integrated total from both regions.The WR cluster provides approximately1/3of the total H ii luminosity,such that the WR/O ratio of this region approaches unity,comparable to the WR clus-ter NGC3125-1(Chandar et al.,2004).3.5.2.Other Clusters in M83Larsen(2004)has identified∼80young massive clusters in M83based on HST/WFPC2images.Three such regions are in common with our catalogue of sources containing WR stars,namely n5236-607(#61),-617(#73)and-277 (#79),although none host more than a few WR stars. Larsen(m.)has compared the UBVI colours of these clusters with Solar metallicity Bruzual&Charlot (1993)models,suggesting age estimates of log(τ)= 6.20±0.51,6.90±0.54and9.89±1.87,respectively.The first two are fully consistent with a young cluster which contains WR stars,while the third suggests a dominant old population.Five additional clusters from Larsen(2004)are also in common with our remaining candidates,namely n5236-L.J.Hadfield et al.:WR population of M 839169(#193),-805(#179),-818(#163),-1011(#157)and -1027(#173).Of course,such candidates have the poten-tial to also host a large WR population -indeed three of these clusters appear young (∼1.5–6Myr)from UBVI pho-tometry (Larsen,m.),i.e.#193,#179and #157.Note that #179is one of two clustersfor which dynam-ical mass estimates has been made by Larsen &Richtler (2004).Follow-up spectroscopic observations would be re-quired for the identification of additional WR rich clusters.parisons with previous studiesTo date,there have only been two previous studies re-lating to WR stars within M 83.Rosa &Richter (1988)and Bresolin &Kennicutt (2002)have both studied stel-lar populations within M 83and identify six H ii re-gions which exhibit WR characteristics.Four of these have been re-examined in this study.Rosa &Richter ob-tain optical spectra with very poor signal-to-noise pre-venting a quantitative discussion,consequently we shall restrict any comparisons solely to results obtained by Bresolin &Kennicutt (2002).Both studies followed a similar methodology in estimating the WR population,except that Bresolin &Kennicutt adopted a distance of 3.2Mpc to M 83(versus 4.5Mpc adopted here).This introduces a factor of 2between intrinsic line luminosities observed in this study and that by Bresolin &Kennicutt.–#40(M83-2)–The derived WR population for this region is estimated to be 6±2WC8–9,contrasting that of 1–2WNL obtained by Bresolin &Kennicutt.We achieve a 3σdetection for the λ5696and λ5812car-bon features,suggesting that poor signal-to-noise in the original investigation prevented positive WC iden-tification.–#41(M83-3)–We confirm the detection of 14±4WNL stars identified in region M83-3.In addi-tion we estimate the presence of 13±6WC7stars.Bresolin &Kennicutt state that C iii may be present,but not at a significant level (versus 5σhere).–#74(M83-8)–Bresolin &Kennicutt failed to detect any WR emission in this H ii region.However,we find the largest individual WR population of any source,namely 230stars.As stated in Sect.3.5the WR emis-sion is offset by several arc-secs to the N-E of the peak H αemission.Since the Bresolin &Kennicutt concen-trated on bright H ii regions,their slit was probably centred on the peak H αemission,such that the WR signature was missed.–#103(M83-9)–Both investigations infer a late WN population.The present study obtains a population of 29±9WNL stars,in agreement with that estimated by Bresolin &Kennicutt after allowing for differences in the assumed distance.Fig.8.Distribution among WCL subtypes as determined using W λ(C iv 5808)/W λ(C iii 5696)versus FWHM (C iii λ5696)in ˚A .For comparison,Galactic (unpub-lished WHT,AAT and 2.3m ANU data),M31(unpub-lished WHT /ISIS data),M33(Abbott et al.,2004)and IC10(Crowther et al.,2003)WCL stars have been in-cluded.The subtype divisions marked are those derived by Crowther et al.(1998).Fig.9.Equivalent width (W λin ˚A )vs.FWHM (˚A )of the C iii λ5696for WCL stars in M 83and Local Group galaxies (identical dataset as presented in Fig.8).4.DiscussionWe have identified up to ∼200regions in the disk of M 83that host WR stars.We now compare the properties of WR stars at the high metallicity of M 83with those of Local Group galaxies,attempt to explain the dominant late subtypes amongst WC stars,and make comparisons with current evolutionary models.4.1.Properties of WR stars at high metallicityHow do the line strengths and widths of sources con-taining WR stars in M 83compare with those of other galaxies?In Fig.8,we show the classification ratio W λ(C iv 5808)/W λ(C iii 5696)versus FWHM (C iii 5696).Data for WC7–9stars in four Local Group galaxies are included,along with subtype boundaries as derived by。
中国蛤蜊的研究进展____
中国蛤蜊[1],俗名“黄蛤”、“飞蛤”,学名Mactra chinensis,隶属于软体动物门、瓣鳃纲、异柱目、蛤蜊科、蛤蜊属,主要分布在我国辽宁、山东的黄、渤海沿岸,朝鲜半岛和日本也有分布。
人工养殖时常年均可采捕,尤以深秋和春季采捕效果为佳。
中国蛤蜊适于生活在潮间带的细砂滩至水深60m的浅海区,是一种营养丰富、肉质鲜美的实用经济滩涂贝类[2]。
但在其养殖过程中,种苗紧缺一直是制约中国蛤蜊养殖生产可持续发展的关键因素[3]。
为此,加强亲贝的培育质量、提高海区的采苗效率、优化蛤蜊的孵化条件以及进行必要的研究以便中国蛤蜊规模化养殖和苗种资源的保护具有重大意义[4,5]。
目前国内外学者关于中国蛤蜊的相关研究成果综述如下:1中国蛤蜊的繁殖生物学特性的研究我国早在20世纪90年代时就已经开展了蛤蜊养殖,因此其繁殖生物学特性的研究也取得了很大进展。
孙振兴等[6]研究了包括中国蛤蜊在内三种帘蛤目贝类的核型。
刘相全等[7]发展土池育苗技术,对中国山东海阳市中国蛤蜊的繁殖生物学特性和胚胎发育过程进行了较为系统的研究。
其研究结果中国蛤蜊的研究进展陈添悦1,王潇潇2(1.中国农业大学动物医学院北京100193;2.中国农业大学动物科技学院北京100193)doi:10.3969/j.issn.1008-4754.2013.07.013摘要:本文主要从五个方面综述了中国蛤蜊近几年的一些研究,即中国蛤蜊的繁殖生物学特性、消化系统与代谢、中枢神经系统,以及重金属离子对中国蛤蜊的影响,中国蛤蜊早期生长发育与人工育苗等。
阐述了以上各个方面所取得的成就和拥有的前景,指出并总结了目前研究阶段中尚未解决的各项问题,以期为以后的中国蛤蜊养殖提供科学依据。
关键词:中国蛤蜊;研究进展Research Development of Mactra chinensisChen Tianyue1,Wang Xiaoxiao2(1.College of Veterinary Medicine,China Agricultural University,Beijing100193;2.College of Animal Science and Technology,China Agriculture University,Beijing100193) Abstract:This paper summarizes the five aspects of Mactra chinensis in recent years,including Mactra chinensis' reproductive biology,digestive system and metabolism,central nervous system,as well as heavy metal ions on the impact of Mactra chinensis,Mactra chinensis'early growth,artificial breeding and so on.In order to provide a sci-entific basis for the future of Mactra chinensis'farming,the author describes various aspects of the above achieve-ments and prospects has been pointed out and summarized the current research phase of the issues yet to be re-solved.Key words:Mactra chinensis;research development表明山东地区中国蛤蜊是雌雄异体的,但也存在少量雌雄同体的现象。
血酒分析自动头空气色谱技术手册说明书

Increasing Accuracy ofBlood-Alcohol Analysis Using Automated Headspace-Gas Chromatography AbstractAccuracy and precision are critical in blood-alcohol analysis because the toxicologist not only has to be confident in his or her results, but also must be prepared to withstand tough cross examination by defense attorneys. Inaddition, crime laboratories must comply with state regulations regarding blood-alcohol testing, including proficiencies which require the result to be within ±10%. The Phoenix Crime Laboratory uses the pressurebalanced approach to headspacegas chromatography (HS-GC) that introduces the sample into the column in the form of a slug rather than a continuous flow. By removing much of the variability of conventional HS-GC methods, this approach achieved an RSD of 1.2% over an 18-month study.Headspace time plus run time is typically in the area of 6 minutes. Headspace time plus run time was reduced to 2.5 minutes by increasing the column head pressure from 20 psi to 30 psi.The purpose of this paper is to demonstrate the improved precision possible using pressure-balanced headspace-GC technology. The laboratory’s time savings will also be considered.Contributors:John MusselmanAnil SolankyWilliam Arnold Phoenix Police Department Crime Laboratory Phoenix, Arizona U.S.A.Gas Chromatography2INTRODUCTIONBlood-alcohol analysis is typically performed in driving under the influence (DUI) and driving while intoxicated (DWI) investigations and in traffic accidents where people have been critically injured or killed. Most states have “Per Se” laws where it is illegal to drive while having a concentration of 0.08% or above. Secondary Per Se levels are not uncommon, i.e., extreme DUI above 0.15%. With these defined blood-alcohol concentrations, the accuracy of a system must be assessed. Alcohol analysis is used primarily to determine the concentration of ethanol and, to a lesser extent, determine if methanol, acetone, 2-propanol or toluene is present in blood or urine of “huffers”. HS-GC has become the nearly universal method of choice for measuring blood alcohol in foren-sic laboratories because it allows a relatively large number of samples to be analyzed quickly and with a minimal amount of manual handling.Conventional HS-GC systems use a combination of pressure, temperature and agitation at up to 40 psi to drive solution components into the headspace. Then, pressure is used to stream headspace gas continuously into the column, which tends to reduce the sharpness of the ana-lytical results. Large numbers of crime laboratories that utilize this method have typically seen RSD levels upwards of 4%.According to Henry’s law, at equilibrium, in a sealed vessel,volatile compounds in the liquid state will be present in the vapor state at a concentration proportional to the concentration in liquid. By sampling this vapor (the headspace) and delivering it toa gas chromatograph, the volatile compounds may be qualitativelyFigure 1. Headspace operation.identified and quantitatively measured. A single headspaceinjection is normally split into two capillary columns, each exiting to a flame ionization detector (FID). The columns have different polarity for unique sepa-rations of the volatiles of interest.Several years ago, the Phoenix Crime Laboratory implemented a pressure-balanced, time-based HS-GC method thatpressurizes the headspace and then releases the headspace gas instantaneously as a single slug into the column.This approach is explained in Figure 1. With the injection system on standby, the carrier gas enters the vial through Valve 1 (V1) and is directed partly through the heated transfer line to the GC and partly to the heated needle, which is con-stantly flushed to avoid cross con-tamination. The needle flush gas exits through the needle vent valve.Prior to injection, each vial is pressurized to a preset pressure with carrier gas to ensure that all injections are performed under the exact same conditions, regardless of different equilibrium pressures in different samples. During injection, the carrier gas supply and the needle purge are switched off. Sample flows to the gas chromatography system from the pressurized headspace vial. The injected volume is pro-portional to the injection time. At the end of the injection, the carrier gas and needle purge are once more switched on and the injected sample volume is driven through the gas chromatograph. The needle is retracted and the system goes into standby mode.EXPERIMENTAL EquipmentA PerkinElmer AutoSystem™ XL GC equipped with a TurboMatrix™ HS 110 headspace sampler, dual FIDs and TotalChrom® software was used (PerkinElmer part no.N5150511). The GC was equipped with dual capillary columns from Restek Corp. The BAC 1-WCOT is a 30 m long fused-silica column with a 0.32 mm i.d. stationary phase and 1.8 µm film thickness and the BAC 2-WCOTis a 30 m long fused-silica column with a 0.32 mm i.d. stationary phase and 1.2 µm film thickness.MaterialsInternal standard solutions were prepared including:1. A concentration of 0.015% v/v n-propanol and 0.5 Mammonium sulfate in deionized water.2. A qualitative mixed-volatiles standard was prepared byadding 20 µL acetaldehyde, 80 µL methanol, 20 µLacetone, 80 µL ethanol and 50 µL isopropyl alcoholto 100 mL deionized water.Ethanol calibration solutions with concentrations of 0.025%, 0.050%, 0.100%, 0.200% and 0.400% were procured from an outside vendor. Positive ethanol controls from a separate vendor at 0.100% aqueous and 0.190% whole bloodwere also procured. A negative control was prepared using deionized water and the internal standard.MethodsAll calibration solutions, controls and samples were allowed to come to room temperature before starting. Whole blood samples were mixed thoroughly before pipetting. Serum samples required no preparation. Clotted samples were thoroughly homogenized before pipetting.A Hamilton Microlab® 500A Series dispenser diluter was primed with an internal standard solution for at least three cycles. The left syringe was set to a speed of 4 and used to deliver 1000 µL of internal standard. The right syringe was set to a speed of 2 and used to deliver 100 µL of sample. The dispenser diluter was then used to prepare each sample, control and calibration solution in duplicate.Each vial was then sealed and loaded onto the headspace sampler in the designated sequence. Diluter preci-sion was determined to be 0.6%.Samples and calibrators were equilibrated for 13 minutes at 60 ˚C and pressurized with helium at 36.5 psig. The sample was injected into the column in a 0.02-minute period through a 1.3 m x 0.32 mm fused-silica transfer line at 100 ˚C. The cycle time was 3.2 minutes. The needle temperature was maintained at 70 ˚C and the withdrawal time was 0.2 minutes.The GC run time was 2.5 minutes and the sampling rate was set at 12.5 points per second. Oven temperature was isothermal 45 ˚C and pressure was isobaric 30 psi. Helium was used as the carrier gas. FIDs were used on each column with a temperature of 220 ˚C. Gas flows through each detector were 450 mL/min of air and 45.0 mL/minof hydrogen.Elutions on the Restek Rtx® BAC I are as follows:• Methanol eluted as a single-peak component at 0.716 min • Acetaldehyde eluted as a single-peak component at 0.790 min • Ethanol eluted as a single-peak component at 0.877 min• Isopropanol eluted as a single-peak component at 1.050 min • Acetone eluted as a single-peak component at 1.269 min• N-propanol eluted as a single-peak component at 1.374 min • Toluene eluted as a single-peak component at 5.32 minWith the exception of toluene, all analytes elute prior to 2.5 minutes on both columns.Table 1. Precision and Accuracy at Different Concentrations. Concentration (%) 0.005 0.010 0.100 0.188 0.400 Accuracy +13.0% +8.5% -1.8% +0.6% -1.6% Precision 1.8% 0.4% 0.2% 0.5% 0.2% Within-run precision dataRESULTSIn order to evaluate the linear range of ethanol quantitation using this method, a set of 0.025, 0.050, 0.100, 0.200 and 0.400% ethanol calibration solutions were prepared and run accordingto protocol. Spiked samples below and above the cali-bration solutions were run at the following concentrations: 0.005, 0.010, 0.015, 0.020, 0.600, 0.700, 0.800, 0.900 and 1.000. The sample was determined to be in the linear range, if the quantitation fell within +10%. The method was linear from 0.010-1.0%.The precision, accuracy, limits of detection (LODs) and limits of quantitation (LOQs) were determined by the following method: ten replicates of ethanol at concentrations of 0.005, 0.01, 0.100, 0.188 (whole blood control) and 0.400% were run accordingto the method described above; accuracy was defined as the deviations from the actual concentration; precision was definedas the coefficient of variation (CV) for each of the replicate concentrations. Precision and accuracy at different concentration levels are shown in Table 1. The LOD was determined to be0.005% and the LOQ was 0.010%.3For a complete listing of our global offices, visit /ContactUsCopyright ©2013, PerkinElmer, Inc. All rights reserved. PerkinElmer ® is a registered trademark of PerkinElmer, Inc. All other trademarks are the property of their respective owners.007606A_01PerkinElmer, Inc. 940 Winter StreetWaltham, MA 02451 USA P: (800) 762-4000 or (+1) 203-925-4602The Phoenix Crime Laboratory analyzes approximately 1000 blood samples per year for alcohol con-centration. Figure 2 shows the run-run precision utilizing this method over a period of 18 months. For the target value of 0.1900% ethanol, the average result was 0.18911 (n=537) with a standard deviation of 0.0023. This yields an RSD of 1.23%, an upper control limit at three stan-dard deviations of 0.19697 and a lower control limit at three standard deviations of 0.18303.A study was run to evaluate the interferences of other volatile substances, which may be found in biological fluids either in the presence or absence of ethanol. Positive interferences were provided by the mixed-volatiles standard described above. The peaks were resolved with a resolution better than 1 and a peak-to-valley ratio better than 90%. This study showed that acetaldehyde, methanol, acetone, isopropanol, toluene and methyl ethyl ketone do not interfere with the identification or quantification of ethanol by HS-GC.CONCLUSIONSAn analytical method was developed to quantify ethanol in blood alcohol using HS-GC. The method appears to be extremely robust and reliable and achieved an RSD value of 1.23%, which is well below those achieved by other methods. RSD values of this level make it possible for toxicologists to testify with con-fidence that their results are accurate within ±5%. The result is that DUI and DWI defendants in the Phoenix area normally plead guilty to driving under the influence or driving while impaired, saving the toxicologists the time they would otherwise have to spend testifying and saving the local government the cost of a trial.REFERENCES1. Rasanen, Ilpo; Ojanpera, Ilkka; Kurkinen, Kaisa; Vartiovaara, Juhani; Vuori, Erkki. Presentation at 2004 SOFT/TIAFT, “Alcohol Determination by Head Space Dual Column Capillary Chromatography.”2. Christmore, David S.; Kelly, Raymond C.; Doshier, Lonnie A. Journal of Forensic Toxicology. Volume 29, No. 4, 1984. “Improved Recovery and Stability of Ethanol in Automated Forensic Analysis.”3. Jones, A. W.; Fransson M. Medicine, Science and the Law. July 2003, Volume 43, No. 3. “Blood Analysis by Headspace Gas Chromatography: Does a Deficient Sample VolumeDistort Ethanol Concentration.”Figure 2. Run-to-run precision over 1.5 years.Figure 3. Quantitation column and confirmation column chromatographs.4. Andreasson, Rune; Jones, A. Wayne. American Journal of Forensic Medicine & Pathology. Volume 17, No. 3. “The Life and Work of Erik M. P. Widmark.”5. Kancler, Julie. 2003 SOFT Poster 5, “Static Headspace Analysis of Alcohol and Common Abused Inhalants in Blood Using Dual-Column Chromatography.”6. Yazzie, Janice; Luthi, Ruth; Kerrigan, Sarah. 2004 Joint SOFT Abstract 27, “Effect of Sodium Chloride on Headspace Blood Alcohol Analysis by GC-FID.”7. Kristiansen, Jesper; Petersen, Henning Willads. 2003 SOFT Meeting, Poster 43, “An Uncer-tainty Budget for the Measurement of Ethanol in Blood by Head-Space Gas Chromatography.”。
Berry Good News
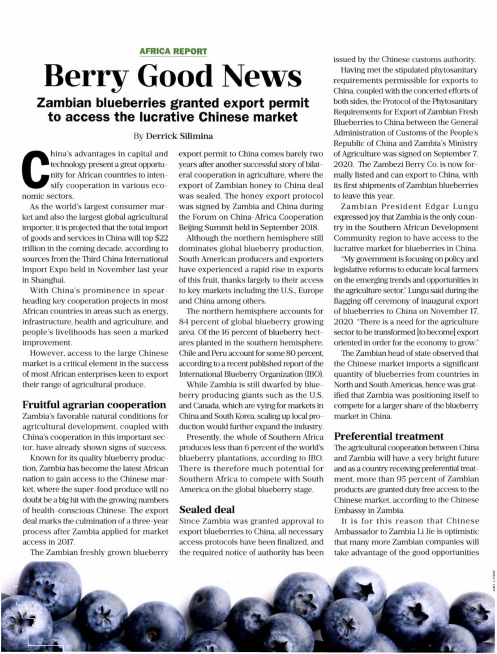
Berry Good News Zambian blueberries granted export permit to access the lucrative Chinese marketBy Derrick SiliminaAFRICA REPORTC hina s advantages in capital andtechnology present a great opportunity for African countries to intensify cooperation in various economic sectors.As the world s largest consum er m arket and also the largest global agricultural importer, it is projected that the total import of goods and services in China wiU top $22 trillion in the coming decade, according to sources from the Third China International Import Expo held in November last year in Shanghai.W ith C h in a^ p ro m in en ce in s p e a rheading key cooperation projects in most African countries in areas such as energy, infrastructure, health and agriculture, and people’s livelihoods has seen a m arked improvement.However, access to the large Chinese market is a critical element in the success of most African enterprises keen to export their range of agricultural produce. Fruitful agrarian cooperation Zambia’s favorable natural conditions for agricultural developm ent, coupled with China s cooperation in this important sector, have already shown signs of success. Known for its quality blueberry production, Zambia has become the latest African nation to gain access to the Chinese m arket, w here the super-food produce will no doubt be a big hit with the growing numbers of health-conscious Chinese. The export deal m arks the culmination of a three-year process after Zambia applied for market access in 2017.The Zambian freshly grown blueberry export permit to China comes barely twoyears after another successful story of bilateral cooperation in agriculture, where theexport of Zam bian honey to China dealw as sealed. The honey export protocolw as signed by Zambia and China duringthe Forum on China-Africa CooperationBeijing Summit held in September 2018.Although the northern hemisphere stilldom inates global blueberry production,South American producers and exportershave experienced a rapid rise in exportsof this fruit, thanks largely to their accessto key markets including the U.S., Europeand China among others.The northern hemisphere accounts for84 percent of global blueberry growingarea. Of the 16 percent of blueberry hectares planted in the southern hemisphere,Chile and Peru account for some 80 percent,according to a recent published report of theInternational Blueberry Organization (IBO).While Zambia is still dwarfed by blueberry producing giants such as the U.S.and Canada, which are vying for markets inChina and South Korea scaling up local production would further expand the industry.Presently, the whole of Southern Africaproduces less than 6 percent of the worldsblueberry plantations, according to IBO.T here is th erefo re m uch potential forSouthern Africa to com pete w ith SouthAmerica on the global blueberry stage.Sealed dealSince Zambia w as granted approval toexport blueberries to China, all necessaryaccess protocols have been finalized, andthe required notice of authority has beenissued by the Chinese customs authority.Having met the stipulated phytosanitaryrequirem ents perm issible for exports toChina coupled with the concerted efforts ofboth sides, the Protocol of the PhytosanitaryRequirements for Export of Zambian FreshBlueberries to China between the GeneralAdministration of Customs of the People’sRepublic of China and Zambia's Ministryof Agriculture was signed on September 7,2020. The Zambezi Berry Co. is now formally listed and can export to China, withits first shipments of Zambian blueberriesto leave this year.Z a m b ia n P re s id e n t E d g ar L unguexpressed joy that Zambia is the only country in the Southern African DevelopmentCommunity region to have access to thelucrative market for blueberries in China.M My government is focusing on policy andlegislative reforms to educate local farmerson the emerging trends and opportunities inthe agriculture sector,” Lungu said during theflagging off ceremony of inaugural exportof blueberries to China on November 17,2020. "There is a need for the agriculturesector to be transformed [to become] exportoriented in order for the economy to grow."The Zambian head of state observed thatthe Chinese market imports a significantquantity of blueberries from countries inNorth and South Americas, hence was gratified that Zambia w as positioning itself tocompete for a larger share of the blueberrymarket in China.Preferential treatmentThe agricultural cooperation between Chinaand Zambia will have a very bright futureand as a country receiving preferential treatment, m ore than 95 percent of Zambianproducts are granted duty free access to theChinese market, according to the ChineseEmbassy in Zambia.It is fo r th is re a s o n th a t C h in e seAmbassador to Zambia Li Jie is optimisticthat many more Zambian companies willtake advantage of the good opportunitiesZambian farm workers pick blueberriesand export more high-quality agricultural products to China.Li said that exporting the Zambian fresh blueberries to China is a milestone for agri cultural cooperation betw een China and Zambia. It will contribute greatly to the promotion of the bilateral economic and trade cooperation and the development of friendly relations betw een the two countries, said L i.*1 wish therefore to take this opportunity to extend to the Zambezi Berry Co. my best wishes for bright prospects. It is my firm belief that the company will provide quality products to Chinese customers and create more jobs for Zambians,” he said during the inspection of the blueberry fields and processing plant located in Chisamba, 20 km north of Lusaka, Zambia's capital.Zambezi Berry Co. is a joint venturebetween Zambezi Ranching & Cropping,agribusinesses in Zambia, and the UnitedExports Group, an innovative market leaderoperating throughout the agricultural supplychain, from breeding to distribution, focusingprimarily on its OZblu blueberries globally.Zambezi Berry Co., with an investmentof $4.5 million, plans to expand up to 500hectares and becom e the single-largeststandalone blueberry orchards in SouthernAfrica."We are extremely excited about this newopportunity to access one of the largest markets in the world. We are confident that, bymaintaining our world-class quality withthese world-leading OZblu varieties whilesignificantly increasing quantity, w e cansuccessfully com pete w ith som e of thebiggest global producers," said ZambeziBerry Co. Managing Director Graham Rae.The beginning of2020 saw the end of someof the lowest prices of blueberries in years,but recently global prices have indicated astrong recovery with the average price ofconventional berries fetching around $8.31per kg, which is 94 percent higher than in2019, according to .' Zambia is extremely well placed to supply forexport into the northern hemisphere duringthe August-November window and this is amarvelous achievement for Zambia and isexpected to be the first of many celebrations,as Africa gains ground in the internationalblueberry markets emphasized Rae. CA* Reporting from Zambia* Comments**************************。
Analyzing the Mechanism of Photocatalysis
Analyzing the Mechanism ofPhotocatalysisPhotocatalysis is a process in which a catalyst is used to initiate a chemical reaction by absorbing energy from light. This process has gained popularity in recent years due to its potential role in solving environmental problems, including water and air purification, and energy conversion. Understanding the mechanism of photocatalysis is essential for designing efficient photocatalysts and optimizing the reaction conditions. In this article, we will analyze the mechanism of photocatalysis and its applications in various fields.The mechanism of photocatalysis involves several steps. First, the photon energy is absorbed by the photocatalyst, which promotes the electrons to a higher energy level, generating electron-hole pairs. The electrons and holes can migrate to the surface of the photocatalyst, where they can participate in the subsequent reactions. Second, the redox process takes place on the surface of the photocatalyst. The holes can react with water or hydroxide ions to form hydroxyl radicals, while the electrons can react with oxygen or other molecules to form superoxide, hydrogen peroxide, or other reactive species.The formed reactive species can then react with the organic or inorganic compounds adsorbed on the surface of the photocatalyst or in the solution, leading to their degradation or transformation. For example, in water purification, photocatalysis can degrade organic pollutants such as dyes and pharmaceuticals. In air purification, photocatalysis can convert harmful gases such as NOx and SOx into harmless products such as nitrogen and sulfur dioxide. In addition, photocatalysis can also be used in energy conversion, such as the reduction of CO2 to produce fuels and chemicals.The efficiency of photocatalysis depends on several factors, including the properties of the photocatalyst, light intensity, wavelength, and reaction conditions. The properties of the photocatalyst such as its bandgap, surface area, and morphology can affect the absorption and migration of electrons and holes, as well as the adsorption and reaction of pollutants. The light intensity and wavelength can affect the number of photon absorbedby the photocatalyst. The reaction conditions such as the pH, temperature, and concentration can also affect the redox process and the stability of the photocatalyst.Recently, various types of photocatalysts have been developed for different applications, such as TiO2, ZnO, CdS, and others. Among them, TiO2 is the most widely used photocatalyst due to its stable chemical and physical properties, low cost, and high photocatalytic activity. However, the mechanism of photocatalysis in TiO2 is still not fully understood, and many efforts have been made to improve its efficiency, such as doping with other elements, coupling with other materials, or modifying its surface.In addition, the application of photocatalysis still faces some challenges, including the selectivity, stability, and scalability. The selectivity of photocatalysis depends on the adsorption and reactivity of different pollutants, and controlling it can enhance the efficiency and avoid the formation of byproducts. The stability of photocatalysis depends on the degradation or deactivation of the photocatalyst during the reaction, and improving it can prolong the lifetime and reduce the cost. The scalability of photocatalysis depends on the production and application of photocatalysts, and developing it can promote the commercialization and implementation of photocatalysis in various fields.In conclusion, photocatalysis is a promising method for solving environmental problems and energy conversion. Analyzing the mechanism of photocatalysis can provide insights into the design and optimization of photocatalysts. However, the application of photocatalysis still faces some challenges, and further research and development are needed to overcome them and promote its practical use.。
国际会议级别

Asian Control Conference (ASCC)
European Association for Signal Processing 18.
(EURASIP)
European Signal Processing Conference (EUSIPCO)
19. European Graphics Society
The Optoelectronics and Communications Conference (OECC)光電與通訊工程國際研討會
International Symposlum on Growth of
19. Association for "Optoelectronics Frontier by Nitride Ⅲ-Nitrides(ISGN)三族氮基半導體生長國際研討
23. European Union Control Association (EUCA)
European Control Conference (ECC)
Innovative Computing, Information and Control 24.
(ICIC)
International Symposium on Intelligent Informatics (ISII)
6. Society (WSEAS)
八)
Administered by UCMSS Universal Conference The International Conference on e-Learning,
7. Management Systems & Support/The University of e-Business, Enterprise Information Systems, and
光子晶体导波基本原理说明书
More informationFundamentals of Photonic Crystal GuidingIf you’re looking to understand photonic crystals,this systematic,rigorous,and peda-gogical introduction is a must.Here you’llfind intuitive analytical and semi-analyticalmodels applied to complex and practically relevant photonic crystal structures.Y ou willalso be shown how to use various analytical methods borrowed from quantum mechanics,such as perturbation theory,asymptotic analysis,and group theory,to investigate manyof the limiting properties of photonic crystals,which are otherwise difficult to rationalizeusing only numerical simulations.An introductory review of nonlinear guiding in photonic lattices is also presented,as are the fabrication and application of photonic crystals.In addition,end-of-chapterexercise problems with detailed analytical and numerical solutions allow you to monitoryour understanding of the material presented.This accessible text is ideal for researchersand graduate students studying photonic crystals in departments of electrical engineering,physics,applied physics,and mathematics.Maksim Skorobogatiy is Professor and Canada Research Chair in Photonic Crystals atthe Department of Engineering Physics in´Ecole Polytechnique de Montr´e al,Canada.In2005he was awarded a fellowship from the Japanese Society for Promotion of Science,and he is a member of the Optical Society of America.Jianke Yang is Professor of Applied Mathematics at the University of Vermont,USA.Heis a member of the Optical Society of America and the Society of Industrial and AppliedMathematics.Fundamentals of Photonic Crystal GuidingMAKSIM SKOROBOGATIY 1JIANKE YANG 2´Ecole Polytechnique de Montr ´e al,Canada 1University of Vermont,USA2More informationMore informationcambridge university pressCambridge,New Y ork,Melbourne,Madrid,Cape Town,Singapore,S˜a o Paulo,DelhiCambridge University PressThe Edinburgh Building,Cambridge CB28RU,UKPublished in the United States of America by Cambridge University Press,New Y orkInformation on this title:/9780521513289C Cambridge University Press2009This publication is in copyright.Subject to statutory exceptionand to the provisions of relevant collective licensing agreements,no reproduction of any part may take place withoutthe written permission of Cambridge University Press.First published2009Printed in the United Kingdom at the University Press,CambridgeA catalog record for this publication is available from the British LibraryLibrary of Congress Cataloging in Publication dataSkorobogatiy,Maksim,1974–Fundamentals of photonic crystal guiding/by Maksim Skorobogatiy and Jianke Y ang.p.cm.Includes index.ISBN978-0-521-51328-91.Photonic crystals.I.Y ang,Jianke.II.Title.QD924.S562008621.36–dc222008033576ISBN978-0-521-51328-9hardbackCambridge University Press has no responsibility for the persistence oraccuracy of URLs for external or third-party internet websites referred toin this publication,and does not guarantee that any content on suchwebsites is,or will remain,accurate or appropriate.More informationM.Skorobogatiy dedicates this book to his family.He thanks his parentsAlexander and Tetyana for never-ceasing support,encouragement,andparticipation in all his endeavors.He also thanks his wife Olga,his children,Alexander junior and Anastasia,andhis parents for their unconditional love.J.Yang dedicates this book to his family.More informationContentsPreface page xiAcknowledgements xii1Introduction11.1Fabrication of photonic crystals21.2Application of photonic crystals41.2.1Photonic crystals as low-loss mirrors:photonicbandgap effects41.2.2Photonic crystals for out-of-bandgap operation10References112Hamiltonian formulation of Maxwell’s equations(frequency consideration)142.1Plane-wave solution for uniform dielectrics162.2Methods of quantum mechanics in electromagnetism182.2.1Orthogonality of eigenstates192.2.2Variational principle202.2.3Equivalence between the eigenstates of twocommuting Hamiltonians222.2.4Eigenstates of the operators of continuous anddiscrete translations and rotations232.3Properties of the harmonic modes of Maxwell’s equations302.3.1Orthogonality of electromagnetic modes322.3.2Eigenvalues and the variational principle322.3.3Absence of the fundamental length scale in Maxwell’sequations342.4Symmetries of electromagnetic eigenmodes352.4.1Time-reversal symmetry352.4.2Definition of the operators of translation and rotation352.4.3Continuous translational and rotational symmetries382.4.4Band diagrams432.4.5Discrete translational and rotational symmetries44More informationviii Contents2.4.6Discrete translational symmetry and discreterotational symmetry522.4.7Inversion symmetry,mirror symmetry,and other symmetries532.5Problems553One-dimensional photonic crystals–multilayer stacks593.1Transfer matrix technique593.1.1Multilayer stack,TE polarization593.1.2Multilayer stack,TM polarization613.1.3Boundary conditions623.2Reflection from afinite multilayer(dielectric mirror)633.3Reflection from a semi-infinite multilayer(dielectricphotonic crystal mirror)643.3.1Omnidirectional reflectors I683.4Guiding in afinite multilayer(planar dielectric waveguide)693.5Guiding in the interior of an infinitely periodic multilayer703.5.1Omnidirectional reflectors II803.6Defect states in a perturbed periodic multilayer:planarphotonic crystal waveguides823.7Problems864Bandgap guidance in planar photonic crystal waveguides934.1Design considerations of waveguides with infinitelyperiodic reflectors934.2Fundamental TE mode of a waveguide with infinitelyperiodic reflector964.3Infinitely periodic reflectors,field distribution in TM modes984.3.1Case of the core dielectric constantεc<εhεl/(εh+εl)984.3.2Case of the core dielectric constantεl≥εc>εhεl/(εh+εl)1014.4Perturbation theory for Maxwell’s equations,frequencyformulation1034.4.1Accounting for the absorption losses of the waveguidematerials:calculation of the modal lifetime and decay length1044.5Perturbative calculation of the modal radiation loss in aphotonic bandgap waveguide with afinite reflector1064.5.1Physical approach1064.5.2Mathematical approach1085Hamiltonian formulation of Maxwell’s equations for waveguides(propagation-constant consideration)1105.1Eigenstates of a waveguide in Hamiltonian formulation1105.1.1Orthogonality relation between the modes of a waveguide madeof lossless dielectrics111More informationContents ix5.1.2Expressions for the modal phase velocity1145.1.3Expressions for the modal group velocity1145.1.4Orthogonality relation between the modes of a waveguide madeof lossy dielectrics1155.2Perturbation theory for uniform variations in a waveguide dielectric profile1165.2.1Perturbation theory for the nondegenerate modes:example ofmaterial absorption1185.2.2Perturbation theory for the degenerate modes coupled byperturbation:example of polarization-mode dispersion1205.2.3Perturbations that change the positions of dielectric interfaces1235.3Problems126References127 6Two-dimensional photonic crystals1296.1T wo-dimensional photonic crystals with diminishingly smallindex contrast1296.2Plane-wave expansion method1326.2.1Calculation of the modal group velocity1346.2.2Plane-wave method in2D1346.2.3Calculation of the group velocity in the case of2Dphotonic crystals1356.2.4Perturbative formulation for the photonic crystallattices with small refractive index contrast1386.2.5Photonic crystal lattices with high-refractive-index contrast1426.3Comparison between various projected band diagrams1426.4Dispersion relation at a band edge,density of states andVan Hove singularities1446.5Refraction from photonic crystals1476.6Defects in a2D photonic crystal lattice1486.6.1Line defects1486.6.2Point defects1586.7Problems167References171 7Quasi-2D photonic crystals1727.1Photonic crystalfibers1727.1.1Plane-wave expansion method1727.1.2Band diagram of modes of a photonic crystalfiber1767.2Optically induced photonic lattices1777.2.1Light propagation in low-index-contrast periodicphotonic lattices1787.2.2Defect modes in2D photonic lattices with localized defects1817.2.3Bandgap structure and diffraction relation for the modes of auniform lattice182More informationx Contents7.2.4Bifurcations of the defect modes from Bloch band edges forlocalized weak defects1857.2.5Dependence of the defect modes on the strength oflocalized defects1887.2.6Defect modes in2D photonic lattices with nonlocalized defects1927.3Photonic-crystal slabs1957.3.1Geometry of a photonic-crystal slab1957.3.2Eigenmodes of a photonic-crystal slab1977.3.3Analogy between the modes of a photonic-crystal slab and themodes of a corresponding2D photonic crystal2007.3.4Modes of a photonic-crystal slab waveguide2047.4Problems207References208 8Nonlinear effects and gap–soliton formation in periodic media2108.1Solitons bifurcated from Bloch bands in1D periodic media2118.1.1Bloch bands and bandgaps2118.1.2Envelope equations of Bloch modes2128.1.3Locations of envelope solitons2158.1.4Soliton families bifurcated from band edges2168.2Solitons bifurcated from Bloch bands in2D periodic media2188.2.1T wo-dimensional Bloch bands and bandgaps of linearperiodic systems2198.2.2Envelope equations of2D Bloch modes2208.2.3Families of solitons bifurcated from2D band edges2238.3Soliton families not bifurcated from Bloch bands2268.4Problems227References228Problem solutions230Chapter2230Chapter3236Chapter5244Chapter6246Chapter7257Chapter8260 Index263More informationPrefaceThefield of photonic crystals(aka periodic photonic structures)is experiencing anunprecedented growth due to the dramatic ways in which such structures can control,modify,and harvest theflow of light.The idea of writing this book came to M.Skorobogatiy when he was developingan introductory course on photonic crystals at the Ecole Polytechnique de Montr´e al/University of Montr´e al.Thefield of photonic crystals,being heavily dependent onnumerical simulations,is somewhat challenging to introduce without sacrificing thequalitative understanding of the underlying physics.On the other hand,exactly solvablemodels,where the relation between physics and quantitative results is most transpar-ent,only exist for photonic crystals of trivial geometries.The challenge,therefore,wasto develop a presentational approach that would maximally use intuitive analytical andsemi-analytical models,while applying them to complex and practically relevant pho-tonic crystal structures.We would like to note that the main purpose of this book is not to present the latestadvancements in thefield of photonic crystals,but rather to give a systematic,logical,andpedagogical introduction to this vibrantfield.The text is largely aimed at students andresearchers who want to acquire a rigorous,while intuitive,mathematical introductioninto the subject of guided modes in photonic crystals and photonic crystal waveguides.The text,therefore,favors analysis of analytically or semi-analytically solvable problemsover pure numerical modeling.We believe that this is a more didactical approach whentrying to introduce a novice into a newfield.To further stimulate understanding of thebook content,we suggest many exercise problems of physical relevance that can besolved analytically.In the course of the book we extensively use the analogy between the Hamiltonian for-mulation of Maxwell’s equations and the Hamiltonian formulation of quantum mechan-ics.We present both frequency and propagation-constant based Hamiltonian formula-tions of Maxwell’s equations.The latter is particularly useful for analyzing photoniccrystal-based linear and nonlinear waveguides andfibers.This approach allows us touse a well-developed machinery of quantum mechanical semi-analytical methods,suchas perturbation theory,asymptotic analysis,and group theory,to investigate many ofthe limiting properties of photonic crystals,which are otherwise difficult to investigatebased only on numerical simulations.M.Skorobogatiy has contributed Chapters2,3,4,5,and6of this book,and J.Y anghas contributed Chapter8.Chapters1and7were co-authored by both authors.More informationAcknowledgementsM.Skorobogatiy would like to thank his graduate and postgraduate program mentors,Professor J.D.Joannopoulos and Professor Y.Fink from MIT,for introducing him intothefield of photonic crystals.He is grateful to Professor M.Koshiba and ProfessorK.Saitoh for hosting him at Hokkaido University in2005and for having many excitingdiscussions in the area of photonic crystalfibers.M.Skorobogatiy acknowledges theCanada Research Chair program for making this book possible by reducing his teachingload.J.Y ang thanks the funding support of the US Air Force Office of Scientific Research,which made many results of this book possible.He also thanks the Zhou Pei-Yuan Centerfor Applied Mathematics at Tsinghua University(China)for hospitality during his visit,where portions of this book were written.Both authors are grateful to their graduate andpostgraduate students for their comments and help,while this book was in preparation.Especially,J.Y ang likes to thank Dr.Jiandong Wang,whose help was essential for hisbook writing.。
The Properties of Photonics

The Properties of PhotonicsPhotonics refers to the study and application of photons, or particles of light, in modern technology. This field has grown rapidly in recent years, both in terms of theoretical understanding and practical applications. In this article, we will explore some of the properties of photonics and examine how they are utilized in various fields.One property of photons is their wavelength, which determines the color of light. Visible light, the range that can be perceived by the human eye, ranges from about 400 to 700 nanometers. Longer wavelengths correspond to colors such as red and orange, while shorter wavelengths correspond to blue and purple. Light with wavelengths shorter than visible light are called ultraviolet, X-rays, or gamma rays, while those with longer wavelengths are called infrared, microwave, or radio waves.Another important property of photons is their polarization. Polarization refers to the orientation of the electric field of the photon, which affects how it interacts with other materials. Polarizers, which selectively transmit or block certain polarizations of light, are commonly used in optics and electronics.A third property of photons is their coherence, or how well their waves align with each other. Coherent light waves can interfere constructively or destructively, leading to phenomena such as diffraction and interference patterns. Laser light, which is highly coherent, is used in a wide range of applications, from cutting and welding materials to reading data on compact discs.Photonics is also important in communication technologies. Fiber-optic cables, which use light to transmit data over long distances, are widely used in telecommunications. The speed and bandwidth of fiber-optic communication make it critical for modern communication networks.Medical applications of photonics have also seen notable advancements, such as optical imaging techniques that can be used to diagnose disease. For instance, optical coherence tomography (OCT) uses low-power light to visualize tissue structures in theeye, allowing detection of early signs of eye diseases. Similarly, fluorescence imaging uses specific molecules that emit light when excited by photons to locate cancer cells or study biological processes.In conclusion, photonics is a fascinating field with a wide range of both fundamental and practical properties. The combination of its various properties and applications has made photonics an indispensable tool in various fields such as telecommunications, medical imaging, and material processing. As research and development continue, photonics will undoubtedly play an increasingly important role in shaping the technologies of the future.。
- 1、下载文档前请自行甄别文档内容的完整性,平台不提供额外的编辑、内容补充、找答案等附加服务。
- 2、"仅部分预览"的文档,不可在线预览部分如存在完整性等问题,可反馈申请退款(可完整预览的文档不适用该条件!)。
- 3、如文档侵犯您的权益,请联系客服反馈,我们会尽快为您处理(人工客服工作时间:9:00-18:30)。
I o n i z e d G a s e o u s N e b u l a e (M e x i c o C i t y , 21-24 N o v e m b e r 2000)E d i t o r s : W i l l i a m H e n n e y , J o s é F r a n c o , M a r c o M a r t o s , & M i r i a m P e ñaRevMexAA (Serie de Conferencias),12,176–178(2002)A CATALOGUE OF IJK PHOTOMETRY OF PNe WITH DENISS.Schmeja and S.KimeswengerInstitut f¨u r Astrophysik,Universit¨a t Innsbruck,Technikerstr.25,A-6020Innsbruck,Austria(stefan.j.schmeja,stefan.kimeswenger@uibk.ac.at)Near-infrared photometry of planetary neb-ulae (PNe)allows the classification of those objects (Whitelock 1985;Pe˜n a &Torres-Peimbert 1987).We present the largest ho-mogeneous sample.The DENIS imaging survey (Epchtein et al.1997)gives a nearly complete overview of the southern sky in the three NIR bands Gunn-I ,J ,and K s .The images are taken simultaneously in all three bands,which leads to a very high accuracy in the colors of the objects independent from photometric errors.Photometry on the high resolution images allowed us a much better removal of the stellar background than the aperture photometries done in the past.The 135objects presented here (see Table 1)form the largest homogeneous sample of NIR photometry of PNe so far.For the calibration of our photometry we used the DENIS online zero points,taking into account a small offset from the values derived at the Paris Data Analysis Center.The calculated magnitudes were dereddened using the extinction constants from Tylenda et al.(1992).Distances and linear radii were calculated from the 5GHz flux using the method of Schneider &Buckley (1996).About one third of the objects overlap with measurements in the literature in the J and K band (no I band photometry exists up to now).The comparison shows clearly the ex-pected effect:While the brighter objects correspond very well,about 30%of the fainter ones are system-atically brighter in the older aperture photometries (Fig.1).This is caused by uncleaned stellar back-ground in those works.Thus,the effect is signifi-cantly stronger in K than in J .Especially the values from Persi et al.(1997)suffer from this effect.We also find a correlation with the Galactic longitude:The deviations increase towards the bulge.As al-ready pointed out in the literature,there is a clear correlation of the K band photometry with the ra-dio fluxes.In the J band,the correlation is not as good.Our J values are lower than expected,which is in clear contradiction with the results of White-lock (1985).This effect is even stronger in the I band.These and other results will be discussed in more detail in a forthcoming paper.7891011121314J (DENIS)7891011121314J (L i t e r a t u r e )parison of our measured J magnitudes to val-ues from the literature:Whitelock 1985(circles),Pe˜n a &Torres-Peimbert 1987(squares),Persi et al.1987(trian-gles down),Preite-Martinez &Persi 1989(triangles up),and Philips &Cuesta 1994(diamonds).This project was supported by the FWF project P11675-AST,and by the BMBWK,Sektion VIII/A/5.Support from the organizers to partici-pate in the conference is gratefully acknowledged.REFERENCESEpchtein,N.,De Batz,B.,Capoani,L.,et al.1997,TheESO Messenger,87,27Persi,P.,Preite-Martinez, A.,Ferrari-Toniolo,M.,&Spinoglio,L.1987,Ap&SS,135,221Pe˜n a,M.,&Torres-Peimbert,S.1987,RevMexAA,14,534Philips,J.P.,&Cuesta,L.1994,A&AS,104,169Preite-Martinez,A.,&Persi,P.1989,A&A,218,264Schneider,S.E.,&Buckley,D.1996,ApJ,459,606Tylenda,R.,Acker,A.,Stenholm,B.,&K¨o ppen,J.1992,A&AS,95,337Whitelock,P.1985,MNRAS,213,59176I o n i z e d G a s e o u s N e b u l a e (M e x i c o C i t y , 21-24 N o v e m b e r 2000)E d i t o r s : W i l l i a m H e n n e y , J o s é F r a n c o , M a r c o M a r t o s , & M i r i a m P e ñaIJK PHOTOMETRY OF PNE 177TABLE 1CATALOGUE OF NIR PHOTOMETRIES OF PLANETARY NEBULAE.PN GNameIJK sE B −V(I −J )0(J −K )05GHz Ref.Distance Radius [mJy][kpc][pc]I o n i z e d G a s e o u s N e b u l a e (M e x i c o C i t y , 21-24 N o v e m b e r 2000)E d i t o r s : W i l l i a m H e n n e y , J o s é F r a n c o , M a r c o M a r t o s , & M i r i a m P e ña178SCHMEJA &KIMESWENGERTABLE 1(CONTINUED)PN GNameIJK sE B −V(I −J )0(J −K )05GHz Ref.Distance Radius [mJy][kpc][pc]。